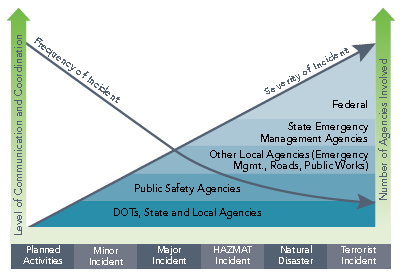
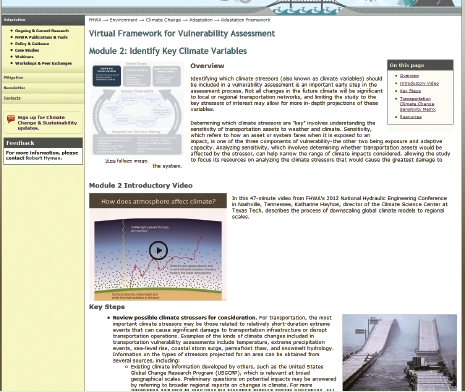
Climate Change Adaptation Guide for Transportation Systems Management, Operations, and MaintenanceIII. Steps to Adapt Transportation System Management and Operations and Maintenance Programs to Climate ChangeA. How Transportation System Management and Operations and Maintenance Work Together on Climate ChangeOver the past 10 years, State and local agencies have implemented various TSMO and maintenance strategies to mitigate the impacts of adverse weather on the transportation system. The strategies run the gamut from plowing and sanding to coordinated traffic control strategies and regional traveler information. Agencies respond to weather events through a multi-pronged approach that involves a combination of operational, maintenance, and, at times, emergency management strategies. Typical strategies used today include motorist alerts, advisories, warnings (which include roadside active warning systems and pre-trip traveler information systems), speed restrictions (variable speed limits, for example), vehicle restrictions (truck restrictions during high winds), route restrictions (road closures), anti-icing/deicing road surface treatments, plowing, and traffic signal management (weather responsive traffic management). In addition, traffic incident and emergency management practices provide agencies with the ability to marshal resources effectively to address adverse weather. Most of these approaches require multi-agency and multi-disciplinary capabilities to be brought together efficiently before, during, and after the extreme weather event. Traffic incident and emergency management collectively fall under the area of emergency transportation operations (ETO), which involves collaboration and coordination between transportation, public safety (fire, rescue, emergency medical service [EMS]), law enforcement) and emergency management communities. The roles and responsibilities of TSMO, maintenance, and emergency response managers and staff are connected and often interdependent in addressing the impacts of extreme weather and climate change on the transportation system. Each functional group has a unique set of decisions falling across the six areas of the CMF (described in section II) that may need to be examined in adapting to climate change. For example, the managers of maintenance programs will be concerned with decisions involving pavement rehabilitation needs and methods, bridge maintenance needs and methods, construction and maintenance work timelines and timeframes, and vegetation control. TSMO program managers will need to revisit other decisions such as the types of monitoring equipment and sources, communication needs, and siting criteria necessary to obtain real-time operational information on the transportation system and push information out to travelers. Emergency management leaders, in coordination with operations divisions, will look at adapting operating procedures and resource levels to prepare for hurricane evacuations or other weather-related emergencies. As is evident, TSMO functions rely on well-maintained infrastructure, and successful emergency management depends on reliable and strategically deployed TSMO infrastructure (e.g., traffic signals, contra-flow lanes, variable message signs (VMS), cameras, road weather information stations), TSMO staff, and fine-tuned operating procedures that can be leveraged during emergencies. The same holds true for maintenance, its infrastructure, and the linkage between maintenance and emergency management. The link between transportation operations and emergency management varies depending on the scale of the event. During major, catastrophic events emergency management agencies have control of the response and transportation operations. During less extreme events, the DOTs maintain control over the highways and major arterials. This difference will be important to consider when DOTs plan actions to address climate change risks in the short and long term. Figure 4 illustrates that as the level of severity of the incident increases, the number of agencies involved grows beyond the DOT to include public safety and emergency management agencies. The increase in severity also indicates that a greater level of collaboration and communication between agencies and functions is required.B. Overview of an Operations Adaptation FrameworkFHWA has developed and tested a Climate Change and Extreme Weather Vulnerability Assessment Framework (“the Framework”) (see Figure 5) which consists of a report13 and an online virtual framework (see Figure 6),14 which serve both as a guide and a collection of resources for use by transportation professionals when analyzing the impacts of climate change and extreme weather on transportation infrastructure. Its purpose is to identify key considerations, questions, and resources that can be used to design and implement a climate change vulnerability assessment. To date, the Framework has been tested by 24 pilots and has undergone a series of refinements as a result of the real-world findings. The pilots have also contributed to the plentiful body of lessons learned and example resources that are linked to the virtual version of the Framework. 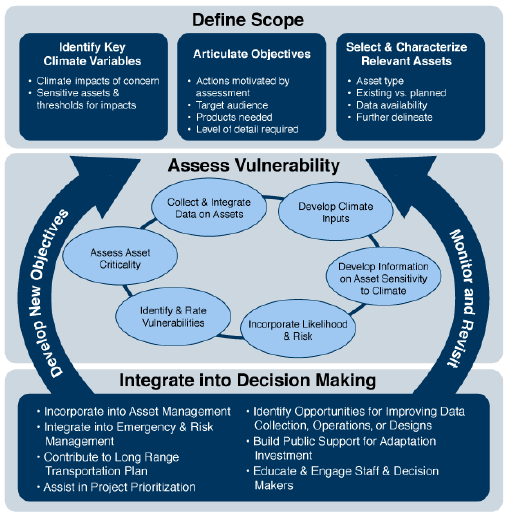 Figure 5. Diagram. FHWA Climate Change and Extreme Weather Vulnerability Assessment Framework. The FHWA Virtual Framework FHWA has developed a broad set of resources to help transportation agencies prepare for climate change. The "Virtual Framework for Vulnerability Assessment" website houses resources for State and local transportation agencies (see Figure 6). The Virtual Framework breaks the vulnerability assessment process into six modules. Each module contains step-by-step guidance, video testimonials from professionals sharing lessons on their experience, case studies related to the framework step, links to resources related to the step, and tools to help a user complete the step.
This guide is intended to complement the resources on the Virtual Framework and provide targeted guidance to staff in the TSMO and maintenance domains. Throughout this document, the Virtual Framework is referenced as appropriate, in cases where guidance (e.g., where to find climate data) is not operations-specific. The Framework, originally developed with an infrastructure planning and design focus, provides the organizing principle for understanding adaptation needs from an operations and maintenance perspective as well. Consistent with the Framework the primary components of this guide include:
While the emphasis of this guide is on concrete actions DOTs can take to integrate climate change into decision making, it is critical to also define the scope of adaptation efforts and assess vulnerabilities to inform the development of adaptation strategies. Figure 7 illustrates how TSMO and maintenance groups can use the Framework to identify and implement appropriate strategies for their unique conditions and locations. 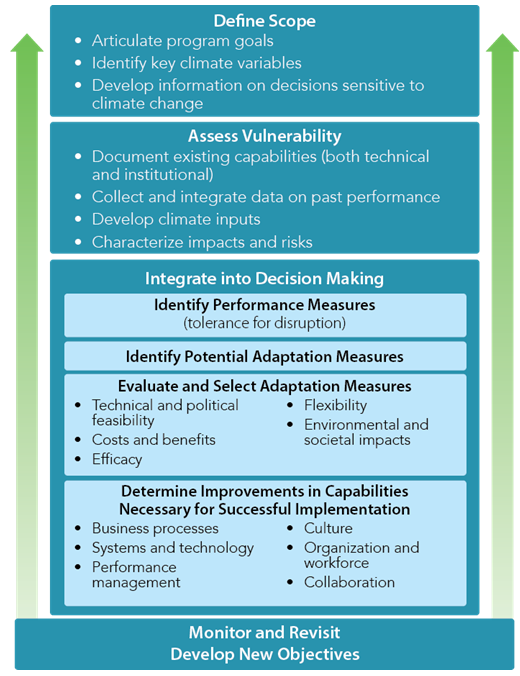 Figure 7. Diagram. Climate Change and Extreme Weather Transportation Systems Management and Operations (TSMO) and Maintenance Adaptation Framework. C. Define ScopeIt is important to articulate the objectives of the adaptation effort up front and identify the anticipated changes in climate that are most relevant to your agency. Together, these steps frame the scope of the planning effort and drive the details required; they help minimize data collection and analysis activities that would ultimately be extraneous to the desired objectives. 1. Articulate Program Goals and Operations ObjectivesTSMO and maintenance offices within agencies have long been driven by goals and objectives largely around safety, levels of service, and reliability. DOTs need to adapt to climate change to ensure they can continue to meet program goals. Program goals and operations objectives may require some updates when anticipated climate changes are taken into account. These updates may be only subtle shifts in agency focus, but should aim to define what must be achieved to ensure resilient operations. Agencies should consider what levels of performance are expected during adverse weather (which may become more frequent or intense under a changing climate) and what levels of disruption are tolerable. Demand-oriented goals and objectives (e.g., the role of the agency in serving the surge in demand that may be expected) need to be defined as well as the expectations for restoration of services and travel. Getting Started: Obtaining Buy-In A critical component to any organizational change is developing support for that change among key decision makers and stakeholders. Adapting a TSMO or maintenance program to increase climate change resiliency requires gathering support among program management, agency decision makers, program staff, and others involved in the TSMO or maintenance program activities. The level of buy-in required will depend on the scale of change desired. Below are several recommendations for gathering support for adapting a TSMO or maintenance program to prepare for the current and potential future impacts of climate change:
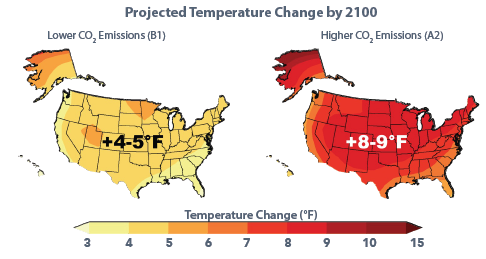
Agencies should also develop more specific, outcome-based operations objectives for the program goals. These operations objectives should be refined and tied to specific performance measures when working through sections IV.D. Assess Vulnerability and IV.E Integrate into Decision Making (and once the user has a better understanding of realistic expectations that take into account future changes in climate). 2. Identify Key Climate VariablesChanges in climate and extreme weather events will not be uniform throughout the world or even throughout the United States. It is important to identify the climate stressors or extreme weather events (e.g., increase in extreme heat, more frequent heavy precipitation, increased precipitation variability, drought, flooding, sea level rise, higher storm surges, increase in wildfire probability) that: (1) could occur locally; and (2) could affect local TSMO and maintenance programs. Examples of the geographic diversity of climate impacts can be seen in Figure 8. A complete set of resources for identifying local climate changes is available as part of Module 2 of FHWA's Virtual Framework for Vulnerability Assessment.16 Once the regional climate stressors of concern have been identified, Section D.3 explains how to refine DOTs understanding of the scale and impacts of those climate stressors on TSMO and maintenance. 3. Develop Information on Sensitivity to ClimateSensitivity = how an asset or system fares when it is exposed to an impact. Source: FHWA Virtual Adaptation Framework. As discussed below in Section D.2 Information on the past climate and the resultant impacts is useful for understanding the kinds of weather and climate effects to which assets and operations are sensitive and can help to identify thresholds beyond which future climate effects may affect those assets. It is also important to look forward and identify decisions that may be climate sensitive in the future and which decisions (e.g., standard operating practices, budget allocations) may be based on historical climate trends that no longer accurately reflect more recent trends (that have shifted due to climate change). The following is a proposed definition for climate-sensitive decisions: Decisions are climate-sensitive if their continued effectiveness could be compromised by projected changes in climatic conditions (e.g., changes in temperature, precipitation, weather patterns, and the frequency and intensity of extreme weather events). TSMO and maintenance decisions that DOTs make on a daily basis are rarely climate-sensitive, because the implications of those decisions are typically so short-lived that there is not enough time for them to be compromised by the effects of climate change. Transportation agencies make numerous short-term and long-term decisions about their TSMO and maintenance programs, however. Potential changes in extreme weather events or climate variability are relevant to many of these decisions, especially the decisions agencies make infrequently. An early step in identifying how DOTs can adapt their TSMO and maintenance programs is to identify possible entry points—existing decisions that could incorporate climate change considerations in the future. For example, knowing that there could be more frequent flooding events could change an agency’s decision about what workforce capabilities are required for the season. Table 1 provides an example of potential TSMO and maintenance decisions which may be influenced by climate change and extreme weather. Additional examples and related information are provided in Appendix A – Matrix of Climate-Sensitive Decisions. For each decision, the appendix includes a description, how climate stressors affect the decision, and which climate stressors affect the decision.
While day-to-day management of traffic operations might not be particularly sensitive to broader changes in climate, the planning required to support agile TSMO and maintenance programs may involve more climate-sensitive decisions. For example, future workforce equipment needs, facility siting, material procurement, technology deployments, business processes, and institutional arrangements typically span multiple seasons and even years. The effectiveness of such decisions made today may be compromised by changes in climate. The following list of questions can help agencies determine if a decision is climate-sensitive:
In addition, think about whether there are any specific weather thresholds at which the decisions become sensitive. Linking TSMO and maintenance practices to weather thresholds is a needed step in this process. To date, these rules have been ad-hoc and not formalized. In the past, experienced supervisors knew what activities could be scheduled based on weather conditions like precipitation, wind speeds, visibility, and temperature. There are no standard weather-related practices for maintenance or operations actions. When there are specific thresholds for weather conditions (e.g., staff cannot work without frequent breaks when temperatures are above X°F), projections on how those specific variables may change in the future can help inform planning. Identifying Weather Sensitivity Thresholds An important component of understanding how climate change may affect TSMO and maintenance practices is understanding whether there are specific weather thresholds that affect TSMO and maintenance—and then, whether those thresholds may change in the future. The links between weather, TSMO, and maintenance are often well understood at the individual level (e.g., maintenance supervisors), but these "rules" are often ad hoc and are rarely documented or formalized. Consider using the climate change planning process to capture internal guidelines and weather thresholds. For example, the table below can serve as a "template" for identifying and recording weather sensitivity thresholds. This is derived for work focused on Illinois and Iowa DOTs. The Capital Area Metropolitan Planning Organization (CAMPO) in Austin, Texas, completed a similar exercise to identify sensitivity thresholds as part of their FHWA-funded Climate Resilience Pilot Project.
Adapted from FHWA, Clarus Multi-State Regional Demonstrations, Evaluation of Use Case #3: Non-Winter Maintenance Decision Support System, "Appendix A," FHWA-JPO-11-118 (Washington, DC, 2011), available from: http://ntl.bts.gov/lib/43000/43100/43179/FHWA-JPO-11-118_Eval_Report_UC-3_FINAL.pdf. Additional information on possible impacts of climate change on transportation systems (including infrastructure and operations) can be found in TRB Special Report 290, NCHRP Report 750, among others. This and other resources are available at the FHWA Virtual Adaptation Framework Climate Change Adaptation Case Studies and Resources.18 Using Scenario Planning to Understand Climate Change Vulnerability and Risk Scenario planning is an approach to planning that is increasingly being used by transportation planning organizations to make critical decisions in the face of uncertainty. Scenario planning helps stakeholders answer questions such as what are the policies, strategies, or investments that help us achieve our goals in light of uncontrollable or unknown future conditions. Scenario planning brings together interagency and intra-agency stakeholders needed to effectively address an issue and helps them make decisions that are more robust in a variety of futures. It also helps create a more adaptive, resilient organization or program. Scenario planning could be used to help make decisions regarding adapting a TSMO or maintenance program for potential climate change impacts. Scenario planning allows organizations to explore several distinct possible futures that may result from different paths that climate change may take, analyze the potential consequences, and investigate alternative TSMO and maintenance strategies to address the issues. The scenario approach formalizes the consideration of uncertainty in preparing for climate change impacts in a systematic way. Scenario planning may also aid in helping to set expectations among planners and even the general public on acceptable levels of system performance under extreme conditions by assessing the trade-offs between levels of investment and levels of system operation during different levels of severe weather. Finally, the scenario process might also aid the region in better understanding its areas of susceptibility, thereby further helping to refine and strategically deploy TSMO and maintenance strategies. There are models (e.g., Maintenance Decision Support System (MDSS); Sea, Lake, and Overland Surges from Hurricanes (SLOSH)) that can be can be used to run extreme future event scenarios. These model runs could be used to inform a planning process that considers high heat, winter storms, summer storms, sea level rise, wildfires, or cascading impacts (e.g., power/utility failure, landslides). D. Assess VulnerabilityThe level of vulnerability assessment needed – high-level or detailed, qualitative or quantitative, statewide or localized, agency-wide or by departments – will vary based on the types of decisions required. Regardless of the exact process used, the following are key elements of a vulnerability assessment. 1. Document Existing CapabilitiesIt is important to take a look at current or baseline capabilities (assessing both technical as well as institutional capability to respond to climate and extreme weather) before seeking to determine improvements in those capabilities (discussed in Section III.E.4). The CMF provides a useful framework for assessing and documenting existing institutional capabilities (and will be discussed again later in the context of determining improvement in capabilities necessary for successful implementation of adaptation measures). The framework defines capability in terms of six areas that together inform the agency's overall ability to respond to changing conditions: business processes, systems and technology, performance management, culture, organization and workforce, and collaboration. Documenting current capabilities and identifying where those capabilities fall on the spectrum of ad-hoc implementation to planning for optimized practices will help an agency gain a better sense of how resilient they may already be to climate change and extreme weather events. 2. Collect and Integrate Data on Past PerformanceExamining previous vulnerabilities can be an excellent starting point for thinking about future vulnerabilities. Common climate change-related TSMO and maintenance program vulnerabilities include:
Internal records or other data on how the system has fared during previous extreme weather events can provide a rich source of insights into potential future vulnerabilities. Any of the following could be a source of information about system vulnerabilities:
Mining Agency Institutional Knowledge for Vulnerability Assessments Washington State DOT (WSDOT) completed a statewide climate change vulnerability assessment in 2011. Their vulnerability assessment focused on asset-level vulnerabilities, but the approach would be transferrable to TSMO and maintenance vulnerabilities. The WSDOT assessment relied on a series of workshops with WSDOT staff, including district maintenance supervisors and their staff. They asked "What keeps you up at night?" and had staff individually rate each asset's vulnerability on a scale of 1 to 10. Lower scores corresponded to reduced capacity or temporary operational failure, while higher scores corresponded to complete asset failure. Reference: WSDOT, Climate Impacts Vulnerability Assessment Report, November 2011. Available at: http://www.wsdot.wa.gov/NR/rdonlyres/B290651B-24FD-40EC-BEC3-EE5097ED0618/0/ WSDOTClimateImpactsVulnerabilityAssessmentforFHWAFinal.pdf If possible, build a dataset to correlate past extreme weather disruptions—gathered from the above sources—with information on the weather conditions associated with the event. Local National Weather Service (NWS) Forecast Offices (there are 122 nationwide) house "Weather Event Archives" that can be very useful sources of information on past extreme events.20 It is also important to share collected information across offices or departments. Getting Started: Strategies for Documenting Institutional Knowledge On-the-ground staff at DOTs are largely aware of the current weather-related problems they face on a regular basis. In addition, they are valuable resources in discussing hypothetical extreme weather scenarios, and may be able to readily identify potential points of failure. Below are several possible mechanisms to collect and document the valuable institutional knowledge of staff, which can then be leveraged to improve planning for TSMO and maintenance in the face of climate change.
3. Develop Climate InputsIn addition to gathering information on past weather disruptions and identifying key TSMO and maintenance weather sensitivities, another important component of a climate change vulnerability assessment is collecting data, qualitative or quantitative, on how climate stressors are projected to change locally. The focus should be on identifying how specific weather thresholds identified as currently affecting TSMO and maintenance activities may change in the future. Several sources exist to provide information on potential future climate changes, a selection of which are highlighted in the following text box. See Module 4 of the FHWA Framework21 for additional guidance on gathering climate inputs. Sources for Climate Inputs
In addition to collecting information on climate projections, many transportation agencies have found it helpful to collect information on historical weather conditions in order to provide context for the projections. Examine RWIS data to help establish the climate record for the area. All properly sited and maintained weather stations can be a vital part of the climate record, especially if they have been maintained for longer than 30 years. If RWIS data is not available, data can be obtained from the local weather station(s) through the National Weather Service. Understanding Uncertainty Future climate change is dependent upon the amount of global greenhouse gasses emitted. In the near term, it is easier to predict emission levels because they will likely be similar to today's rate of emissions production given the limited time for society to evolve. It is very difficult to project emission levels out 50 to 90 years into the future because it is not known how our global society will evolve over time (e.g., population growth, economic growth, energy use, development of significant technological advancements, political action mitigating emissions). Thus, the range of plausible future emissions expands over future time, along with the plausible range of climate responses.
Near term climate projections have a tighter range of possibilities, while distant climate projections have wider range of possibilities. Any projections of future climate conditions are subject to this uncertainty, but that doesn't have to prevent agencies from using this information. Scenario planning exercises can help DOTs identify adaptation strategies that increase resilience in a range of potential future conditions (see text box on page 23). 4. Characterize Impacts and RisksSynthesize information on potential climate changes, past impacts, and known sensitivities to characterize possible impacts of climate change on TSMO and maintenance programs. Determine Outputs Think about how results will be used to determine what level of information is needed to inform decisions. Options include:
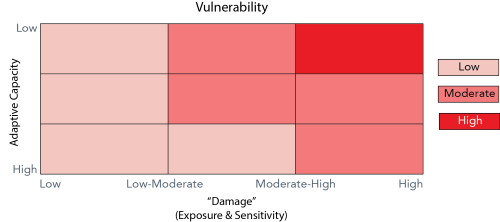
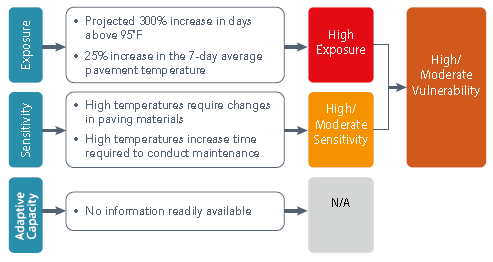 Figure 10. Diagram. Rapid Qualitative Assessment of the Vulnerability of Pavement Maintenance Program to Extreme Heat
Determine Approach Regardless of the intended outputs, there are three primary options for how to determine those outputs.
See the "Getting Started" boxes below for checklists to follow, along with tools and materials to evaluate climate change vulnerabilities or risks. Getting Started: TSMO and Maintenance Vulnerability/Risk Assessment Matrix This matrix lays out the possible areas to assess for vulnerabilities. It can be used as a "checklist" (i.e., check off each cell as it is completed), or to house assessment results (i.e., enter High, Medium, Low, or Not Applicable for each cell). Example Vulnerability Assessment Matrix – Catalog of the Potential Areas where TSMO, Maintenance, and Emergency Management Functions May be Vulnerable In each cell, rate vulnerabilities as High, Moderate-High, Low-Moderate, Low, or Not Applicable (row and column headings are intended to be illustrative rather than comprehensive)
Getting Started: Desktop Vulnerability/Risk Assessment Checklist
Getting Started: Workshop-Based Vulnerability Assessment Checklist Washington State DOT (WSDOT) Vulnerability Assessment Workshops WSDOT identified a strategic goal to "identify WSDOT facilities vulnerable to the effects of climate change and to evaluate and identify possible strategies to reduce risk." As part of an FHWA pilot program, WSDOT developed a structured, stakeholder-based approach to qualitatively assess facility risk. The project team held 14 workshops in all regions of the state in which WSDOT staff rated all State owned highways and other transportation assets for climate vulnerability. In the workshops, participants used asset maps, climate scenarios, and their local knowledge to assess vulnerability. At the start of each workshop, the project team presented a video about climate impacts on infrastructure, climate change scenarios for the state, and impact maps. A GIS specialist was on hand to overlay detailed asset inventories with climate impact data. Workshop participants then used a qualitative scoring system to assess roadway segments (or other assets) for criticality and to rate the effect that projected changes in climate would have on WSDOT infrastructure. The total number of workshop participants exceeded 200, including maintenance staff; regional office staff; and state ferry, aviation, and rail system managers. Additional information on the WSDOT vulnerability assessment approach is available at: https://www.fhwa.dot.gov/environment/climate_change/adaptation/adaptation_framework/resources/washington_state/.
E. Integrate into Decision Making1. Identify Performance MeasuresPerformance measurement can help to measure qualitative and quantitative progress towards meeting the objectives of TSMO and maintenance programs. Performance measures can also help decision makers in determining how to spend their limited budgets by focusing expenditures towards specific operational issues in order to help them improve their performance metric scoring. Many DOTs have adopted or are in the process of developing performance measures.23 If a DOT desires to become more resilient to the impacts of climate change, it is important to integrate that desire into performance measures to ensure that progress toward that goal is tracked over time. The concept of climate change adaptation and resiliency can either be integrated into existing performance measures or adopted as a stand-alone measure. Good measures are defined in part by their ability to be measurable, understandable, and meaningful.24Integrating Climate Change into Existing Objectives Florida DOT's's 2060 Florida Transportation Plan outlines six overarching goals: (1) Economic Competitiveness, (2) Community Livability, (3) Environmental Stewardship, (4) Safety and Security, (5) Maintenance and Operations, and (6) Mobility and Connectivity. Within each goal, the plan sets specific objectives. Under the fifth goal, "Maintain and operate Florida's transportation system proactively," one of four objectives is "Reduce the vulnerability and increase the resilience of critical infrastructure to the impacts of climate trends and events." The plan outlines implementation strategies and performance indicators for the goal. DOTs should consider whether revisions to existing performance measures are necessary to accommodate climate change. When setting or revising performance measures, it is important to work with local communities to establish a tolerance level for disruption (i.e., the acceptable level of operational performance if threat occurs) given the changes that are projected to occur due to climate change. It will be critical to explain that in some ways TSMO objectives may become easier while in other ways it may become harder (e.g. increased frequency and intensity of storm events). By using a scenario planning process, it can be demonstrated that in some instances, it will be harder to maintain historic levels of service (LOS) with more intense/frequent events and therefore the performance measures may need to be revised to reflect the changing reality. During this outreach process, it will also be valuable to discuss the public's mounting expectations for faster responses and constant access to a highly operational roadway system in order to emphasize the need to reach a common understanding of reasonable levels of service during extreme weather events. Getting Started: Climate Change Focused Performance Measures The table below contains a sample of operations objectives and performance measures that could be adopted by an organization looking to improve weather-related operations. These objectives and measures can also be used to focus a program on improving preparation and response to the impacts of climate change.
2. Identify Potential Adaptation Measures25Adaptation strategies should be developed to address known vulnerabilities directly—either those already experienced or those identified through a vulnerability assessment. By mapping the strategies to the vulnerabilities, there is a direct link from problem to solution. Additionally, the strategies should be developed to help achieve new or existing performance metrics.Frequently, adaptation strategies can be identified by looking to best practices in other states or regions that already experience more severe weather events. While the South may not be used to responding to ice storms, their counterparts in the North can provide guidance on how to prepare for, respond to, and recover from this type of event. This "climate shifting" is also true for extreme heat waves, flooding, landslides, wildfires, and other climate stressors. To develop strategies, review examples and best practices from other agencies and engage a diverse range of staff within the organization. The staff with longer tenures frequently knows the issues that arise during extreme weather events and can identify solutions to the problems. Best Practices from the Field
It is important to consider a diverse range of adaptation strategies to ensure that possible solutions, easy and difficult, are considered. Strategies for TSMO and maintenance should include the following types:
Table 6 provides examples of some phased adaptation strategies that agencies may wish to consider. Before selecting any strategies, agencies should understand their own vulnerabilities and undertake a more robust and location-specific adaptation strategy development process.
3. Evaluate and Select Adaptation MeasuresAs with all transportation budgeting processes, it is unlikely that DOTs will be able to fund their entire "wish-list" of adaptation strategies. In order to narrow the list of strategies to a prioritized list, it is useful to use a systematic evaluation process. San Francisco Bay Area Metropolitan Transportation Commission (MTC) In the development of its Adapting to Rising Tides study, the MTC used a series of steps to evaluate and narrow the list of potential adaptation strategies. Using a screening exercise followed by a qualitative assessment, the project team selected five strategies for further development. The screening exercise included questions on the scale and replicability of the strategy, the barriers to implementation, the urgency of action, and impacts on society/equity, environment, and economy. The qualitative assessment used an ordinal ranking system to compare the financial, social, environmental, and governance-related (e.g., funding, legal barriers) performance of the strategies. As a last level of review, the project team used its professional experience to select a final set of balanced strategies. The final report, with documentation of the adaptation action selection process, can be found here: http://files.mtc.ca.gov/pdf/MTC_ClmteChng_ExtrmWthr_Adtpn_Report_Final.pdf. Some agencies may have established evaluation criteria for projects through other processes; if so, a variation on those criteria may prove to be an effective communication tool. If no such criteria exist, the following criteria may provide a useful starting point:
Co-Benefits of Adapting DOTs should identify and account for the benefits and co-benefits of integrating specific adaptation strategies into TSMO programs. Generally, co-benefits are assessed at a qualitative level in order to help identify "win-win" strategies that increase resiliency to climate change and help to achieve other program objectives. Often, it is easier to obtain support for funding these types of solutions because they accomplish multiple goals. For example, several DOTs have justified upsizing culverts by highlighting the benefits for fish passage in addition to the increased capacity provided for increases in extreme precipitation events. Some examples of co-benefits include:
Depending on the needs of the DOT, the evaluation can be qualitative or quantitative in nature. A qualitative evaluation process is generally sufficient for selecting priorities while a quantified evaluation may be necessary in order to justify funding. A qualitative evaluation may use a simple three point or five point scale (e.g., low, medium, high or positive, neutral, negative) or rely on a narrative description of the pros and cons of the strategies. A quantitative evaluation can be more effective when competing for funding because it enables an agency to show hard numbers about the benefits of the program. Additionally, quantitative evaluation metrics (e.g., reduction in traffic delay) can be translated into financial benefits to be used in an economic assessment of the strategy. In some cases, as with FEMA Hazard Mitigation Funding, it is required to demonstrate the cost effectiveness of adaptation strategies before they will be funded. For more information on cost effectiveness tools and resources, see the Additional Resources section of this document. While evaluation metrics are a useful tool for informing the decision making process, they should not be the basis for the entire decision making process. The input of the staff who work on these programs on a daily basis and of the decision makers who understand the needs of the community are also important pieces of information to take into account during the strategy selection process. Additionally, it is recommended that the total number of evaluation measures be kept to a small set of valued measures in order to allow for the output to be digestible and meaningful. Consider Implementation Time Frames in Prioritizing Strategies Prioritize adaptation measures into short-term (0-5 years), medium-term (5-10 years), and long-term (10+ years) actions based on both the urgency of adapting (how soon the DOT needs to implement the strategy to protect against the projected climate changes) and the time period of implementation (how long it will take to implement the adaptation strategy based on planning, funding, and construction/programming time). The matrix of Climate Sensitive Decisions in Appendix A provides initial insight into the implementation time period by identifying the frequency with which the decisions are made. See the following table for examples of how the time period for implementation and the level of urgency could factor into strategy prioritization.
In addition, consider the existing repair and replacement cycle before implementing a stand-alone project. Proactive measures often make sense for high-value assets or assets that would be catastrophically damaged during extreme weather events, while continuous repair/maintenance (i.e., opportunistic adaptation efforts) is often the best approach for preparing for smaller, more frequent events and for assets that are less vulnerable to climate change. 4. Determine Improvements in Capabilities Necessary for Successful ImplementationSuccessful implementation of adaptation measures may require more overarching enhancements to the agency's capabilities. As described in Section II.E. FHWA has developed a primer that outlines six dimensions of capability that are closely associated with more effective TSMO activities (including those related to reducing climate change impacts).27 Improvements in one or more of these capabilities may be necessary to successfully implement the adaptation strategies discussed under "Identify Potential Adaptation Strategies." Table 8 denotes which of the above capabilities apply to a range of potential adaptation strategies.
F. Monitor and RevisitMonitoring and evaluating helps keep adaptation efforts on track as new information on climate risks emerges, evidence of the effectiveness of adaptation strategies becomes available, or other programmatic changes occur. Monitoring and evaluating serve to assess progress toward goals and objectives. These functions help an agency identify which activities are working well and which ones need to be refined. The FHWA Framework28 describes the following steps as key to efforts to monitor and revisit:
TSMO and maintenance programs are flexible (much more so than infrastructure planning and design decisions) and can evolve as conditions change. Monitoring trends in extreme weather events (such as frequency of particular events as well as impacts on TSMO and maintenance) and evaluating the effectiveness of actions will help to continually inform decision making. Monitoring trends in extreme weather events, for example, can help decision makers recognize when they need to manage for "new normal" conditions. As mentioned above, climate change refers to significant variations in temperature, precipitation, wind patterns, and other measures of climate lasting for an extended period of time. It may be decades before there is a robust enough set of data to attribute changes in trends to climate change. Such attribution is not necessary, though, to recognize that what once was rare is now routine. Further, collection, storage, and analysis of monitoring weather data and the impacts of extreme weather events on TSMO, maintenance, and emergency managers (e.g., through post-event assessments and documentation) may be integrated into existing asset management systems or other systems to facilitate continuous or on-demand evaluation of the effectiveness of existing practices. This can also help to assess the need to revisit assumptions, underlying data, approaches, or program goals and objectives articulated at the outset. Getting Started: Data Collection Best Practices The more transportation agencies understand the effects of weather events on their system and how those events are changing over time, the better they can make decisions about how to plan for or otherwise manage these events. Understanding changing weather effects requires collecting data and other metrics. DOTs routinely collect and analyze large amounts of data on their operations and systems. As a result, the most effective way to collect additional information that will enable DOTs to learn about the effects of climate change will be to integrate data collection and analysis into existing processes. Potential existing processes that could serve as a "home" for weather and climate tracking include asset management programs, work order or labor tracking systems, weather severity indices, and performance measures. Asset Management Programs State DOTs are in the process of developing risk-based Transportation Asset Management Plans (TAMPs), in fulfillment of MAP-21 requirements. TAMPs and associated asset management systems provide an opportunity for DOTs to integrate climate change risks alongside the other risks to transportation systems. Additional guidance is forthcoming from the National Cooperative Highway Research Program (NCHRP) on integrating climate change and extreme weather into TAMPs.29 Below are some steps DOTs can take to capitalize on their asset management efforts to help inform their decision making around climate change.
Work Orders or Labor Tracking Systems DOTs typically have systems in place to track employee activities and expenses, at least to an extent. DOTs can leverage these systems to better track the impacts of weather events over time by creating work order numbers, charge codes, or similar codes tied specifically to weather events.
Using Work Order Numbers to Track Weather Event Costs The Southeastern Pennsylvania Transportation Authority (SEPTA) began creating unique work order numbers for weather events in 2012, beginning with Hurricane Sandy. SEPTA created a unique work order number in advance of the storm and instructed staff to use that number for any time or materials spent on storm preparation, response, and recovery. As a result, SEPTA captured a much fuller picture of the impacts of Sandy on their operations than they had for previous storms. For example, SEPTA recorded more than $1.3 million in labor costs, nearly ten times the labor costs recorded during previous tropical storms—storms that were much more destructive to SEPTA than Sandy. Reference: ICF International, 2013, A Vulnerability and Risk Assessment of SEPTA's Regional Rail: A Transit Climate Change Adaptation Assessment Pilot, Federal Transit Administration (FTA Report No. 0071), available at: http://www.fta.dot.gov/documents/FTA_Report_No._0071.pdf, accessed May 20, 2015. Weather Severity Indices Many DOTs (including Wisconsin, Indiana, Iowa, Idaho, Minnesota, and Ontario) maintain a "Winter Severity Index" or similar metric that allows them to compare their seasonal expenditures to the relative severity of winter weather.32 DOTs use these indices to identify efficiencies in winter weather response over time and inform budget forecasts. DOTs may consider tracking similar severity indices for other types of weather events that affect their operations. For example:
In addition, DOTs may consider identifying specific impacts associated with climate changes and tracking the frequency of these impacts over time. This could provide a way to simplify the data tracking process by focusing on 1 to 2 key metrics of vulnerabilities over time, such as those in Table 9.
Performance Measures Finally, linking agency performance measures that are already tracked and analyzed to weather, where appropriate, can be a good way to "mainstream" weather impact data collection. See Section III.E.I for additional information on linking performance measures to climate change. Potential Pitfalls of Data Collection Potential (but avoidable) pitfalls to implementing any of these data collection strategies do exist. DOTs should note these possible drawbacks early and take steps to avoid them.
[ You will need the Adobe Reader to view the PDFs on this page. ] 12 S. Lockwood, J. O’laughlin, D. Keever, and K. Weiss, NCHRP Report 525: Surface Transportation Security Volume 6 – Guide for Emergency Transportation Operations, Washington, DC: Transportation Research Board of the National Academies, 2005. Available online at: http://onlinepubs.trb.org/onlinepubs/nchrp/nchrp_rpt_525v6.pdf. [ Return to note 12. ] 13 FHWA, Climate Change and Extreme Weather Vulnerability Assessment Framework, FHWA-HEP-13-005 (Washington, DC, 2012). Available at: https://www.fhwa.dot.gov/environment/climate_change/adaptation/publications_and_tools/vulnerability_assessment_framework/page01.cfm. [ Return to note 13. ] 14 FHWA, Virtual Framework for Vulnerability Assessment. Available online at: https://www.fhwa.dot.gov/environment/climate_change/adaptation/adaptation_framework/. Last accessed June 28, 2015. [ Return to note 14. ] 15 FHWA, Regional Climate Change Effects: Useful Information for Transportation Agencies, May 10, 2010. Available at: https://www.fhwa.dot.gov/environment/climate_change/adaptation/publications_and_tools/climate_effects/. [ Return to note 15. ] 16Module 2 of the FHWA Virtual Framework is available online at: https://www.fhwa.dot.gov/environment/climate_change/adaptation/adaptation_framework/modules/index.cfm?moduleid=2. [ Return to note 16. ] 17 J. Walsh, D. Wuebbles, et al. Climate Change Impacts in the United States: The Third National Climate Assessment, “Ch. 2: Our Changing Climate,” U.S. Global Change Research Program, 19-67, 2014. Accessible at: http://s3.amazonaws.com/nca2014/low/NCA3_Full_Report_02_Our_Changing_Climate_LowRes.pdf?download=1. [ Return to note 17. ] 18 FHWA, FHWA Virtual Adaptation Framework Climate Change Adaptation Case Studies and Resources. Available at: https://www.fhwa.dot.gov/environment/climate_change/adaptation/adaptation_framework/resources/index.cfm. [ Return to note 18. ] 19 WSDOT, Climate Impacts Vulnerability Assessment Report, November 2011. Available at: http://www.wsdot.wa.gov/NR/rdonlyres/B290651B-24FD-40EC-BEC3-EE5097ED0618/0/WSDOTClimateImpactsVulnerabilityAssessmentforFHWAFinal.pdf. [ Return to note 19. ] 20 The historical Weather Event Archives are not always easy to find on NWS Regional Forecast Office web pages, but are usually housed under the Climate section. [ Return to note 20. ] 21 FHWA Virtual Adaptation Framework. Available at: https://www.fhwa.dot.gov/environment/climate_change/adaptation/adaptation_framework/modules/index.cfm?moduleid=4. [ Return to note 21. ] 22 U.S. Department of Transportation, U.S. DOT Gulf Coast Study, Phase 2, "Task 3.1: Screen for Vulnerability," FHWA-HEP-15-019 (Washington, DC, 2014). Available at: https://www.fhwa.dot.gov/environment/climate_change/adaptation/case_studies/gulf_coast_study/engineering_and_tasks/task31.pdf. [ Return to note 22. ] 23 The FHWA Office of Operations has prepared multiple resources for agencies looking to develop and track performance measurement that are relevant to TSMO. There resources are available at: https://ops.fhwa.dot.gov/perf_measurement/. [ Return to note 23. ] 24 FHWA Operations Performance Measurement Fundamentals. Available at: https://ops.fhwa.dot.gov/perf_measurement/fundamentals/purpose.htm. [ Return to note 24. ] 25 U.S. Department of Transportation, FHWA and Federal Transit Administration, Advancing Metropolitan Planning for Operations: The Building Blocks of a Model Transportation Plan Incorporating Operations - A Desk Reference, April 2010. Available at: https://ops.fhwa.dot.gov/publications/fhwahop10027/index.htm. [ Return to note 25. ] 26 In October of 2012, FHWA launched INVEST 1.0 (Infrastructure Voluntary Evaluation Sustainability Tool), a web-based tool that helps transportation agencies incorporate sustainability considerations into their transportation programs and projects. The tool contains a module focused on operations and maintenance that enables agencies to self-assess their operations and maintenance activities with regard to sustainability. The tool is available online at: https://www.sustainablehighways.org. [ Return to note 26. ] 27 FHWA Office of Operations, Creating an Effective Program to Advance Transportation System Management and Operations: Primer, FHWA-HOP-12-003 (Washington, DC, 2012). Available at: https://ops.fhwa.dot.gov/Publications/fhwahop12003/background.htm. [ Return to note 27. ] 28 FHWA Virtual Framework for Vulnerability Assessment, Available online at: https://www.fhwa.dot.gov/environment/climate_change/adaptation/ongoing_and_current_research/gulf_coast_study/phase2_task6/page04.cfm. [ Return to note 28. ] 29 NCHRP 25-25/Task 94 (Active), "Integrating Climate Change and Extreme Weather Into Transportation Asset Management Plans," http://apps.trb.org/cmsfeed/TRBNetProjectDisplay.asp?ProjectID=3723, accessed May 20, 2015. [ Return to note 29. ] 30 U.S. Department of Transportation, "Transportation Climate Change Sensitivity Matrix," Available at: https://www.fhwa.dot.gov/environment/climate_change/adaptation/adaptation_framework/modules/index.cfm?moduleid=2, accessed May 20, 2015. [ Return to note 30. ] 31 MnDOT, MnDOT Flash Flood Vulnerability and Adaptation Assessment Pilot Project, Final report prepared for the Minnesota DOT and the USDOT FHWSA by Parsons Brinckerhoff and Catalysis Adaptation Partners, 2014. [ Return to note 31. ] 32 Will Farr and Leigh Sturges, 2012, Utah Winter Severity Index Phase 1, Utah Department of Transportation, available at: http://www.udot.utah.gov/main/uconowner.gf?n=11539601019505676, accessed May 20, 2015. [ Return to note 32. ] | |||||||||||||||||||||||||||||||||||||||||||||||||||||||||||||||||||||||||||||||||||||||||||||||||||||||||||||||||||||||||||||||||||||||||||||||||||||||||||||||||||||||||||||||||||||||||||||||||||||||||||||||||||||||||||||||||||||||||||||||||||||||||||||||||||||||||||||||||||||||||||||||||||||||||||||||||||||||||||||||||||||||||||||||||||||||||||||||||||||||||||||||||||||||||||||||||||||||||||||||||||||||||||||||||||||||||||||||||||||||||||||||||||||||||||||||||||||||||||||||||||||||||||||||||||||||||||||||||||||||||||||||||||||||||||||||||||||||||||||||||||||||||||||||||||||||||||||||||||||||||||||||||||||||||||||||||||||||||||||||||||||||||||||||||||||||||||||||||||||||||||||||||||||||||||||||||||||||||||||||
|
United States Department of Transportation - Federal Highway Administration |
||