Adaptation To Climate Change in Transportation Operations and Maintenance - Executive Decision Maker Briefing
slide 1
Adaptation To Climate Change in Transportation Operations and Maintenance
Executive Decision Maker Briefing

Printable Version [PDF, 1.9 MB]
You may need the Adobe® Reader® to view the PDFs on this page.
speaker notes
Today I am going to speak to you about adaptation to climate change in transportation systems management, operations, and maintenance
slide 2
Overview
- Climate change and extreme weather events
- Impacts of climate change on transportation systems management and operations (TSMO) and maintenance
- Why adapt to climate change?
- What does adaptation look like?
- Managing the business risk (an adaptation framework)
- Resources
speaker notes
The FHWA Office of Operations released a guide in November 2015 focusing on this topic. Drawing from this guide, I will review:
- Recent and projected trends in extreme weather events and climate change
- How those changes could affect TSMO and maintenance
- Why it is necessary to adapt to those changes
- What adaptation looks like
- A framework for managing the business risks posed by climate change, and
- Resources available to help your agency adapt TSMO and maintenance programs to climate change
slide 3
A Changing Climate
- DOTs are already observing and responding to the impacts of climate change
- Accelerating climate change means more frequent or more intense weather events (e.g., large storms, changes in winter precipitation, heat waves)
- These events will have critically important ramifications on the planning, design and engineering, management, operations, and maintenance of transportation facilities and services
speaker notes
- Scientific consensus is unequivocal that our climate is changing
- One way these changes manifest themselves is through more frequent and more intense weather events
- For example, as average temperature increases, temperature extremes become more common
- Or as climate changes, precipitation patterns become less predictable and more variable
- Transportation agencies deal with extreme weather events all the time, and have systems in place—from design standards to emergency response plans—to deal with them
- However, if these events become more frequent and/or severe, current practices may prove inadequate, so we need to update our design, management, operations, maintenance, and emergency management practices to be more resilient to a more uncertain future (weather-wise)
slide 4
A Changing Climate
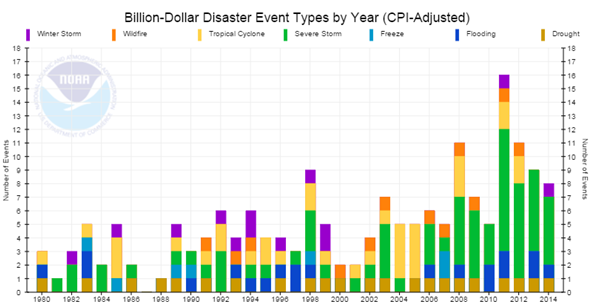
Extreme weather events are becoming more frequent and severe
speaker notes
- Recent trends in extreme weather events are becoming hard to miss
- Here, you can see NOAA tracks the “billion-dollar” weather events over time, that is the number of events that have caused at least $1B in damages (adjusted for inflation)
- The graph is clearly trending upward over time, with a spike in the number of severe storms (green shading) over the past decade
- It is important to note when looking at figures like these is that this isn’t showing exclusively that weather events are getting more severe—but that their impacts are getting more severe, which is a function of both the severity/frequency of the weather event, but also the density and value of infrastructure over time. As development increases, there is an increased chance that there will be higher costs of storm events in later years.
slide 5
Extreme Events in 2014
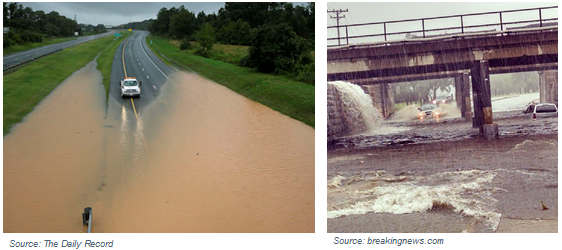
Anne Arundel County in Maryland received more than 10 inches of rain on August 12, 2014, washing out roadways
speaker notes
- Chances are your agency has experienced a few extreme events in recent years
- They are happening and have real impacts on our transportation system
- Here we can see pictures of severe flooding in Maryland from the summer of 2014 – a heavy rain storm flooded and washed out several roadways in Anne Arundel County
slide 6
Extreme Events in 2014
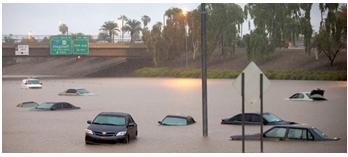
Phoenix, Arizona, broke 24-hour rainfall records with nearly 3 inches of rain on September 8, 2014, causing widespread flooding that closed Interstate highways
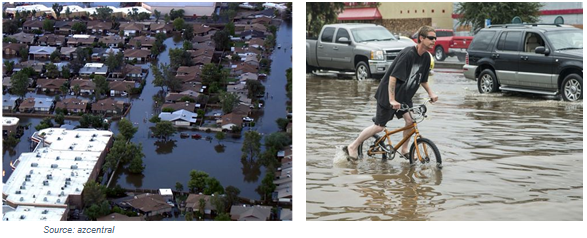
speaker notes
Floods are also happening in the Southwest – less than a month later, Phoenix experienced record rainfalls (3 inches – which goes to show that “extreme” is a relative term) that caused widespread flooding and closed several major roads and interstates
slide 7
Extreme Events in 2014
Buffalo, New York, received over seven feet of snow November 17 - 21, 2014, stranding drivers in their cars
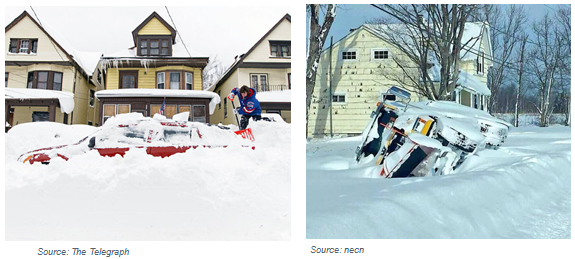
speaker notes
- Extreme weather is not limited to flooding
- Winter storms are also continuing to be destructive – just this past winter, Buffalo was buried under several feet of snow, putting obvious strain on the transportation system
slide 8
Extreme Events in 2014
California experienced a severe drought and thousands more wildfires than usual
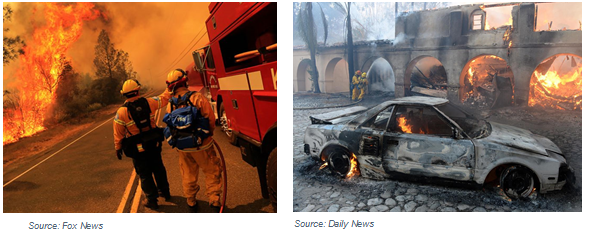
speaker notes
Wildfires are yet another type of extreme weather event – drought and heat in California are leading to an increasing number of wildfires, which also can strain transportation agencies
slide 9
Weather, Extreme Weather Events, and Climate Change
Weather refers to the state of the atmosphere in a particular location at a particular time
Extreme weather events refer to significant anomalies in temperature, precipitation and winds (e.g., heavy precipitation and flooding, heatwaves, drought, wildfires and windstorms (including tornadoes and tropical storms))
Climate refers to the weather conditions prevailing in an area over a long period of time (30 years or more)
Climate change includes major variations in temperature, precipitation, or wind patterns, among other environmental conditions, that occur over several decades or longer (e.g., a rise in sea level, increase in the frequency and magnitude of extreme weather events now and in the future)
speaker notes
- It is useful to pause here to note the distinction between weather and climate
- Weather refers to discrete events, while climate refers to general conditions over a longer period of time, usually about 30 years
- Climate determines the types of weather events that are likely to occur in a given location
- It is very difficult to look at any one specific extreme weather event and determine whether it was caused by “climate change”, but as climate shifts, it follows that weather events will change as well
slide 10
The Past Is No Longer a Reliable Predictor of the Future
Historical climate ≠ Future climate
- Because of climate change, historical climate is no longer a predictor of future climate
- Assumptions based on historical climate may need to be revisited
- Expected timing of freeze/thaw, snow melt, vegetation growth
- Rates of weather-related degradation
- Weather conditions over asset lifetime
- Optimal construction work times
speaker notes
- The bottom line on climate change is that for a long time, we were able to rely on what we knew about past climate in order to predict future climate. That paradigm no longer holds, and the past is no longer a reliable predictor of the future.
- DOTs make many assumptions based on historical climate, such as those listed on the slide, and it is those types of assumptions that may need to be revisited in light of potential changes. For example,
- DOTs currently make maintenance plans around expected vegetation/mowing cycles, freeze/thaw cycles, etc., which may shift
- Engineers also make assumptions about the expected lifetime of materials given the temperatures they are expected to experience, which may also change
slide 11
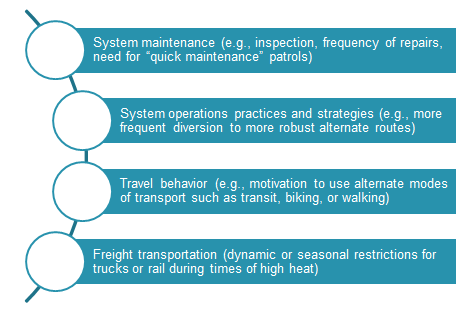
Changes will be Needed In:
speaker notes
- DOTs will need to consider changes in:
- Maintenance practices - e.g., inspections, timing
- Operations practices
- Travel behavior – reducing congestion and other demands on the roadway system will make it easier to respond to stresses (weather-related and otherwise)
- Freight transportation – e.g., weight restrictions based on freeze/thaw or speed/weight restrictions on rail based on high temperatures
slide 12
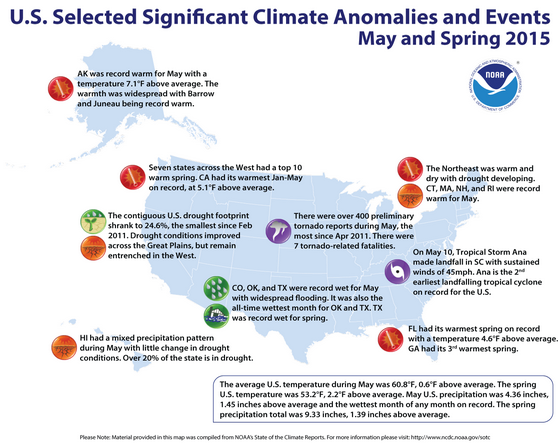
Rare Weather Events Could Become Increasingly Frequent
speaker notes
- Again, we are seeing this general effect play out across the country, as weather and climate records are being broken regularly
- For example, the Southeast had its warmest spring on record, the Southwest had record wetness for spring, etc.
- [if one of your states is highlighted on the map, discuss how the significant climate anomalies affected the work of the DOT]
slide 13
Climate Change Effects on TSMO and Maintenance
- Climate changes could result in:
- Reduced roadway capacity
- Loss of alternative routes
- Decreased situational awareness (due to power/ communications outages)
- Inability to evacuate
- Shortened service life (due to faster deterioration)
- Increased safety risk
- Loss of economic productivity
- Reduced mobility
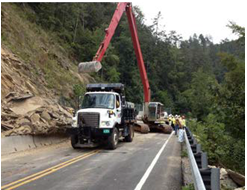
Landslide from heavy rain in August 2013.
Source: TN DOTspeaker notes
- Potential changes in climate – changes in the predictability of weather events – can affect DOTs in many ways – many more than are listed here
- In order to maintain the agency’s mission, it will be necessary to train staff to consider and prepare for climate change in their day-to-day activities
slide 14
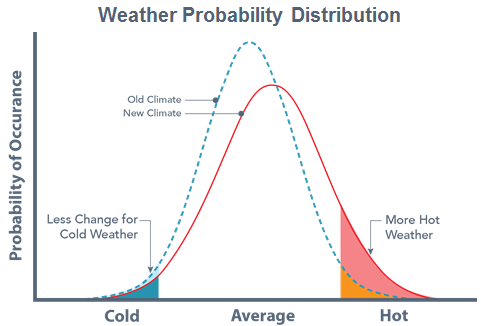
Climate Change Is Widening and Shifting Weather Probability Distributions
speaker notes
- This chart shows a general example of how that works – of how shifts in climate can lead to shifts in weather.
- This curve shows a hypothetical climate—just the temperature element--where something happens to change the climate to widen the probability distribution for extremes and the mean shifts to the right (it gets generally hotter, on average).
- The effect of this change on weather, is a minimal change in cold extremes, but a substantial increase in hot extremes.
slide 15
Why Address Climate Change?
- Climate change presents a business risk for transportation agencies
- Not addressing climate change could put transportation agencies at greater risk than changing practices now
- TSMO is the public face of extreme weather response
- Even though many agencies that are successful operators and maintainers of facilities, they still need to revisit their approach and practices given these changes
speaker notes
- Projected climate changes pose a business risk for transportation agencies – they could cause unexpected costs, delays, declines in reliability, etc.
- TSMO and maintenance practices are among the more flexible and responsive at a DOT, so you may wonder why it is necessary to do anything now, and why it might not be better to wait and see
- In many areas, “wait and see” may be the right approach, but there may be other areas where we should be changing practices now. It is important to consider now which approaches are needed for which concerns.
- TSMO and maintenance workers as well as the DOT emergency responders with whom they coordinate are and will be the public face and the front-line of the response.
- By not understanding the risk or not assessing the vulnerability of their operations, agencies could be caught off-guard by an unexpected event leading to significantly degraded capabilities when it is most needed.
- Continuing to operate in a “business as usual” way creates a greater risk for DOTs than taking some thoughtful, proactive steps now.
slide 16
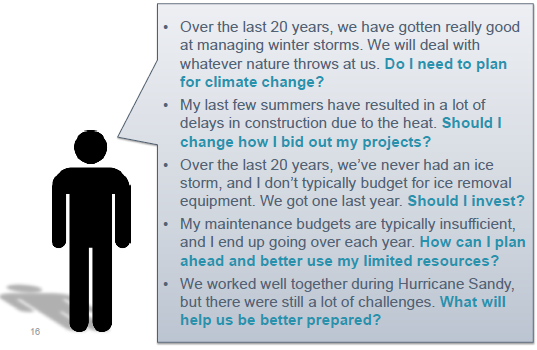
Staff May be Asking...
speaker notes
- This slide shows the types of questions that you as a decision-maker will have to consider and decide.
- There are many other types of similar questions and areas for consideration, such as training and workforce capabilities.
- The remainder of this presentation will give a taste for the types of answers—and approaches your agency can take to answer these types of questions.
slide 17
What Are Transportation Agencies Doing Thus Far?
Assessing Vulnerabilities
- Some transportation agencies have begun to assess their vulnerabilities to climate change
- Fewer have moved beyond vulnerability assessments and into adaptation planning
- Even fewer have implemented adaptation strategies and begun to evaluate their effectiveness
Focusing on Infrastructure
- Agencies have placed more emphasis to date on the implications of climate change for infrastructure planning, design, and engineering
- There has been less focus on TSMO and maintenance
speaker notes
- Some transportation agencies are already beginning to start to answer these types of questions.
- Several transportation agencies – including at least 16 DOTs – have begun conducting systematic assessments to determine how their agencies may be vulnerable to projected changes in climate
- Vulnerability assessment is an early step, though, and fewer states have moved beyond the vulnerability assessment phase into planning or implementation
- In addition, most of the focus has been on infrastructure vulnerabilities, rather than TSMO and maintenance vulnerabilities
slide 18
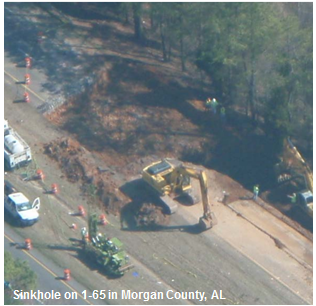
Case Study: ALDOT
- Alabama experiences hurricanes, tornados, wet and dry cycles, and snow and ice events
- Pace and severity of weather events have increased in recent years, along with public expectations about levels of service
- Post-event recovery affects ability to perform regular operations
- Infrastructure damage disrupts regular operations
 Source: Conner, G. 2013. ALDOT Operations and Extreme Weather Events. Presentation at AASHTO 2013 Extreme Weather Events Symposium,
May 22, 2013.speaker notes
- [The speaker may wish to replace this case study with an example from his/her own state]
- Alabama DOT is one example of how an agency is affected by extreme weather events.
- George Conner of ALDOT spoke at a 2013 AASHTO symposium on extreme weather events and explained that Alabama experiences a wide range of weather events that appear to be becoming more frequent.
- The weather event stresses are in conjunction with other stresses on the DOT, such as ever-increasing public expectations.
- ALDOT's response to extreme weather events is diverting resources from regular operations and preventive maintenance.
slide 19
Case Study: ALDOT
- Renewed emphasis on emergency management (EM)
- Created full-time EM position
- Improved relationship with state EM agency
- Increased recurring emergency training
- Focused on “smaller” solutions
- Portable Highway Advisory Radios (HARs)
- Coordination across and between divisions
- Procuring less specialized equipment
- Improved dissemination of road condition information in everyday and extreme events
Source: Conner, G. 2013. ALDOT Operations and Extreme Weather Events. Presentation at AASHTO 2013 Extreme Weather Events Symposium, May 22, 2013.
speaker notes
- Some agencies, like ALDOT, are adapting operations to cope with existing extreme weather conditions – and doing so without conducting formal vulnerability assessments or focusing on climate change.
- ALDOT has been bolstering their emergency management activities – creating a full-time EM position, improving intra-state coordination, and increasing recurring emergency management training at all levels.
- ALDOT also focused on specific smaller, achievable solutions such as:
- Procuring less specialized equipment – because Alabama’s weather events are increasingly varied, ALDOT began purchasing equipment that can be used in a range of event types – for example, instead of purchasing snow plows, they purchased vehicles that can be used to clear snow, tree branches, and several types of debris from roadways
slide 20
The Risk of Inaction
- Climate change could compromise agencies’ ability to provide safe, reliable transportation
- Climate change could also lead to unexpected increases in maintenance costs over time, further straining already limited resources
- Transportation agencies provide a critical public service, especially during emergency situations
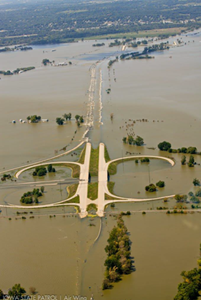 Source: Iowa DOT
speaker notes
- Photo shows severe flooding in Iowa in 2011 – the Missouri River flooded and over 60 miles of Iowa’s Primary Highway System, including 50 miles of Interstate Highways I-29, and I-680 (shown in the photo) were closed for nearly 5 months
- It was the longest duration flood event in U.S. history
- The detour for the closure of I-29 in southwest Iowa resulted in an additional 150 miles for the trip from Kansas City to Sioux Falls, SD
slide 21
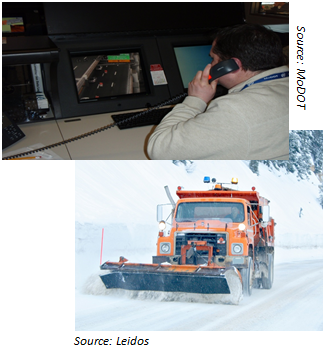
What Does Adaptation Look Like?
From a TSMO perspective, adaptation responses are still not well defined
- TSMO is traditionally seen as reactive to conditions and short-term
- It will be necessary to incorporate the needs of climate change and extreme weather events into the routine policy and practice of TSMO and maintenance
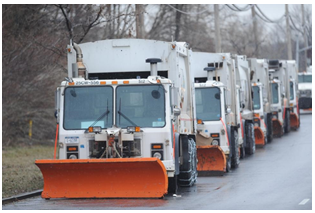 Snow plows waiting to be called into service on Staten Island, NY
Source: Mark Bonifacio, NY Daily Newsspeaker notes
- The examples from ALDOT show how DOTs are regularly adapting and improving as they experience extreme weather events
- More formal climate change adaptation responses within TSMO and maintenance are still not well defined, but some ideas are emerging…[as described on the next slide]
slide 22
Responses May Vary in the Short, Medium, and Long Term
Short term
- Increase tracking of costs to respond to specific extreme weather events
- Establish a "rainy day" fund for unexpectedly bad years
- Train existing staff about the potential impacts of climate change and how it may affect their roles and responsibilities
Medium term
- Revise budgeting processes and protocols to account for recent trends
- Increase availability of contract staff to assist during extreme events
- Develop MOUs with other agencies for equipment and staff sharing during extreme weather events
speaker notes
- This slide shows some examples of short-term and medium-term adaptation strategies.
- As you can see, they're not all revolutionary – many management best practices can also be considered adaptation strategies since they improve the agency's ability to be resilient to changing conditions
- Short-term (< 5 years) strategies include:
- Improving tracking of costs and other impacts of extreme weather events – this can help build the case for adaptation over time
- Recognizing that unexpected events can happen, and planning accordingly
- Building awareness of climate change and its risks among staff
- Medium term (5-10 years) strategies include:
- Drawing on tracked information to revise budgeting processes or procedures
- Increasing availability of contract staff to assist during extreme events
- Building partnerships with other organizations to facilitate emergency response
slide 23
What's Needed To Manage the Business Risk?
- Leadership that acknowledges the risk and charts a course to prioritize addressing it
- Programs that optimize for today’s extreme weather events to better prepare systems for a changing climate
speaker notes
- The two elements that can help agencies move toward implementation and reduction of the business risk from climate change are:
- Leadership that recognizes the risk and prioritizes addressing it across the agency
- Programs that learn from today’s weather events and continuously improve over time
slide 24
How to Begin to Manage Risk: An Adaptation Framework
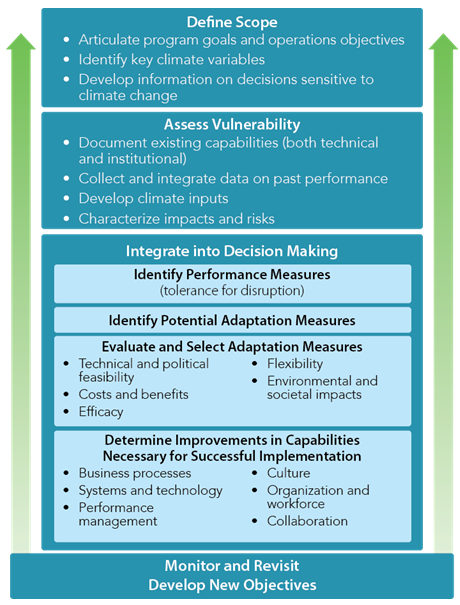
speaker notes
- The framework shown here provides an overview of how TSMO and maintenance groups can begin to take action through steps to:
- Define the scope of adaptation efforts;
- Assess vulnerabilities to inform the development of adaptation strategies; and
- Integrate climate change into decision making
slide 25
Example Actions
- Determine how extreme weather events have affected performance in the past
- Identify thresholds where extreme weather affects TSMO, maintenance, and emergency management decisions, e.g.:
- Establishing future workforce needs
- Weather response budgeting
- Setting operational objectives
- Review and update performance measures in light of extreme weather vulnerabilities
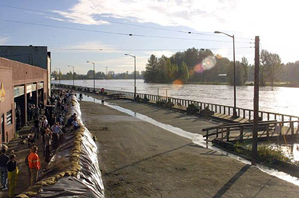 Flood-fighting efforts in Mount Vernon, WA. Source: WSDOT
speaker notes
This slide provides some examples of the types of strategies that can be undertaken to begin to adapt (and which are explained in more detail in the FHWA guide).
slide 26
Example Actions (Cont.)
- Establish work order codes for weather events to improve tracking labor, equipment, and materials costs over time
- Require after-action reports with clear recommendations for improvement following extreme events
- Update emergency response plans to factor in potential for greater frequency of extreme weather events
- Improve cross-training across staff (including across operations, maintenance, and emergency management)
speaker notes
This slide provides additional examples of the types of strategies that can be undertaken to begin to adapt (and which are explained in more detail in the FHWA guide).
slide 27
Resources
speaker notes
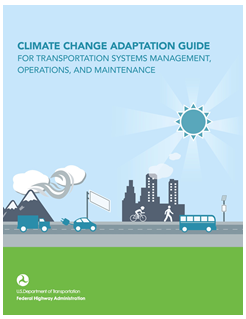
FHWA's new guide, Climate Change Adaptation Guide for Transportation Systems Management, Operations, and Maintenance provides much more information on this topic, including:
- More example actions of how DOTs can increase their resilience to climate change,
- Resources to help DOTs get started
- Case studies and examples from the field of how other agencies are adapting
- Links to other resources
slide 28
Resources (cont.)
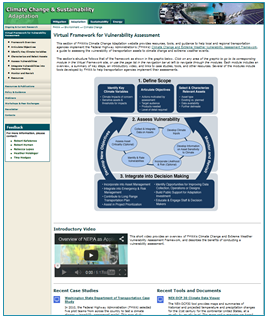
FHWA Virtual Adaptation Framework
speaker notes
Additional information is also available on FHWA's Virtual Adaptation Framework, a website that houses numerous resources to help DOTs prepare for climate change – including from an infrastructure, rather than TSMO and maintenance, perspective.
slide 29
Contact Information
[Speaker Name]
[Affiliation]
[phone]
[email]
For national-level questions, please contact:
Paul Pisano
Road Weather and Work Zone Management
Office of Operations, FHWA
202-366-1301; Paul.Pisano@dot.gov
Robert Hyman
Sustainable Transport and Climate Change Team
Office of Planning, Environment and Realty, FHWA
202-366-5843; Robert.Hyman@dot.gov
speaker notes
- [Speaker – insert your contact info here]
- You can also contact Paul Pisano, or Rob Hyman, FHWA staff who led the development of the Climate Change Adaptation Guide for Transportation Systems Management, Operations and Maintenance
slide 30
Thank You!
speaker notes
None.
|