Use of Freeway Shoulders for Travel — Guide for Planning, Evaluating, and Designing Part-Time Shoulder Use as a Traffic Management Strategy
Chapter 3. Mobility Analysis
This chapter provides a brief overview of how to conduct an operations analysis and a reliability analysis of a freeway with static or dynamic part-time shoulder use.
In general, part-time shoulder use increases the peak period operation of an existing freeway, but to a lesser degree than an additional general purpose lane. The results of operations analysis are a key metric in a performance-based practical design (PBPD) alternatives analysis process and are also inputs into other evaluation processes such as noise analysis, air quality analysis, and life- cycle cost analysis. Estimating specific operational conditions such as delay, travel time, and reliability is also a key component of performance management as reflected in Moving Ahead for Progress in the 21st Century (MAP-21).(16) The ability to quantify the operational benefits of part-time shoulder use will provide the ability to rank and prioritize part-time shoulder use projects among a region’s many other potential projects.
Shoulder Capacity
Operations analysis of part-time shoulder use with any technique requires the selection of a capacity for the lane designated for part-time shoulder use. One previous Federal Highway Administration (FHWA) study collected operational data from four part-time shoulder use facilities, and another simulated different part-time shoulder use configurations. (17, 18) Collectively, the results indicate that utilization of the shoulder varies greatly and is influenced by the “quality” of the lane, as described below.
The following operational characteristics of part-time shoulder use facilities have been observed:(17)
- Virginia I-66 eastbound
- The speed in the shoulder is approximately 5-10 mph lower than the speed in the adjacent general purpose lanes.
- The capacity of the shoulder is the same as the adjacent general purpose lanes—approximately 2,000 vehicles per hour per lane.
- The speed at capacity is approximately 55 mph.
- Minnesota I-35W northbound
- The shoulder is priced, and it is unclear if volumes reach capacity.
- The maximum observed volume in the shoulder is 1,100 vehicles per hour, and the speed at this volume is 55 mph.
- There was no significant change in adjacent general purpose lane speed after implementation of part-time shoulder use, suggesting that volume on I-35W increased.
- Washington U.S. 2 eastbound
- The volume using the shoulder when it is open is approximately one-third of the per-lane volume of adjacent general purpose lanes.
- The typical operating speed of traffic in the shoulder is approximately 50 mph, and the typical operating speed of traffic in the adjacent general purpose lanes is approximately 55 mph to 60 mph.
- Observed speed-flow curves suggest the shoulder has an operating speed of 40 mph at capacity, and the general purpose lanes have an operating speed of 50 mph at capacity.
- Massachusetts I-93
- AM peak period volume is approximately 1,000 vehicles per hour in the shoulder and 1,500 to 2,000 vehicles per hour per lane in the general purpose lanes.
- Speed at capacity is 35-40 mph in the shoulder and approximately 55 mph in the general purpose lanes.
The results indicate that design features influence shoulder capacity. The lane designated for part-time shoulder use on I-66 is 12 feet wide, has a paved shoulder several feet wide beyond it, has overhead dynamic lane control signs, and was observed to have the same capacity as adjacent general purpose lanes. The lanes designated for part-time shoulder use on I-93 in Massachusetts are less than 12 feet wide, have a one- to two-foot paved shoulder beyond the part-time shoulder use, use limited dynamic signs, and run through generally older-style interchanges with more constrained geometry than I-66. The shoulder on I-93 was observed to have only one-half to two-thirds the capacity of adjacent general purpose lanes. Additional background information on these part-time shoulder-use facilities can be found in the Appendix.
Researchers for another study used a simulation model of the I-90/I-290 corridor in Buffalo, New York, to assess various part-time shoulder use configurations.(18) I-90/I-290 does not have part-time shoulder use, but it was added to a bottleneck area in the simulation model. The simulation models were run with various part-time shoulder length, shoulder design, demand, and incident levels. The results from the part-time shoulder length and shoulder design scenarios, listed below, are most applicable to future part-time shoulder-use studies:
- Short, 1,000-foot part-time shoulder encompassing the length of the bottleneck.
- Long, 1.5-mile part-time shoulder encompassing the length of the bottleneck and the queue prior to it.
- A “low quality” part-time shoulder that is 10 feet wide, closed to trucks, and only willing to be used by 50% of drivers.
- A “high quality” part-time shoulder is 12 feet wide with “normal freeway lane design standards” that all drivers are willing to use.
Table 5 shows the simulated capacities of the four part-time shoulder use scenarios.
Table 5. Simulated part-time shoulder capacity.(18)
|
Part-time shoulder use Scenario
|
Shoulder Capacity (vehicles per hour)
|
|
Short and low quality
|
1,262
|
|
Long and low quality
|
1,334
|
|
Short and high quality
|
1,610
|
|
Long and high quality
|
1,687
|
The results are highly dependent upon simulation model settings selected by the researchers, but they suggest that part-time shoulder capacity varies greatly when a shoulder is substandard in width and other elements, making some drivers unwilling to use it. Length of a part-time shoulder use segment has a much smaller effect on utilization.
In general, it appears part-time shoulder utilization and capacity is highly dependent on design features, and dimensions meeting or exceeding the AASHTO criteria described in Chapter 7 should be provided when possible. Field-measured capacity ranges from 1,000 to 2,000 vehicles per hour, and a simulation study found capacity ranging from 1,250 vehicles per hour to 1,700 vehicles per hour. (17, 18) Right part-time shoulders that continue through interchanges and have adequate ramp merge distances were found to have a higher capacity than those that do not. Right part-time shoulders that meet or exceed the standard width of 12 feet have a higher capacity than narrower shoulder lanes. Data on left part-time shoulder use is limited.
The capacity of a standard width (12 feet) left part-time shoulder is expected to be similar to (and perhaps slightly lower than) that of the adjacent general purpose lanes. There may be some capacity reduction due to proximity to median structures, such as bridge piers and signposts, but there will be no effects of ramp traffic unless left-side ramps are present If the left part-time shoulder has limited access points connecting it to the general purpose lanes, then it will tend to have a capacity approaching that of a paint or barrier-separated high-occupancy vehicle (HOV) lane, which tends to be approximately 1600 vehicles per hour.(19, 20)
System Analysis
System analysis is usually done in the context of a regional travel-demand model or as part of a post-process analysis of the demand model outputs to obtain more-precise estimates of operational performance measures such as speed, delay, and reliability and environmental performance measures such as motor vehicle emissions. The NCHRP 7-22, Planning Applications Guide describes a post-processing approach for obtaining improved system mobility performance estimates that can be adapted for the analysis of the system performance effects of part-time shoulder use on individual facilities.(21)
For systems analysis purposes, the capacity of a part-time shoulder should be considered to be half to three-quarters of that of a general purpose lane, based upon capacities presented in the previous section.
For system analysis purposes, the congested speed and the free-flow speed of a part-time shoulder can be assumed to be virtually the same as that for the general purpose lanes. Congestion in the general purpose lanes will generally encourage drivers to use the shoulder until the speeds are better balanced, unless a different speed limit takes effect during part-time shoulder use.
Operations Analysis
Operations analysis of freeways is typically conducted with the procedures of the Highway Capacity Manual or microsimulation. Both sets of tools can be adapted for analysis of part-time shoulder use.
Highway Capacity Manual
The Highway Capacity Manual (HCM) does not provide for lane-by-lane analyses, so the shoulder must be combined with the general purpose lanes for the purpose of capacity analysis and the estimation of speed and delay. However, it is known that the shoulder will generally have a lower capacity than general purpose lanes, so a capacity reduction should be applied to all freeway lanes to account for this. Suppose a freeway with two lanes in one direction has a part- time shoulder added, and based on the design of the part-time shoulder, the capacity is expected to be half that of a general purpose lane. If the capacity of the general purpose lanes is 2,000 vehicles per hour per lane, and the capacity of the shoulder is 1,000 vehicles per hour per lane, then the facility could be analyzed as three lanes with a capacity of 1667 vehicles per hour per lane.
If the shoulder has a lower posted speed limit or design characteristics that are likely to cause the free-flow speed in the shoulder to be more than 5 mph different than the general purpose lanes, then the speed and delay may be computed separately for the general purpose lanes and the shoulder. The results are then weighted by volume to obtain an average speed and delay for the entire cross-section of the freeway.
Analysis of long freeway facilities encompassing multiple interchanges becomes complicated due to the number of analyses involved (each basic segment, ramp freeway junction, and weave), as well as the potential for the effects of one segment to affect another and the potential for the effects of one time period to influence conditions at the start of the next time period. The FREEVAL software tool, developed by TRB, addresses these issues by allowing a user to input data for multiple segments and multiple time periods at once and accounting for relationships between them. However, the complexity of the tool makes it difficult for an analyst to make manual adjustments to for account different capacities in different lanes.
Microsimulation
Microsimulation is conducted with commercial software packages, and specific settings vary from one program to another. Many microsimulation programs enable parameters to be adjusted on a per-lane basis, and speeds, capacities, and driver behavior characteristics of lanes designated for part-time shoulder use and general purpose lanes can be set to different values. Microsimulation settings could also restrict certain vehicles and certain drivers from using the shoulder.
In general, microsimulation is an order of magnitude more complex than HCM analysis. However, modifying a simulation model to account for the unique properties of lanes designated for part-time shoulder use is more straightforward than modifying HCM analysis.
Reliability Analysis
The travel-time reliability for a freeway with or without part-time shoulder use can be estimated using the methods provided in the NCHRP 3-115 Updated Highway Capacity Manual with the capacity and speed adjustments presented in the previous section.(19) There are no reliability analysis procedures that specifically account for part-time shoulder use.
In general, part-time shoulder use reduces congestion and would generally be expected to improve reliability. However, the degree to which this occurs will depend upon the frequency and duration of incidents that block the shoulder. Static and dynamic part-time shoulder use will have the same effect on peak-period reliability (assuming both are open during the peak-period), but dynamic part-time shoulder use will provide greater annual reliability because the shoulder can be opened on-demand in response to congestion.
For planning and systems analyses, the following equations adapted from SHRP2-C11 can be used to estimate link-level reliability.(22) First, the average annual travel time rate (hours/mile) including incident effects is computed:
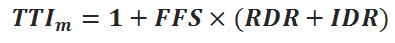
Figure 11. Equation. Average Travel Time Rate
where
TTIm = average annual mean travel time index (unitless)
FFS = Free-Flow Speed (mph)
RDR = Recurring Delay Rate (h/mi)
IDR = Incident Delay Rate (h/mi)(23)
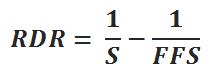
Figure 12. Equation. Recurring Delay Rate.

Figure 13. Equation. Incident Delay Rate.
where
S = peak hour speed (mph)
N = number of lanes in one direction (N = 2 to 4)
X = peak hour volume/capacity ratio
Note: IDR equation is valid for X <=1.00.
The 95th-percentile travel time index (TTI95) and percent of trips traveling at under 45 mph (PT45) then can be computed from the average annual travel time index according to the following equations.
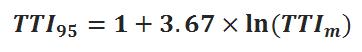
Figure 14. Equation. 95th-Percentile Travel Time Index.
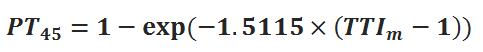
Figure 15. Equation. Percent of Trips that Occur at Speeds Less than 45 mph.
where
TTI95 = the 95th percentile TTI;
PT45 = the percent of trips that occur at speeds less than 45 mph
Before/After Studies
Most before/after studies of facilities on which part-time shoulder use was implemented have identified positive operational outcomes. Data is primarily from Europe due to the limited number of recent U.S. installations.
- On U.S. 2 in Washington State, peak period, peak direction delays on the 1.55-mile segment with part-time shoulder use decreased from 8-10 minutes to 1-2 minutes.(24)
- On the M42 motorway in the UK, average travel times increased because the speed limit was reduced. However, the variability of travel times was decreased 27-34 percent.(25)
- In the Netherlands, part-time shoulder use increased capacity by seven to 22 percent, decreased travel times from one to three minutes, and increased through traffic volumes up to seven percent during congested periods.(26)
- In Munich, Germany, part-time shoulder use created a 20-percent increase in peak hour capacity.(26)
- In the Hessen state of Germany, part-time shoulder use reduced congestion by 30 percent.(27)