2013 Urban Congestion Trends
Measuring Reliability and Congestion with Vehicle Probe Data
Printable version [PDF 349 KB]
You may need the Adobe® Reader® to view the PDFs on this page.
Contact Information: OperationsFeedback@dot.gov
What Is the Urban Congestion Report?
The quarterly Urban Congestion Report (UCR) is published by the Federal Highway Administration (FHWA) Office of Operations in Washington, D.C., to
- provide timely congestion and travel reliability information to FHWA, U.S. Department of Transportation, and state and local agencies;
- promote state and local performance monitoring to support transportation decisions; and
- demonstrate the use of the National Performance Management Research Data Set (NPMRDS) for performance monitoring.
What Is the NPMRDS and What Does It Include?
In an effort to use the best data available for the FHWA UCR program, FHWA's Office of Operations acquired the NPMRDS. This historical traffic speed data set covers the entire National Highway System (NHS). It includes observed measurements (collected 24 hours a day) and provides the user with average travel times in 5-minute intervals in three ways — freight truck, passenger vehicles, and all vehicles. FHWA has made the data set available to state and local transportation agencies to better enable them to complete the Moving Ahead for Progress in the 21st Century Act (MAP-21) performance management requirements. The data are available monthly.
What Has Changed in the UCR?
Traditionally, the UCR has been developed using archived traffic operations data from roadway sensors. The biggest change is that the UCR is now developed using vehicle-probe-based travel times beginning in October 2011 for interstates and July 2013 for other freeways and limited-access roadways. There are a number of other updates in the NPMRDS-based UCR, including
- the number of cities being reported (from 23 to 52),
- the definition of city boundaries using metropolitan statistical areas (MSAs),
- more complete roadway coverage within the cities, and
- use of Highway Performance Monitoring System (HPMS) database traffic counts for vehicle miles traveled (VMT) weighting.
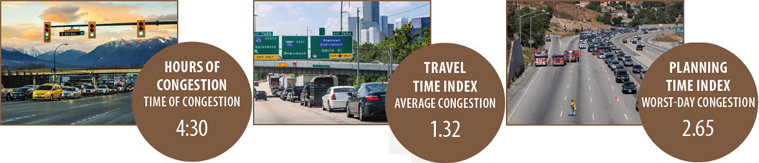
2013 Congestion Measures
Interstate highway average of 52 cities.
In 2013, the average duration of congestion (speeds less than 90 percent of free-flow speed) was 4 hours and 30 minutes on interstates. The TTI on interstates in 2013 was 1.32, and the PTI on interstates was higher at 2.65.
Hours of Congestion — amount of time when highways operate at less than 90 percent of free-flow speeds.
Travel Time Index (TTI) — time penalty for a trip on an average day. A TTI of 1.30 indicates a 20-minute free-flow trip takes 26 minutes (20 × 1.30) in the rush hours.
Planning Time Index (PTI) — time penalty for a trip to be on time for 95 percent of trips (i.e., late for work on one day per month). A PTI of 1.60 indicates a 20-minute free-flow trip takes more than 32 minutes (20 × 1.60) on the worst commute day of a month.
How Are the Data Processed?
The following highlights key calculation procedures of the NPMRDS-based UCR:
The basic spatial unit of analysis for the NPMRDS-based UCR is traffic message channel (TMC) paths, which are relatively short (an average of 1.3 miles among all 52 MSAs) directional roadway segments that are defined by a consortium of commercial traffic information providers.
As a first step in the performance measure calculation, researchers summarized the 5-minute day-by-day travel times into 15-minute monthly average travel times by day of week (e.g., each TMC path should have a travel time value for 6:00 to 6:15 a.m. for Mondays in January, 6:00 to 6:15 a.m. for Tuesdays in January, etc.).
To make meaningful year-to-year comparisons in the NPMRDS-based UCR, it is necessary to keep certain calculation parameters as consistent as possible; therefore, researchers used a 12-month trailing average (of monthly free-flow speeds) for performance measure calculations.
How Are the Measures Developed?
Congested Hours are computed as the average number of hours during specified time periods in which road sections are congested — speeds less than 90 percent of free-flow speed (e.g., 54 mph if free-flow speed is 60 mph). This measure is reported for weekdays (6:00 a.m. to 10:00 p.m.). Averages are weighted across road sections and urban areas by VMT using volumes from FHWA's HPMS.
The Travel Time Index is the ratio of the peak-period travel time as compared to the free-flow travel time. This measure is computed for the AM peak period (6:00 a.m. to 9:00 a.m.) and PM peak period (4:00 p.m. to 7:00 p.m.) on weekdays. Averages across urban areas, road sections, and time periods are weighted by VMT using volume estimates derived from FHWA's HPMS.
The Planning Time Index is the ratio of the 95th percentile travel time as compared to the free-flow travel time. The measure is computed during the AM and PM peak periods as defined in the TTI, and averages across urban areas, road sections, and time periods are weighted by VMT using volume estimates derived from FHWA's HPMS.
Facility versus Aggregate Citywide Measures — the NPMRDS travel time data are aggregated from TMC paths and presented in the UCR as citywide values to understand big-picture trends over time. State and local transportation agencies should focus on facility-level measures for project-specific evaluations and investment decision-making purposes. The measures used in the UCR (congested hours, TTI, and PTI) are also appropriate measures at the facility level to help understand local operational and financial benefits.
What Urban Areas Are Included?
Ultimately, the UCR will include all NHS limited-access highways; however, in 2013, the UCR only includes interstates in the following 52 MSAs with over 1 million in population:
- Atlanta, GA
- Austin, TX
- Baltimore, MD
- Birmingham, AL
- Boston, MA
- Buffalo, NY
- Charlotte, NC
- Chicago, IL
- Cincinnati, OH
- Cleveland, OH
- Columbus, OH
- Dallas–Fort Worth, TX
- Denver, CO
- Detroit, MI
- Hartford, CT
- Houston, TX
- Indianapolis, IN
- Jacksonville, FL
- Kansas City, MO
- Las Vegas, NV
- Los Angeles, CA
- Louisville, KY
- Memphis, TN
- Miami, FL
- Milwaukee, WI
- Minneapolis–St. Paul, MN
- Nashville, TN
- New Orleans, LA
- New York, NY
- Oklahoma, OK
- Orlando, FL
- Philadelphia, PA
- Phoenix, AZ
- Pittsburgh, PA
- Portland, OR
- Providence, RI
- Raleigh, NC
- Richmond, VA
- Riverside, CA
- Rochester, NY
- Sacramento, CA
- Salt Lake City, UT
- San Antonio, TX
- San Diego, CA
- San Francisco, CA
- San Jose, CA
- San Juan, PR
- Seattle, WA
- St. Louis, MO
- Tampa, FL
- Virginia Beach, VA
- Washington, DC
Contact Information
For more information on this report, contact Rich Taylor (Rich.Taylor@dot.gov).
Visit the Urban Congestion Report website for quarterly congestion trend updates:
www.ops.fhwa.dot.gov/perf_measurement/ucr/index.htm.

January 2015
FHWA-HOP-15-005