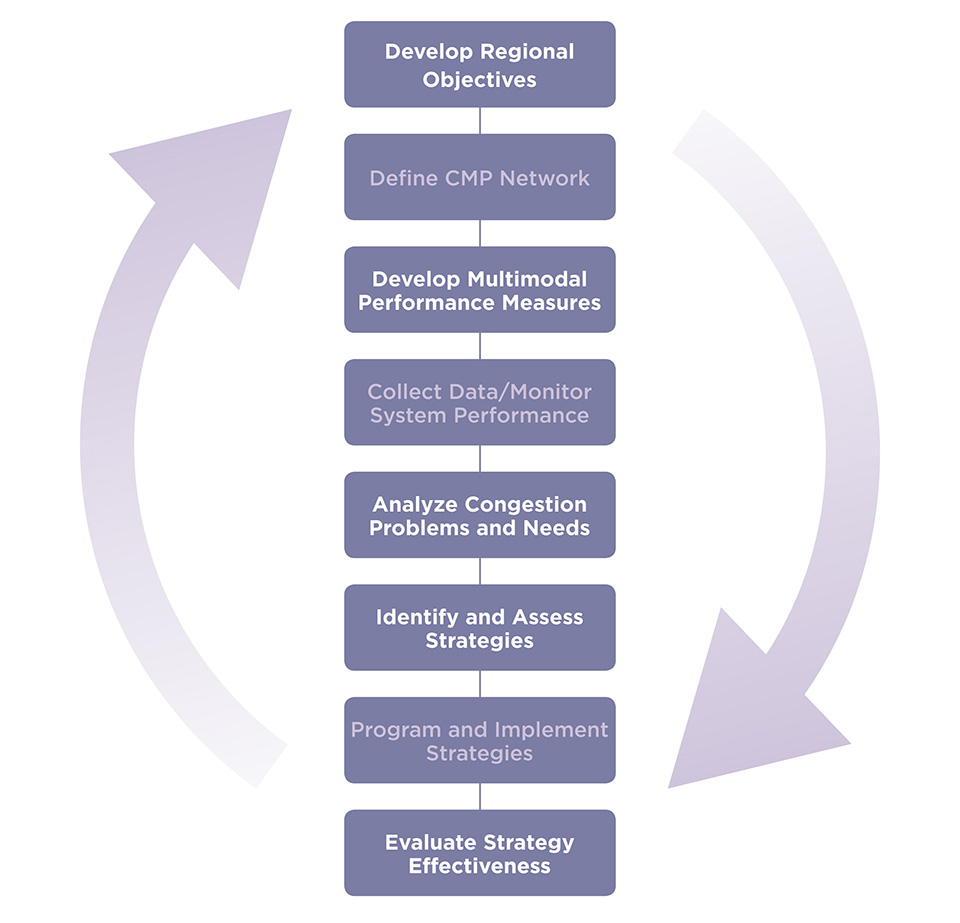
Incorporating Travel-Time Reliability into the Congestion Management Process (CMP): A PrimerChapter 2. How to Incorporate Reliability into the Congestion Management ProcessThis section identifies the key points and resources, tools, and methods for incorporating reliability into the Congestion Management Process (CMP) and for supporting Planning for Operations. Those who are not familiar with or need a refresher on the CMP are directed to Appendix A of this primer. There are many resources available to assist agencies with developing a CMP that incorporates travel-time reliability. In particular, reliability can be incorporated into the following CMP Actions that are shown in Figure 5:
Table 1 summarizes the resources referenced in this chapter. SHRP = Strategic Highway Research Program 2.1 Objectives and Performance MeasuresObjectives and Performance MeasuresObjectives are often tied directly to the performance measures chosen. A number of sample objectives listed in Table 2 utilize the following performance measures with which agency staff may be unfamiliar: Travel-time index (TTI) is the total time needed for a traveler to arrive on-time for a user-defined percent of the time. For example, the planning-time index (PTI) is a special case of the TTI indicating the total time needed for a traveler to ensure on-time arrival 95 percent of the time. Buffer index is the extra time a traveler would need to budget compared to the average travel time to ensure on-time arrival 95 percent of the time. In order for the CMP to address reliability, it is necessary to have stated objectives and performance measures for reliability. These objectives and performance measures support broad goals that are typically established in the metropolitan transportation plan (MTP).2 It is a good idea to review and update objectives and performance measures in light of new data and tools for predicting the reliability of the region's facilities. CMP updates provide frequent opportunities for these reviews. An additional motivation for ensuring that reliability is incorporated into the CMP objectives and performance measures is that it establishes a business case for dedicating funds to operations strategies through the transportation improvement program (TIP). Setting Reliability ObjectivesThe Federal Highway Administration (FHWA) report, Advancing Metropolitan Planning for Operations: The Building Blocks of a Model Transportation Plan Incorporating Operations [6] found at https://ops.fhwa.dot.gov/travel/plan2op.htm, provides the wording for several example objectives that relate to reliability performance measures. Generic examples shown in Table 2 serve as a starting point for agencies seeking to establish reliability objectives. The examples include objectives for reducing non-recurring delay, the buffer index, the planning time index (PTI), travel time, and variability. There is also a sample objective for improving transit on-time performance. Source: Adapted from Advancing Metropolitan Planning for Operations: The Building Blocks of a Model Transportation Plan Incorporating Operations — A Desk Reference, Reference Tables 3.2.2, Federal Highway Administration, FHWA-HOP-10-027. Setting Goals and ObjectivesGoals for reliability are typically developed as part of the Metropolitan Transportation Plan. They are often broadly worded, such as "Improve System Reliability." Objectives can be developed in more detail to support the region's reliability goals as part of the CMP. Agencies should examine the current reliability performance of their system before adopting goals and objectives through a public process. Another good source of information on the development of reliability objectives and performance measures is the SHRP 2 L05 report, Incorporating Reliability Performance Measures into the Transportation Planning and Programming Processes: A Guide [7]. As stated in the L05 guide, it is important to examine the current reliability performance of the system when setting MTP goals and CMP objectives. This is to ensure that the goals and objectives relate to the fundamental issues faced by the agency and are meaningful to the agency. Because MTP goals and CMP objectives are set through a collaborative process that includes stakeholders, it is important to provide the stakeholders with information on reliability to help facilitate these discussions. The L05 guide goes into more detail about the kind of data and types of information that will be useful in establishing agency reliability objectives, as shown in Table 3. Source: Incorporating Reliability Performance Measures into the Transportation Planning and Programming Processes: A Guide, SHRP 2 L05 report, Table 3-1, Transportation Research Board, Washington, DC, 2013. Selecting Reliability Performance MeasuresThe Planning Time Index (PTI)The PTI is identified in the Highway Capacity Manual as one of the most intuitive and consistent performance measures for reliability. A PTI of 1.5, for example, means that a traveler should plan on 50 percent more time for their trip compared to light traffic conditions for a 95 percent probability of arriving on time.
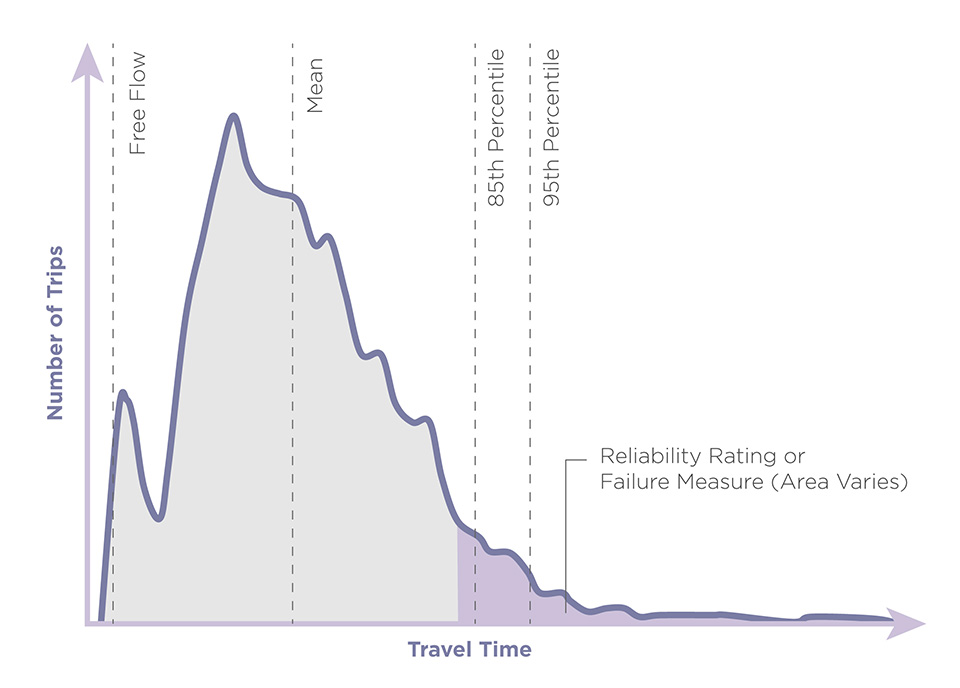
Travel-time reliability can be measured in several ways. The task is to take the entire distribution of travel times over the course of a year and represent it by a few numerical indices that can be used to measure progress towards the CMP objectives for reliability. Note: Percentile TTI is the ranking from lowest to highest of a collection of travel time indices measured over the course of a year. The 95th percentile highest TTI, is the value that 95 percent of the observations fall below. Figure 6 illustrates these measures using a sample of a travel-time distribution for an entire year (excluding weekends and holidays and non-peak hours).
Local Resources for Objectives and Performance MeasuresThe agency might consider drawing on the following resources and stakeholders in developing its reliability objectives, identifying performance measures, and seeking data on reliability.
2.2 Diagnosing Causes of Reliability ProblemsOnce an agency has committed to establishing reliability goals, objectives, and performance measures, the next steps are to identify the existing reliability problems and to diagnose their causes. As described earlier, this analysis can provide important input to stakeholders for the development of goals, objectives, and performance measures. Identifying Existing Reliability ProblemsTo identify existing reliability problems, the analyst must do the following:
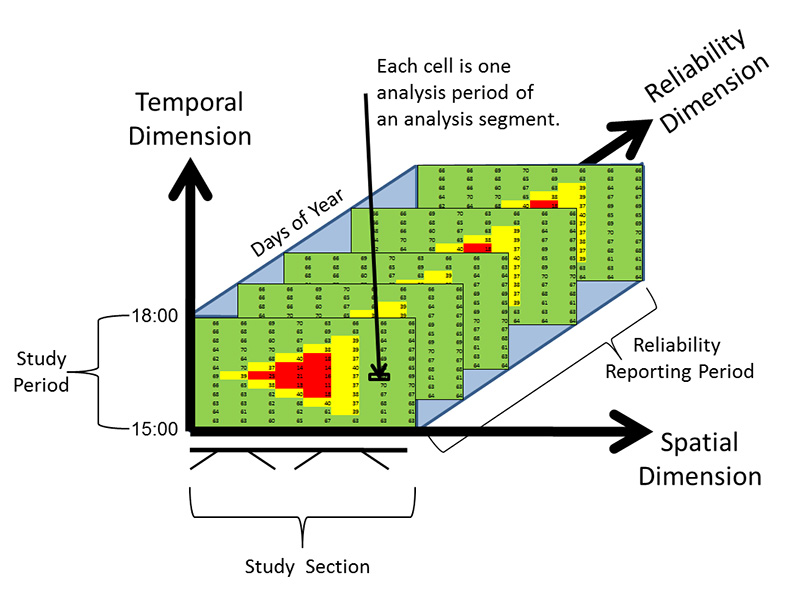
Choosing Facilities and Study Periods for Reliability AnalysisDiagnosing Causes of Reliability ProblemsSHRP 2 L02 — Establishing Monitoring Programs for Travel Time Reliability: A Guidebook [2] is a useful resource for understanding the different causes of congestion. Reliability analyses require more staff resources, more analysis resources, and more data sources than typical planning or operations analysis studies (although, much of this extra information can be handled with default inputs, as explained later). Consequently, it is wise to spend some time thinking through the exact focus of the reliability analysis. There is little to be gained by expending analysis resources on lightly traveled times of day, days of year, and lightly traveled facilities. Also, including times of day and days of year for a facility when there are likely to be few reliability problems will tend to "wash out" the results, hiding peak-period reliability problems behind an excess of light off-peak traffic conditions. If lightly-traveled days are to be included in the reliability analysis, then the analyst will want to consider whether the reliability results should be weighted according to the amount of travel each day. There is currently no explicit requirement that reliability analysis be applied to all of the facilities and modes in the CMP. Consequently, it is wise for the analyst to expend his or her resources on evaluating those facilities, days of the week, and times of the day where reliability is likely to be a significant issue. Agencies that have invested significant resources into travel-time reliability, such as the Regional Transportation Commission of Southern Nevada, divide the year into seasons that reflect normal changes in travel demand for conducting historical analysis. Reliability analysis is a three-dimensional analysis, expanding the typical single representative day analysis of a CMP to the entire year. The analyst must, therefore, specify the focus and limits of the reliability analysis both in terms of the typical CMP (peak-period, major facilities) and in terms of the days of the year covered by the analysis. Figure 7 shows the typical dimensions of time, space, and days-of-the-year involved in a reliability analysis. The example shown here is for a single direction of a freeway (the horizontal axis of this figure). The horizontal axis represents distance along the freeway from upstream to downstream. The vertical axis shows the time dimension. In this example, it is the 3-hour weekday PM peak-period extending from 3 PM to 6 PM. These first two dimensions are covered by a typical, conventional CMP analysis. The "z-axis" (the diagonal direction in the chart indicating depth) represents the number of weekdays in the year (excluding holidays) for which the reliability analysis will be performed. The matrices (composed of green, yellow and red cells within each matrix) represent the snapshot of congestion on the freeway each day. These matrices show when and where congestion starts each day, how far up the freeway the queuing extends (the red areas in the matrices), and when the congestion dissipates.
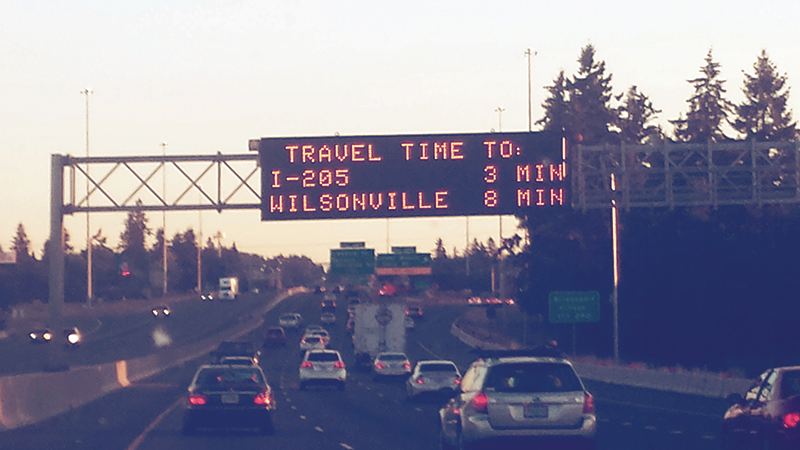
Regarding the selection of facilities for inclusion in the reliability analysis, the significance of the reliability problem on a facility will vary according to the goals, objectives, and sensitivities of the region. Generally, if a facility does not regularly experience recurring peak-period congestion (whether on the weekdays or weekends and holidays), reliability is unlikely to be a significant problem from the perspective of most public agencies. However, exceptionally frequent crashes, incidents, special events, work zones, and weather-related blockages may cause reliability to be a significant problem from the point of view of the agency and local residents, regardless of the lack of recurring peak-period congestion. How To Get Reliability DataMonitoring and Identification of Causes of CongestionCalifornia DOT (Caltrans) has invested heavily in measuring travel-time reliability and developing programs that improve operations, particularly in the San Diego region (District 11). The statewide Performance Measurement System (PeMS) is a web-based software system that collects data from over 30,000 detectors on the highway system every 30 seconds and automatically processes and stores the data. Data from other sources, such as the California Highway Patrol's Computer Aided Dispatch system, are fed into PeMS in real-time or as archived information. District 11 has taken this system further by incorporating an Arterial Performance Measurement System (A-PeMS) and a Transit Performance Measurement System (T-PeMS). More details can be found at http://pems.dot.ca.gov/. The National Performance Management Research Data Set (NPMRDS) is a travel-time data set for the National Highway System (NHS)—available to MPOs and state DOTs through FHWA—that can be used for reliability analyses. Agencies may also seek the data from commercial providers or from local traffic management centers (TMCs). The National Performance Management Research Data Set (NPMRDS)The NPMRDS contains five-minute average travel times for trucks (FHWA vehicle classes 7 and 8 only) and other motorized vehicles on the NHS (generally Interstate and the national aid highway system).3 The travel times are for traffic message channel segments, as defined by the private sector for providing driving instructions to the general public using Global Positioning Systems (GPS).4 Historical data is available starting from October 2011 for the Interstate and starting from July 2013 for all other roads on the NHS. The datasets are large and require some experience working with exceptionally large databases and Geographic Information Systems (GIS). The NPMRDS is made available to state DOTs and MPOs to use for their performance management activities through a license acquired by FHWA. Updates to the data set are made available monthly (for the prior month). To request permission to access the data set, send an e-mail to Heretraffic.nhsdata@here.com. For more information go to: https://ops.fhwa.dot.gov/perf_measurement/index.htm Other Reliability Data SourcesThere are also several other public and private sector sources of travel-time reliability data. The local TMC may be a good source of archived travel-time data for freeways in the urban area. Ideally, the travel-time data is obtained from timing the movement of vehicles along the facility. This is usually done by tracking GPS-equipped cell phones, Bluetooth devices, or toll-tags in the vehicles. Travel times may also be inferred from loop detector or video detector spot speeds. However, these estimates of travel times from spot-speed measurements will not be as good as direct point-to-point measurements of travel time. Gathering Reliability DataGenerally, a minimum of one-year of travel-time data is needed to measure reliability. Other data, such as incident logs, weather conditions, road work logs, and 24/7 traffic counts for the same period are needed for determining what proportion of the reliability problems are related to incidents, weather, construction, and demand. Estimating Reliability When Data Are Not AvailableVarious recently developed methods are available for estimating reliability when direct measurements of travel-time are not available (or where it is desired to predict future reliability under different future scenarios). These methods range from relatively quick planning methods requiring little data to more-elaborate operations analysis methods that enable the agency to test the reliability impacts of different advanced traffic operations improvements. These methods are briefly described below with references to where readers can go to get more information and to acquire the computational tools needed to employ them. The SHRP 2 L07 (Design Guide) Reliability ModelsThe SHRP 2 L07 project, Identification and Evaluation of Cost-Effectiveness of Highway Design Features to Reduce Nonrecurrent Congestion [9], developed a spreadsheet tool to predict travel-time reliability distributions. The L07 reliability estimation model employs four variables to estimate the cumulative percentile travel-time indices for demand/capacity ratios less than or equal to 80 percent. The L07 model requires the following inputs:
For more information on SHRP 2 L07 and the spreadsheet tools, go to the SHRP 2 research website. The SHRP 2 L08 (Highway Capacity Manual) Reliability Models
The SHRP 2 L08 project [10] developed a method for estimating travel-time reliability that employs the Highway Capacity Manual (HCM). As such, the SHRP 2 L08 methodology, as documented in draft chapters 36 and 37 of the HCM, is a macroscopic, operations analysis-level approach to estimating reliability.
Both methodologies require HCM operations analysis-level geometric, control, and demand inputs for the study facility. Like in the original HCM methods, defaults can be used for many of the required HCM analysis inputs. Data on demand variability is required, and both methodologies provide default demand variability factors. However, given the variation in demand variability between facilities in the same metropolitan area, it is recommended that local, site-specific data on demand variability be used whenever feasible. The freeway methodology includes two sets of default demand variability factors, one for urban freeways, the other for rural freeways. Data on weather events of the year are required. However, airport weather data for most major urban areas of the U.S. are included in both of the SHRP 2 L08 spreadsheets. The freeway methodology provides default weather event probabilities for 101 metropolitan areas of the United States. Facility-specific incident data are best, but can be estimated from crash data for the facility. At a minimum, data on crash rates for the facility are required by both methodologies. Both methodologies provide lookup tables of factors for expanding crashes to lane-closure incidents by severity and duration. For more information on SHRP 2 L08 and the spreadsheet tools, go to the SHRP 2 research website. Diagnosing the Causes of UnreliabilityIf data for calculating reliability are available from NPMRDS or other travel-time archives of this type, then the procedures provided in SHRP 2 Project L02 [2] can be used for diagnosing the causes of reliability problems. The travel times measured in the field are grouped by segment and five-minute time period. The time periods are then designated "congested" or "uncongested" based on the observed travel times. For each congested five-minute time period, the analyst scans logbooks of weather, work zones, crashes, and other incidents to assign a "cause" for the congestion. The last cause considered is "demand." That cause is assigned to the five-minute time period only if no other cause has already been assigned to the congested time period and if the demand is two or more standard deviations above the mean. The analyst then sums up the vehicle-hours traveled (VHT) or vehicle-hours of delay (VHD) for each five-minute time period and segment and tallies the results by cause. Additional details are provided in the SHRP 2 L02 Guidebook [10]. If reliability is estimated (because data is not available), the tools used to estimate reliability will provide information for assessing the causes of unreliability. The specifics vary with the tool selected. Some tools generate results automatically while others require the user to examine the calculations and separately compute the additional desired information. 2.3 Generation of Strategies for Addressing ReliabilityResourcesFor help with identifying strategies and treatments to address specific reliability problems, the following are useful resources:
Strategies should directly correlate to the identified needs regarding reliability, but they should also link back to earlier actions in the CMP such as the objectives and overall goals the region is trying to achieve with respect to reliability. The performance measures identified should be used as the means to determine how well strategies perform in addressing the region's goals and objectives. As congestion can come in two forms—both recurring and non-recurring—identification of needs and relevant strategies should be developed under both conditions. Typical strategies for addressing reliability are shown in Table 5. Reliability improvement strategies should be developed in coordination and collaboration with other government partners to maximize opportunities for consideration. It is valuable to include people with day-to-day operations planning knowledge, and others responsible for implementing operations strategies in a region.
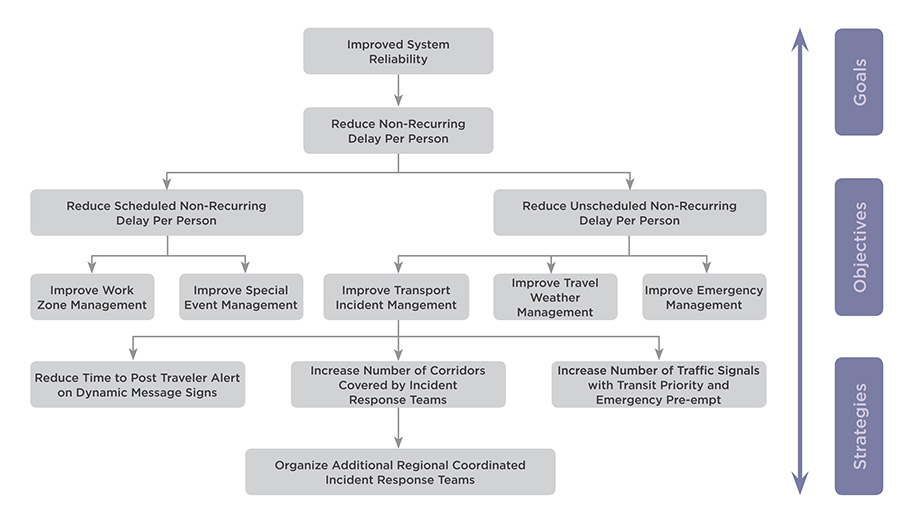
Source: Kittelson & Associates, Inc. Figure 9 illustrates the desired linkages between goals, objectives, and strategies for one example objective and a few example strategies. This figure shows how the single goal of improving system reliability can be tied to the objective of reducing non-recurring delay (one of several possible objectives that could be tied to the goal of improving system reliability). This single objective is then broken down into two more specific objectives: reducing scheduled delay (such as delay due to work zones and special events) and unscheduled delay (such as delay due to scheduled delay due to traffic incident and emergency maintenance). Scheduled delay is then reduced by considering strategies such as improving work-zone management, and improving special-event management. Unscheduled delay is addressed with strategies that improve incident management, weather travel management, and emergency management. Figure 9 also demonstrates, as an example, specific strategies that could be implemented to improve traffic incident management. Such strategies demonstrated here include reducing time for posting traveler alerts, increasing coverage by incident response teams, and increasing the number of traffic signals with emergency pre-emption. Agencies can employ a similar process to identify appropriate strategies for improving travel weather management and improving emergency management.
2.4 Evaluation of StrategiesAn evaluation is conducted to estimate the expected benefits of the strategies in comparison to their expected capital and operating cost requirements. The analysis may be quantitative or qualitative depending on the nature of the strategies and the resources available to the agency. Similar to the strategies, the evaluation criteria used in the analysis should directly link to the MTP goals and CMP objectives, CMP network, and multimodal performance measures. Strategies that move forward into funded plans should indicate strong performance through an objectives-driven, performance-based approach. In addition to travel-time reliability performance, the evaluation will involve identifying the range of capital, staffing, technology, training, and maintenance requirements of operations deployments. Table 6 presents the general range of benefits and cost-benefit ratios that can be expected for typical operations strategies. As different sources of congestion typically affect a metropolitan region, the analysis should review major recurring and non-recurring congestion problems (demand fluctuations, bottlenecks, peaking, incidents, weather, safety, construction, special events, etc.) and match problems to functional (work, recreation, freight), regional (urban and rural), corridor (thoroughfare, interstate), and network (freeways, arterials, transit) intensity and significance. Methods for forecasting the reliability effects of different improvement strategies—including SHRP 2 tools L07 and L08—are described in Chapter 2.2 , "How to Get Reliability Data," in the subsection on "Estimating Reliability When Data Are Not Available." Tool for Operations Benefit Cost Analysis (TOPS-BC).2.5 Monitoring Reliability OutcomesOnce an agency has incorporated reliability into the CMP, the next (and last) step is to monitor the outcomes of the improvements and strategies put into place by the CMP. Chapter 2.2 describes data sources and estimation methods for monitoring reliability. See FHWA's Use of Archived Operations Data in Transportation Planning [12] for examples of current practice employing archived traffic operations data in planning analyses. The monitoring cycle (the number of months or years between reviews of the system reliability) is determined by the agency. This cycle might coincide with the CMP update cycle. The frequency of monitoring depends on agency staff resources. The NPMRDS enables the agency to choose monitoring cycles as frequently as once a month. Because the CMP is an iterative process, it is dynamic and expected to be responsive to actual system performance. Strategies and actions that performed as expected, with positive benefit, may be retained in subsequent CMPs, while those that underperformed would be considered for elimination. Care must be given to fully understand how much of the performance outcome is attributable to the CMP strategy, and how much is attributed to changes in background conditions. 2 MPO practitioners tend to refer to their MTP as their long-range transportation plan (LRTP). 3 Note that MAP-21 added principal arterials to the NHS. 4 A traffic message channel segment ends when the guidance device must tell the driver to turn at the intersection or ramp gore point, when speeds change, or at state boundaries.
|
|
United States Department of Transportation - Federal Highway Administration |
||