Transportation Systems Management and Operations Benefit-Cost Analysis CompendiumCHAPTER 11. BENEFIT-COST ANALYSIS STUDIES USING MULTIPLE STRATEGIES
Note: Chapters 2, 3, and 4 of this Compendium contain a discussion of the fundamentals of benefit-cost analyses (BCA) and an introduction to BCA modeling tools. These sections also contain additional BCA references. Case Study 11.1 – Road Weather Pooled Fund Maintenance Decision Support System (MDSS) Implementation
Project Technology or StrategyAn agency considered adding an automated license plate recognition system (APLRS) for commercial motor vehicles (CMVs) to a voluntary system that uses in-vehicle transponders. The result would be an increase in mobility and efficiency by collecting data for CMVs at highway speeds using weigh-in-motion (WIM) and automatic vehicle identification (AVI) technologies. Project Goals and ObjectivesThe analysis evaluated the marginal benefits of adding an automated license plate recognition system (ALPRS) for commercial motor vehicles (CMV) to the British Columbia Ministry of Transportation's (BCMOT) Green Light Transportation System (GLTS), which BCMOT launched in the spring of 2009. GLTS was a voluntary program for CMVs to increase mobility by collecting data for CMVs at highway speeds using weigh-in-motion (WIM) and automatic vehicle identification (AVI) technologies. GLTS utilizes an in-vehicle transponder that electronically relays vehicle registration and other pertinent information to the inspection station as the vehicle approaches WIM scales. The GLTS allows vehicles that have been pre-screened to bypass physical inspection unless the system randomly selects them for inspection. The ALPRS functions similarly to the GLTS because it interfaces with the multiple databases for credentialing and enforcement purposes, but relies on photographing the front and rear license plates instead of using a transponder to relay information to the system. Because of the voluntary nature of the GLTS program, the BCMOT estimate for penetration is approximately 15 percent in 5 years. Because the ALPRS system would not require registration of CMVs, penetration is at the level of accurate plate reading, which according to tests is nearly 90 percent. BCMOT can also achieve this higher penetration in a shorter time-period. However, the GLTS system transponders provide a stop/do not stop for inspection indication up to 15 minutes before the CMV arrives at an inspection station, while the ALPRS system would require high accuracy of information passed to CMV drivers through variable message signs and drivers following those directions. The resulting conservatively estimated APLR penetration rate is 60 percent. Benefit Cost Evaluation
The benefit-cost analysis indicates that adding the automated license plate reader system to supplement an electronic credentialing system produces an estimated benefit-cost ratio of 26.2:1.
Table 53 provides the findings of the benefit-cost analysis of the ALPRS investment. According to the analysis the magnitude of the figures indicates that a substantial return on an investment would result from adding ALPR to the GLTS. The addition of ALRP increases the penetration of the credentialing system in the fleet, reduces delays, crashes and fuel consumption by allowing compliant vehicles to bypass the inspection/weigh station and by allowing enforcement officially to better target vehicles for pull overs.
1 At three selected inspection stations.
2 Province wide. Note: All cost figures are reported in 2009 Canadian dollars Source: USDOT Even if the investment in ALPR were doubled or the benefits reduced by 25 percent, this observation remains valid. However the bulk of the monetary benefits of using ALPR technology in addition to the GLTS are from collision avoidance. The evaluation of benefits and the weight placed on this benefit should be evaluated carefully. For example, there is continuous debate over the underlying values of the cost of injury and fatalities. In addition, collision avoidance was estimated from province wide figures. On the other hand, the application of the ALPR and GLTS would be at the eight inspection stations that account for the majority of the intercity movement of trucks. Even if the collision benefits were reduced by 50 percent, the benefit-cost ratio would still be substantial. The collection of revenue from fines exceeds the investment costs of the ALPR assuring that the costs of the program will be quickly recovered. Key ObservationsThis case identifies the evaluation of adding an additional operations strategy to an existing system. In this case, the agency evaluates adding an automated license plate recognition system to a voluntary system that uses in-vehicle transponders. The agency designed the existing system to increase mobility and efficiency by collecting data for CMVs at highway speeds using WIM and AVI technologies. The marginal license plate recognition system would further those goals. The benefit-cost analysis indicates that adding the automated license plate reader system to supplement an electronic credentialing system produces an estimated benefit-cost ratio of 26.2:1. The results suggest that the two technologies be integrated in the current inspection process to maximize the benefits and minimize the limitations of each. Case Study 11.2 – Cincinnati Region Advanced Regional Traffic Interactive Management & Information System (ARTIMIS) Study
Note: Chapters 2, 3, and 4 of this Compendium contain a discussion of the fundamentals of benefit-cost analyses (BCA) and an introduction to BCA modeling tools. These sections also contain additional BCA references. Project Technology or StrategyThe Ohio-Kentucky-Indiana (OKI) Regional Council of Governments, the Metropolitan Planning Organization (MPO) for the Cincinnati, Ohio region, assessed the benefits of their Advanced Regional Traffic Interactive Management and Information System, known as ARTIMIS. The ARTIMIS program is responsible for deploying and operating a number of transportation systems management and operations (TSMO) strategies in the region, including the following:
Project Goals and ObjectivesMany of ARTIMIS applications had been successfully applied to many of the key freeway corridors located within the region's suburban beltway network by the early 2000s. However, there was an increasing need to expand these capabilities to key sections of the beltway and the remaining radial freeways. Figure 55 shows the ARTIMIS expansion plans. In order to complete this expansion, the ARTIMIS program would need to compete directly for scarce funding with many more traditional roadway capacity enhancement projects, and would need to provide additional justification to decision-makers on the benefits of the program in order to secure the necessary support and funds in the regional transportation plan and transportation improvement program. 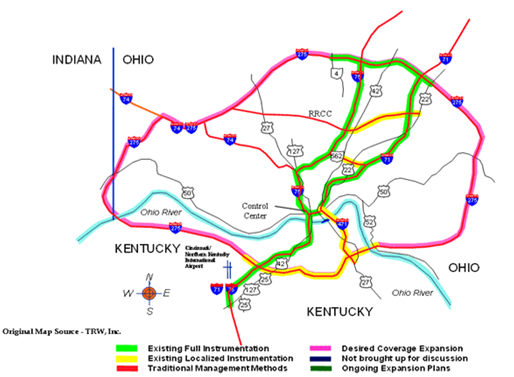 Source: Ohio-Kentucky-Indiana (OKI) Regional Council of Governments Figure 56. Diagram. Advanced Regional Traffic Interactive Management and Information System Program Expansion Plans. In response to this need, OKI launched an evaluation project to estimate the benefits and costs of the ARTIMIS program; and to compare the project with other more traditional capacity improvement projects proposed for the region. In order to provide comparable benefits and costs within the analysis, OKI carefully selected key MOEs to fully capture the benefits of the traditional and Operational projects. These measures included:
The next step was to select the appropriate analysis tools and methods. OKI weighed several alternative methods, but eventually selected a combination of their regional travel demand model merged with the Intelligent Transportation Systems (ITS) Deployment Analysis System (IDAS) software. The linking of these methods provided the needed:
Data RequirementsThe analysts next reviewed the default parameters used in the analysis for consistency with their local conditions. In particular, OKI made several adjustments in the model assumptions regarding:
Model Run ResultsThe results of the BC analysis showed the existing ARTIMIS program to be an extremely cost effective investment returning a BC ratio of 12:1, meaning that the program was generating $12 in benefits for every dollar invested. This finding itself provided strong justification for the regional investment in the program. The evaluation further compared the ARTIMIS program with several more traditional capacity expansion projects in order to provide a relative ranking of the projects. Table 54 shows selected measures, benefits, and costs of expanding the ARTIMIS program compared with a single corridor roadway widening project.
Source: FHWA TOPS BC
The benefit-cost information and project prioritization provided by the analysis were presented to decision-makers and the public through an outreach campaign. The results, made more relevant by the fact that they were generated through a valid and systematic process, were extremely valuable in making the case for investment in ARTIMIS in the region. The ARTIMIS expansion and enhancement project was identified as a high-priority project in the transportation plan and provided funding through the TIP process. Key ObservationsTSMO projects are often deployed as groups of technologies. Planners can evaluate individual technologies or strategies, but when they do, they are forced to allocate portions of costs such as the Traffic Control Center construction and operating costs to individual projects which can be arbitrary. Evaluating the deployment of multiple technologies simultaneously, including enabling technologies eliminates the challenge of cost allocation. This case evaluates a series of TSMO technologies in the Cincinnati, Ohio region. The planners choose to utilize the IDAS BCA tool to assist with their analysis. This decision was made in part due to the availability and experience with the regional travel demand model and their ability to rerun the TDM to test alternatives Conducting benefit cost analyses of TSMO projects can seem very challenging at first. However, many previous analysis and Tools are available to assist you in the process. Case Study 11.3 – Washington's Automated Anti-Icing System Study
Note: Chapters 2, 3, and 4 of this Compendium contain a discussion of the fundamentals of benefit-cost analyses (BCA) and an introduction to BCA modeling tools. These sections also contain additional BCA references. Project Technology or StrategyTo address weather-related crashes on a section of Interstate 90 near Vantage, Washington, the Washington State Department of Transportation (WSDOT) assessed the benefits and costs of deploying an automated anti-icing system to prevent the formation of pavement frost and black ice and to reduce the impact of freezing rain. The system design included the following TSMO strategies:
Project Goals and ObjectivesThe primary purpose of winter highway maintenance is to provide vehicular traffic with a roadway surface that can be safely traveled. Roadway geometrics and an icy surface may create specific locations that are particularly susceptible to snow- and ice-related accidents. WSDOT developed a BCA to explore the feasibility of incorporating an intelligent transportation system (ITS) method to assist maintenance operations at a high accident location on Interstate 90 in Washington State. It is proposed to address ice- and snow-related accidents by preventing the formation of ice on the roadway surface. The process explored by this case is with anti-icing chemicals applied to the roadway surface by an automatic anti-icing system. This BCA identifies the system costs and cost savings due to accident prevention and calculates a benefit-cost ratio. WSDOT selected the key MOE in the BCA to be Safety. MethodologyThe value of the anti-icing system approach to reducing snow- and ice-related accidents is assessed using a benefit-cost ratio, where the present worth of benefits (PWOB) divided by the present worth of costs (PWOC) equals the benefit-cost ratio. The PWOB, PWOC, and benefit-cost ratio are calculated using the WSDOT Benefit-Cost Worksheet for Collision Reduction. Cost elements include design, construction, power and communication, operations and maintenance costs. Benefits are the estimated reduction in snow, ice, and wet pavement crashes. Using historical crash data, the annual rate of collisions over a 3-year period was determined and compared to the expected rate of collisions after system implementation. Initially, it was estimated that 60 percent of snow and ice crashes would be eliminated by the proposed system, with no reduction in wet-pavement crashes. Based upon discussions with Pennsylvania DOT maintenance managers, this estimate was revised. After the revision, it was estimated that 80 percent of the snow, ice, and wet pavement crashes would be eliminated. The cost per collision was used to determine the annual safety benefit. Benefit-Cost AnalysisProject Cost. Project cost is the estimated total cost to develop and construct the system. It includes the anti-icing system (control system, chemical storage tank, distribution lines, pump, and nozzles), RWMIS, camera, connection to power and communications, and design and construction engineering. Operations and Maintenance Costs. Annual Operations & Maintenance Costs are the sum of materials, power, communications, weather forecasting, training, and system maintenance. The material is the liquid chemical. The amount needed per year was estimated by calculating the amount of chemical required to melt the expected freezing precipitation. The expected freezing precipitation was estimated to be half the weekly average winter precipitation, assuming that over a 4-month period half the precipitation would occur during periods when air and surface temperatures were above 32 degrees F. It was determined, by using this method, that approximately 12,000 gallons of liquid chemical was needed to treat the 2.4 lane miles of roadway for a 16-week winter period. Safety Benefits. Annual safety benefits are the estimated benefits of accident reduction. Only the snow- or ice-related accidents occurring during the winter time period over the 3 year study period were considered. The annual rate of collisions over a 3-year period, categorized by collision type (fatality, disabling injury, property damage only, etc.), was determined, and the expected rate of collisions after implementing the safety improvement was estimated. Estimates were based on the analyst's assumptions and data obtained from Pennsylvania DOT, which had used similar systems with positive results. The annual crash estimate was determined by multiplying the annual collision rate by the resultant factor, which is the estimated percentage of collisions expected after the improvement is implemented. According to the report, there is no history in Washington of the resultant rate of collision reduction accountable to an automatic anti-icing system. Therefore, the analysis selected a mid-range resultant factor of 0.40 based on the assumption that 60 percent of snow or ice accidents (but not wet roadway accidents) would be eliminated. The assumption was based on information from maintenance managers at Pennsylvania DOT, who had observed systems in place in Pennsylvania and indicated that accident reduction due to automatic anti-icing systems was closer to 100 percent. Given that information, further consideration was warranted. Allowing for wet pavement accidents and the possibility of ice-related accidents during a refreeze or heavy snow conditions, a higher resultant factor of 0.20 was used. Thus the study analysts presumed that 80 percent of snow- and ice-related accidents would be eliminated. Collision Costs. The cost per collision by type was determined by WSDOT. The methodology used was not described in the report. The sum of these costs represents the total cost of collisions. Service Life and Salvage Value. Service life and salvage value are derived from discussions with representatives of the private sector marketing automatic anti-icing systems. Model Run ResultsWSDOT calculated the PWOC and PWOB by a spreadsheet using the present worth factor of a uniform series, as shown below. The calculated benefit-cost ratio and net benefit are the result of the worksheet. Using this worksheet, a benefit-cost ratio of 2.36 and a net benefit of $1,179,274 was calculated. This ratio validated the viability of the proposed solution. In addition to cost savings from crash reductions, WSDOT management expects that the use of abrasives will be significantly reduced, resulting in lower cleanup costs and less damage to drainage structures. Improved levels of service should also result from the deployment, enhancing mobility. 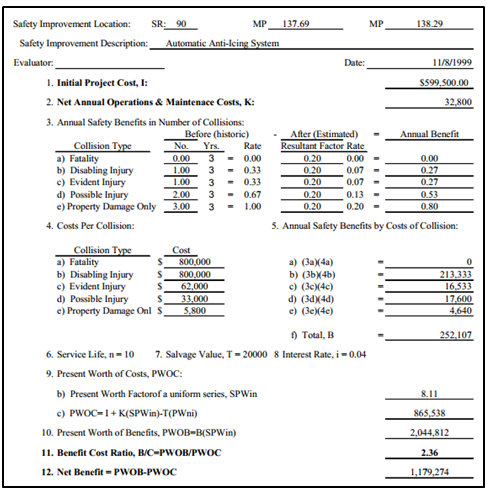 Source: Washington State Department of Transportation Figure 57. Screenshot. Washington State DOT Benefit-Cost Worksheet for Collision Reduction. Key ObservationsThe analysis indicates that the proposed automatic anti-icing system is a viable and cost-effective method of reducing the snow- and ice-related accidents in the Interstate 90 high crash corridor, with a resulting benefit-cost ratio being greater than two, and the net benefit being more than $1 million. ITS solutions to winter maintenance and operations problems are considered experimental in Washington State. This project could be considered a model to evaluate other areas on the State highway system that are prone to snow- and ice-related accidents. Overall, this ITS solution has the potential to significantly reduce accidents within this high-accident corridor and should be considered as more practical than high-cost alignment revisions. | ||||||||||||||||||||||||||||||||||||||||||||||||||||||||||||||||||||||||||||||||||||||||||||||||||||||||||||
|
United States Department of Transportation - Federal Highway Administration |
||