Ramp Metering: A Proven, Cost-Effective Operational Strategy—A Primer
1. Overview of Ramp Metering
Due to the growth of metropolitan areas and tightening of fiscal belts, the need for effective and financially viable freeway management tools is unprecedented. This primer poses ramp metering as a potential tool to address commonly occurring congestion and safety issues. Despite initial opposition and skepticism from various stakeholders, ramp metering has been deployed, sustained, and even expanded in many regions. This primer incorporates recent research on challenges agencies experience during their attempts to deploy or expand ramp metering in their regions.
While geometric limitations of existing ramps are a common challenge, agency support and project costs also pose difficulties for several agencies. Recent case studies provide insights into how these common challenges could be addressed as well as lessons learned. This primer emphasizes organizational capability, public outreach, and geometric limitations as key considerations when deploying or expanding ramp metering.
“Our region first installed ramp metering in our state’s largest urban area in the 1980s and we have steadily expanded the system since then. Other, smaller cities in our state have seen the benefits and are planning ramp meter systems.”
—Pete Briglia, former WSDOT and TRB Freeway Operations Committee Chair
1.1 What Is Ramp Metering?
Ramp meters are traffic signals installed on freeway on-ramps to control the frequency at which vehicles enter the flow of traffic on the freeway. Ramp metering reduces overall freeway congestion by managing the amount of traffic entering the freeway and by breaking up platoons that make it difficult to merge onto the freeway. As seen in Figure 1, vehicles traveling from an adjacent arterial onto the ramp form a queue behind the stop line. The vehicles are then individually released onto the mainline, often at a rate that is dependent on the mainline traffic volume and speed at that time. The configuration in the diagram is the most common; however, some agencies have altered this design to accommodate transit and high-occupancy vehicle (HOV) policies or existing geometric limitations.
Figure 1: Ramp metering configuration
Source: Parsons Brinckerhoff.
1.2 Ramp Metering and Transportation Systems Management and Operations
Ramp metering is one of many strategies in the realm of freeway management and operations that agencies use to operate the existing freeway network at full potential. Successful operation of ramp metering systems leads toward integration with other activities that actively manage the freeway network. Transportation Systems Management and Operations (TSM&O) is an integrated program, with strategies such as ramp metering, road weather management, and incident management (Figure 2), that requires continuous and active management by agencies to ultimately provide optimized system performance to existing freeway infrastructure. The end result is a program that will improve mobility, reliability, safety, and environmental impacts while preserving freeway capacity at a significantly lower cost than traditional capacity improvements. Ramp metering can also support regional congestion management processes.
Figure 2: Ramp metering within freeway management and TSM&O
Source: Parsons Brinckerhoff.
1.3 Ramp Metering Goals and Objectives
An agency’s goals and objectives for ramp metering should be consistent with regional transportation goals and objectives, which will vary from region to region. Often these goals and objectives are driven by the needs and areas of opportunity for a region. For instance, one region may want to improve safety and another may prioritize increasing mainline speed. Alternatively, some regions may want to encourage HOV and transit use. Some common priorities among agencies are safety, mobility, quality of life, environmental effects, and motorist perceptions and satisfaction. With a set of objectives in place, agency decisions, such as what kind of system or algorithm should be used, will be appropriately focused.
1.4 History of Ramp Metering
Ramp metering was first deployed in the 1960s on the Eisenhower Expressway in Chicago. In the subsequent years, ramp meters were deployed in major metro areas such as Detroit, Los Angeles, and Minneapolis/St. Paul as experiments in increasing driver speeds during peak travel periods while reducing travel times and the frequency of freeway crashes. As ramp metering strategies and techniques advanced, more metro areas across the U.S., as well as Europe and Australia, began implementing ramp metering systems.
The uniqueness of the cities furthered the advancement and refinement of ramp metering as a traffic management strategy. The different agency needs and priorities resulted in various strategies, such as preferential treatment for HOVs and transit through the designation of bypass lanes, special ramp treatments like metering multiple lanes (including ramp shoulders), and metering two or three vehicles per green. As displayed on Figure 3, ramp metering has been deployed in varying degrees of sophistication and scale across the U.S.
Figure 3: Ramp metering in the top U.S. metropolitan areas
Source: Parsons Brinckerhoff.
1.5 Benefits of Ramp Metering
When agencies implement effective ramp metering programs using strategies suitable to the region, they often realize significant, long-term benefits. While the magnitude of the benefits may vary depending on the level of congestion and configuration, common benefits persist across many regions. The widespread benefits of ramp metering, relative to its costs, make it one of the most cost-effective freeway management strategies.
Figure 4: Select regional benefits of ramp metering
Source: FHWA Ramp Management and Control Handbook.
Select environmental impacts:
- Minneapolis identified a net annual savings of 1,160 tons of emissions (Note: emission values calculated based on a simplified approach on average changes in speed).
- Other simulation analysis shows ramp metering to be effective in reducing CO emissions by 1,195 tons per year.
Mobility, Reliability, and Efficiency
Ramp metering reduces mainline congestion and overall delay, while increasing mobility through the freeway network and traffic throughput. Travel times, even when considering time in queue on the ramp, are generally reduced when ramp metering is implemented. Travel time reliability has become an important measure of ramp metering effectiveness. Many regions have experienced increased travel time reliability (reduced variations in day-to-day travel times) due to ramp metering.
Safety
Ramp meters help break up platoons of vehicles that are entering the freeway and competing for the same limited gaps in traffic. By allowing for smooth merging maneuvers, collisions on the freeway can be avoided. Many regions have reported significant reductions in crash rates after starting ramp metering.
Effective ramp queue management can prevent queues from spilling onto the adjacent arterial and clogging up the city street network with stopped vehicles that are waiting to enter the freeway.
Reduced Environmental Impacts
Ramp meters smooth the flow of traffic entering the freeway so vehicles can merge with mainline traffic with minimal disruption to traffic flow. Eliminating prolonged periods of stop-and-go conditions due to congestion can reduce vehicle emissions and fuel consumption on the freeway. It can be argued that emissions and fuel consumption increase at the ramp meter, which is why the environmental analysis must be sensitive to actual ramp operations and fuel estimation methodologies, especially with the prevalence of electric and hybrid vehicles on the roadway.
Though it is typically difficult to measure, many regions have attributed reductions in carbon emissions and fuel consumption to ramp metering implementation.
Benefit Versus Cost
A benefit/cost analysis is a comprehensive analysis to evaluate and compare the cost effectiveness of ramp metering implementation and operation against the “no ramp meter” condition. The measured benefits of implementing ramp metering systems can outweigh the associated costs by a ratio of 15 to 1, as concluded in the Twin Cities Ramp Meter Evaluation. A 15 to 1 benefit/cost ratio is excellent for transportation improvements.
1.6 Why Ramp Meters Are Effective
Without ramp meters in operation, multiple vehicles merge in tightly packed platoons, causing drivers on the mainline to slow down or even stop in order to allow vehicles to enter. The cascading slower speeds, both on the mainline and on the ramp, quickly lead to congestion and sometimes stop-and-go conditions. Ramp meters can break up the platoons by controlling the rate at which vehicles enter the mainline from the ramp, as shown on Figure 5. This allows vehicles to merge smoothly onto the mainline and reduces the need for vehicles on the mainline to reduce speed. In addition to breaking up platoons, ramp meters help manage entrance demand at a level that is near the capacity of the freeway, which prevents traffic flow breakdowns. Ramp meters are shown to reduce peak hour lane occupancies (i.e., freeway density) and quicken recovery from mainline breakdown back to or below the critical occupancy threshold, as shown on Figure 6. Typical results include reductions in travel time, reductions in crash rates, and increased traffic speed.
Figure 5: Comparison of mainline conditions with and without ramp metering
Source: Washington State Department of Transportation.
Figure 6: Duration of occupancy at shutdown capacity before and after ramp metering
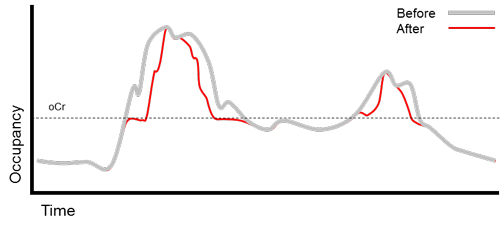
Source: Parsons Brinckerhoff.
1.7 Ramp Metering Analysis Tools
The technology utilized by ramp meters has evolved to offer increased scalability, efficiency, and customization. Through developed simulations and databases, agencies can model the effects of ramp metering on their existing freeway operations. These exercises can aid in the decision-making and planning process when planning for ramp metering deployment or expansion.
Simulation models can aid in determining what control algorithm would be most appropriate to manage freeway congestion based on user-defined inputs on system conditions. Computer-based simulations can estimate a set of traffic measures, such as travel time speed, for a given freeway corridor. The simulations can use new operational strategies like adaptive ramp metering coded directly into the software so that realistic environments can be evaluated for a proactive approach to congestion management.
Optimal ramp meter operations require robust data collection and analysis. Data regarding traffic volumes, travel times, and other appropriate performance measures should be collected, modeled, and analyzed both before and after ramp meters are installed. Volume data is collected in the form of video or loop detection along the ramp and on the freeway mainline upstream and downstream of the ramp.
An integrated database, that contains data such as roadway inventory, detector data, traffic counts, crash records, and incident records, can streamline the process to evaluate the effectiveness of various ramp metering strategies or algorithms. The evaluation database not only reduces the effort to collect all these data sets independently, but can be used with enhanced data sets and could provide the data needed to support visualization of various ramp metering scenarios.
1.8 Ramp Metering Control Approaches
Depending on the existing infrastructure, constraints, or objectives of the ramp metering program, an agency may select various ramp metering approaches. Table 1 provides details on various levels of control, including appropriate situations to use each approach. The following is a high-level overview of commonly used control approaches for ramp metering:
Single or Multi-Lane Metering—Single lane metering allows only one vehicle to enter the freeway during each signal cycle. Multi-lane metering requires two or more lanes to be provided on the ramp and a signal head dedicated to each lane. After the stop bar, the lanes are required to merge into a single lane before merging onto the freeway.
Single or Dual Release Metering—One vehicle per green (or single release metering), operates with a shorter green time than with a two vehicles per green (or dual release) approach. Dual release allows for two vehicles to enter the freeway each cycle but requires a longer green time. The dual release metering approach usually increases ramp capacity under metering.
Freeway-to-Freeway Connections—Ramp metering on freeway-to-freeway ramps is less common due to the high travel speeds and the perceived increased potential for vehicle collisions because of vehicle queues where drivers may not expect them. Geometric constraints also exist such as limited sight distance along a curved roadway and limited provisions to provide the required storage for queued vehicles on ramps. Freeway-to-freeway metering, if possible, can significantly improve the ability to manage traffic on a freeway because a greater share of entering traffic is controlled by meters.
Bypass Lanes—Bypass lanes allow a specific class of vehicle (usually an HOV, a bus, or, in some locations, a truck) to avoid delay at ramp meters and have the right of way to merge directly on to the freeway. Bypass lanes may have a single detection loop, actuations of which could incrementally increase the length of the ramp meter cycle each time a vehicle is detected.
Table 1: Summary of ramp metering approaches
 |
Pre-Timed |
Traffic Responsive |
| Local |
- Appropriate for localized problems.
- Detection in the field is not needed.
- Requires periodic manual updates.
- Not effective for non-static conditions.
- Higher operations costs compared to traffic responsive systems.
|
- Appropriate for localized problems.
- Detection in the field is needed.
- Higher capital and maintenance costs compared to pre-timed systems.
- Yields greater benefits because it responds to conditions in the field.
|
| System-wide |
- Appropriate for widespread problems.
- Detection in the field is not needed.
- Rarely used compared to system-wide, traffic responsive systems.
|
- Appropriate for widespread problems.
- Detection in the field is needed.
- Most useful for corridor, system-wide applications.
- Greatest capital and maintenance costs, but yields most benefits.
|
1.9 Ramp Metering Components
Ramp metering requires some essential components and equipment in order to operate safely and effectively. Configuration, communication, and safety are objectives agencies should consider when placing signal heads, detectors, and signs. The following are key components in most ramp metering setups:
Signal Heads—The signal heads used for ramp metering are either two-section or three-section heads. Two section heads have green and red indications. Three section heads include the yellow indication and may be more familiar to most drivers.
Detectors—Detectors are necessary to monitor condition on the ramp and mainline. For instance, the signal should only turn green when a vehicle is detected at the stop bar. Queue detectors can also be used to monitor and manage queue length when placed upstream of the stop bar. Detectors can also monitor demand on the mainline and merge points to aid in determining the metering rate. Detection equipment on the ramps themselves (such as stopbar located demand detectors) should be connected directly to the ramp controller cabinet.
Signage—Signs should be placed at the start of the ramp and near the signal head. The sign content can provide instruction to vehicles when they enter the ramp and at the signal. Upstream signs with lights or adaptive screens can also indicate whether the ramp is being metered at a given time. Proper signage will facilitate clear communication and compliance with the established system.
1.10 Ramp Metering Algorithms
There are a wide range of ramp metering control strategies and algorithms. The three primary types of control strategies are fixed time, local control, and system-wide control. Fixed time metering is the simplest approach in terms of implementation because it has no reliance on traffic detection or communication with a Traffic Management Center. However, it is also the most rigid since it cannot make adjustments to the metering rate based on changing real-time mainline or ramp conditions. Both system-wide and local traffic responsive control rely on loop detectors or other forms of traffic surveillance to select metering rates. A local control strategy will select metering rates based on traffic conditions present on the ramp and at adjacent mainline locations to remedy isolated congestion or safety-related problems. Local control cannot factor in conditions at adjacent ramps or throughout the freeway mainline. Local control is often used as a back-up strategy when system-wide algorithms are offline or communications are inoperable. System-wide control is responsive to both local and corridor-wide real-time traffic conditions. When calculating a metering rate, system-wide control takes into account traffic conditions upstream and downstream from an individual ramp along a specific freeway segment or along an entire corridor. System-wide control provides more options in optimizing mainline capacity and reducing the amount of overall system delay by using multiple ramps to control traffic at any given bottleneck or congested location. Descriptions of example algorithms are included in Table 2.
Table 2: Description of example algorithms
| Algorithm |
Control Type |
Description |
Used By |
| ALINEA |
Local |
Metering rates are determined based on occupancy data collected from mainline loop detectors located downstream from the meter. The goal is to maximize the mainline throughput by maintaining occupancy values below the target threshold. |
Other Algorithms |
| Corridor Adaptive Ramp Metering Program (CARMA) |
System |
Metering rates determined based on mainline speeds and prevailing local controller conditions which are then optimized over each freeway direction. The concept is based on the assumption that a ramp can allow maximum vehicles when the speed is high and should allow no vehicles when the speed is near optimal. |
Kansas City, Missouri |
| Heuristic Ramp Metering Coordination (HERO) |
System |
This algorithm uses the ALINEA algorithm as the foundation for managing local conditions. When ramp queues meet threshold conditions, the control algorithm is activated and assigns restrictive metering rates to upstream ramps in order to balance downstream conditions. |
Melbourne, Australia |
| Fuzzy Logic |
System |
This algorithm incorporates ramp queues and makes them integral to managing and controlling the freeway system. This algorithm controls multiple ramps, uses more comprehensive mainline and ramp inputs, and uses different heuristics which allows for the most flexibility on determining metering rates for changing local conditions. |
Seattle, Washington
Miami, Florida
|
| Stratified Zone Metering (SZM) |
System |
This algorithm operates on density measurements and requires detection upstream of the ramp merge, at mainline exit ramps, and on the mainline to sustain the overall objective of the total volume exiting a zone exceeding the volume entering. SZM attempts to rebalance the increase in mainline density by making other meter rates in the active zone more restrictive. Ramp queue wait times are managed by a separate algorithm function. |
Minneapolis, Minnesota |
| System-Wide Adaptive Ramp Metering (SWARM) |
System |
Metering rates are calculated based on the current density, the required density, and the number of vehicles that should be removed or added to the freeway zone between each ramp. Additional upstream ramps are called to action when a single ramp has exceeded its capacity to balance the zone density. SWARM provides advantages to mixed ramp controls, so that some ramps can be operated locally, manually, or with a different algorithm and SWARM will adapt to distribute wait times equally among ramps. |
Orange County, California
Portland, Oregon
|