Effectiveness of Safety and Public Service Announcement Messages on Dynamic Message Signs
CHAPTER 5. Results and Analysis
Descriptive Statistics
After incomplete surveys were removed, there were 497 usable surveys from Philadelphia, 500 from Orlando, 584 from Chicago, and 507 from Houston. This chapter includes descriptive statistics in numerical (i.e., means, standard deviations, min, max) and graphical forms (i.e., box plots, histograms, scatter plots) of these surveys. The specific display depends on the response type for the question being analyzed (i.e., continuous, categorical, or ordinal). Table 23 presents a breakdown of the demographics for individual respondents.
Table 23. Demographics by survey city.
Philadelphia
(n=497) |
Orlando
(n=500) |
Chicago
(n=584) |
Houston
(n=507) |
| Gender |
| Female |
260 |
217 |
274 |
244 |
| Male |
202 |
223 |
269 |
233 |
| Age (years) |
| Range |
17-85 |
16-91 |
16-82 |
17-85 |
| Mean (SD) |
30.18 (15.0) |
29.04 (13.01) |
36.83 (15.9) |
32.18 (15.4) |
| Marital Status |
| Single |
274 |
266 |
258 |
216 |
| Significant Other |
59 |
53 |
59 |
30 |
| Married |
106 |
83 |
166 |
196 |
| Divorced |
21 |
26 |
48 |
28 |
| Highest Education |
| Some Schooling |
9 |
37 |
14 |
33 |
| High School Diploma |
160 |
171 |
159 |
187 |
| Associate Degree |
47 |
98 |
86 |
76 |
| Undergrad Degree |
148 |
68 |
151 |
96 |
| Some Grad School |
34 |
23 |
44 |
32 |
| Post Grad Degree |
55 |
16 |
76 |
34 |
| English as Primary Language |
| Yes |
407 |
258 |
489 |
83 |
| No |
49 |
142 |
43 |
385 |
There was roughly an equal number of males and females at each site, as well as a similar distribution in ages across locations. Most of the respondents were primarily English speakers. Table 24 summarizes the self-reported information about the subjects’ driving experiences. These results are highly representative of normal driving populations, where most respondents have not been involved in a collision or received a moving violation within the past 5 years. From the drivers who had been involved in a collision or moving violation, the average was two or less respective instances, observed at each city.
Table 24. Driving experience by survey city.
| |
Philadelphia
(n=497) |
Orlando
(n=500) |
Chicago
(n=584) |
Houston
(n=507) |
| Collision (within 5 years) |
| No |
371 |
361 |
433 |
395 |
| Yes |
90 |
64 |
103 |
74 |
| If Yes, How Many |
| Mean (SD) |
1.22 (0.29) |
1.66 (0.96) |
1.12 (0.36) |
1.19 (0.48) |
| Moving Violation (within 5 years) |
| No |
367 |
353 |
393 |
379 |
| Yes |
92 |
60 |
147 |
96 |
| If Yes, How Many |
| Mean (SD) |
1.64 (1.54) |
1.61 (0.93) |
1.71 (1.35) |
2.06 (1.78) |
Table 25 provides information on household demographics. The majority of participants lived within the greater area of the respective survey’s city. Each city had a similar range and mean in household size. The distribution of household incomes across all cities was also very similar. Drivers who own and rent their living space are each well represented in all cities.
Table 25. Socioeconomic characteristics of the survey respondents.
| |
Philadelphia
(n=497) |
Orlando
(n=500) |
Chicago
(n=584) |
Houston
(n=507) |
| Live within Greater Area |
| Yes |
308 |
248 |
317 |
356 |
| No |
153 |
159 |
218 |
113 |
| People in House |
| Range |
1-20 |
1-20 |
1-20 |
1-26 |
| Mean (SD) |
3.3 (2.18) |
3.2 (1.69) |
3.2 (1.88) |
3.5 (2.17) |
| Children under 6 in Household |
| Count |
39 |
108 |
91 |
101 |
| Range (if yes) |
1-6 |
1-5 |
1-4 |
1-15 |
| Current Living Space |
| Rent |
220 |
211 |
203 |
152 |
| Own |
136 |
100 |
220 |
215 |
| Neither |
101 |
106 |
109 |
106 |
| Household Income |
| < 25k |
109 |
149 |
101 |
82 |
| 25k - 50k |
85 |
125 |
124 |
112 |
| 50k - 75k |
83 |
82 |
117 |
88 |
| 75k - 100k |
73 |
37 |
58 |
57 |
| 100k - 125k |
27 |
15 |
51 |
28 |
| > 125k |
55 |
10 |
50 |
59 |
Interpretations of PSAs
Each city was asked to interpret three potential PSAs that were relevant to their city with some overlapping questions for comparison. Not all messages were used in all four cities; however, for consistency, exactly three interpretation questions were asked in each city (Q4, Q5, and Q6). For Philadelphia, Orlando, and Chicago, the respondents were asked for their interpretation of the PSA: “Ride safely, sober, live free, ride alive.” This information was not solicited for Houston, because there was no similar PSA message on DMS in the city at the time the survey was administered (the questions used in the survey were discussed and approved at an earlier stakeholders meeting). With respect to the PSA, “Ride safely, sober, live free, ride alive,” there was a generally shared interpretation across the three cities sampled that this message meant, “Don’t drink and drive,” as shown in Figure 8 (a) (b) and (c).
Figure 8 (a) (b) (c). Chart. PSA “ride safely, sober, live free, ride alive.”
These same three cities were also surveyed on their interpretation of the PSA: “Eyes on road, hands on wheel.” A comparison of these results is provided in Figure 9 (a) (b) and (c). There was a split in the understanding of this PSA message between “Stay alert” and “Don’t drive distracted,” observed in all three cities.
Figure 9 (a) (b) (c). Chart. PSA “eyes on road, hands on wheel.”
All four cities were surveyed on an individual PSA commonly viewed in their area, which was also comparable across all cities. The overall message for this PSA was safety, with variations in focus highlighting motorcycle and impairment awareness. For Philadelphia and Houston, the term “motorcycle safety” was included; in Houston, Chicago, and Orlando, the term “impairment” was used; and in Orlando and Houston, “ride” was included to allude to motorcycle drivers. Figure 10 (a) (b) (c) and (d) illustrate the comparison of interpretations based on these word choices.
Figure 10 (a) (b) (c) (d). Chart. Comparable PSA messages by city.
Houston was also surveyed on two additional PSA messages: “Don’t barrel through work zones” and “Avoid aggressive driving.” The interpretations of these messages can be viewed in Figure 11 (a) and (b). For the most part, participants agreed on the meanings of these messages.
Figure 11 (a) (b). Chart. Additional PSA messages in Houston.
Each city was also given a list of approximately 15 of the most commonly posted PSA messages for their area, and participants were asked to select all messages that they recognized. Figure 12 (a) (b) (c) and (d) show the top 10 most recognized PSAs for each city. Seatbelt campaigns were most widely recognized across all four areas.
Figure 12 (a) (b) (c) (d). Chart. Top 10 most recognized PSAs by city.
A possible correlation between these top 10 most recognized messages by respondents and the actual count/duration of message displays in each urban area was examined. However, limited data was available from each jurisdiction, and a robust correlation could not be identified.
Data was obtained from the TxDOT for these top 10 messages in Houston for the 3 months leading up to the study and the study month itself. “Drink, drive, go to jail” was displayed 167 times in each of the 3 months prior to the survey. “XX deaths this year on Texas roads” was displayed 165 times in each of the 4 months. “Buckle up, every rider, every ride” was displayed 165 times in the month of collection. “Move over or slow down, it’s the law” was displayed 167 times in one of the three preceding months and “Drive sober or get pulled over” twice in two of the preceding months.
Chicago reported displaying death count messages 24/7, alternated with one PSA message. The alternative messages were: “Cell phone use while driving must be hands free,” “Don’t drink and drive,” “Don’t text and drive,” “Save a life, buckle up,” and “Stay off the phone in work zones.”
Philadelphia did not display any of the top 10 recognized messages in the 4 months of interest. However, this is based on exact wording, and it is unclear whether a similar variation of a message was displayed. Data on the Orlando PSA display schedule for the time of this study was unable to be linked with any significance.
All four cities were asked general questions about their experiences and opinions regarding posting PSAs on DMS. Table 26 provides a summary of responses on frequency, usefulness, and effectiveness of these messages.
Table 26. General opinions of PSAs on DMS.
Philadelphia
(n=497) |
Orlando
(n=500) |
Chicago
(n=584) |
Houston
(n=507) |
| “How often do you see PSAs on dynamic message signs while driving?” |
| Never |
12(2.4%) |
14 (2.8%) |
15 (2.9%) |
8 (1.6%) |
| Rarely |
70 (14.0%) |
53 (10.7%) |
2 (0.4%) |
43 (8.5%) |
| Sometimes |
224 (44.7%) |
108 (21.7%) |
248 (47.1%) |
125 (24.8%) |
| Often |
159 (31.7%) |
120 (24.1%) |
186 (35.4%) |
186 (36.8%) |
| Always |
36 (7.2%) |
202 (40.6%) |
75 (14.3%) |
143 (28.3%) |
| “How useful is it to have PSAs on dynamic message signs for drivers?” |
| Never |
23 (4.6%) |
9 (1.8%) |
12 (2.1%) |
5 (1.0%) |
| Rarely |
93 (18.6%) |
46 (9.3%) |
94 (16.2%) |
63 (12.5%) |
| Sometimes |
117 (23.4%) |
111 (22.3%) |
113 (19.5%) |
104 (20.6%) |
| Often |
173 (34.5%) |
171 (34.4%) |
173 (29.9%) |
155 (30.8%) |
| Always |
95 (19.0%) |
160 (32.2%) |
187 (32.3%) |
177 (35.1%) |
| “Do you think PSAs on DMSs are more effective compared to other media?” |
| Never |
17 (3.4%) |
15 (3.1%) |
7 (1.2%) |
9 (1.8%) |
| Rarely |
69 (13.8%) |
67 (13.7%) |
54 (9.4%) |
49 (9.7%) |
| Sometimes |
167 (33.5%) |
145 (29.6%) |
183 (31.8%) |
179 (35.4%) |
| Often |
187 (37.5%) |
141 (28.8%) |
247 (43%) |
175 (34.7%) |
| Always |
59 (11.8%) |
122 (24.9%) |
84 (14.6%) |
93 (18.4%) |
Most responses in all cities were in the “sometimes” and “often” category for all three of these questions, indicating a somewhat positive opinion on using PSAs on DMS.
These questions are not specific to capturing recognition of the message itself. For example, the first question listed in Table 26 is “How often do you see PSAs on dynamic message signs while driving?” Approximately 84 percent of respondents selected “sometimes,” “often,” or “always” in Philadelphia. Although, only 39 percent reported “often” and “always,” again the question was not targeted toward recognition, but how often the respondents see these messages specifically on DMS while driving. Also, respondents may view similar messages on other media such as billboards or TV, and it may not be as easy for individuals to recall whether the message was from DMS or another media form.
All four cities were also surveyed on their opinions of reinforcement messages on the DMS. These questions ranged from posting consequences (e.g., “Drink, drive, go to jail”) to including crash statistics (e.g., “100 deaths this year on Texas road”) to showing a specific fine (e.g., “Click it or ticket or get $100 fine”). The results for these questions can be viewed in Figure 13 (a) (b) (c) and (d). In all cities, participants agreed that they were neutral about to somewhat comfortable with reading consequences; somewhat agreeing that PSAs with crash statistics are more effective and their driving would be strongly impacted by signs that showed a fine.
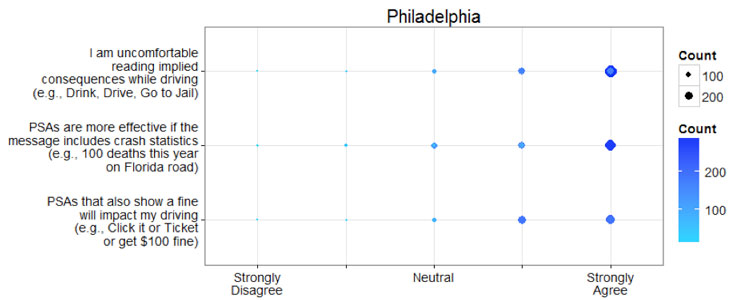
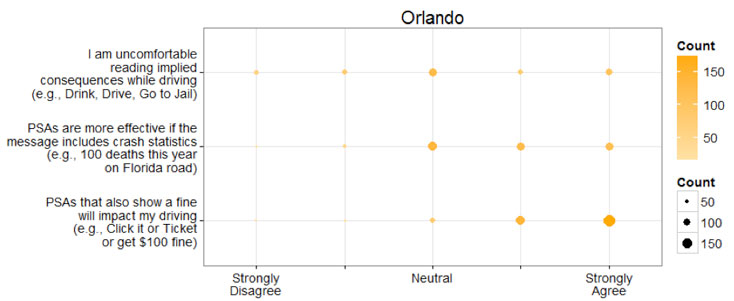
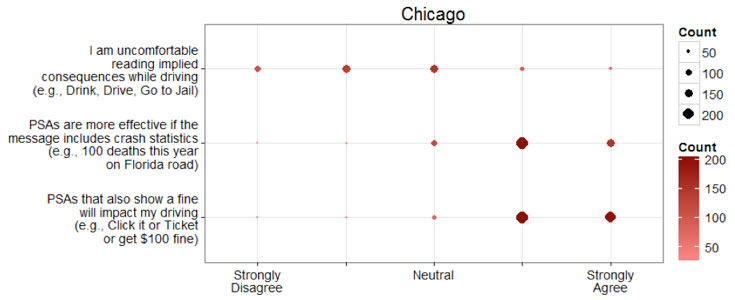
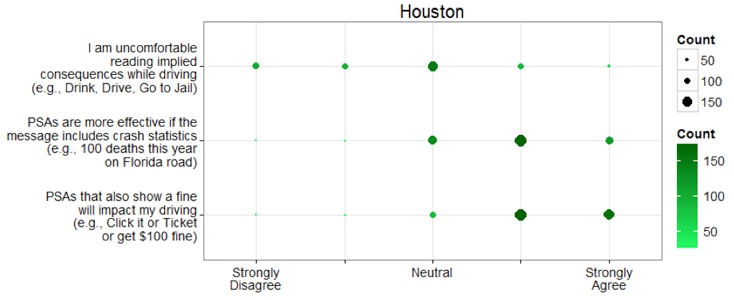
Figure 13 (a) (b) (c) (d). Chart. “How much do you agree or disagree with the following statements…”
Furthermore, each city was asked the same set of questions with regards to the importance of providing information to drivers on six common safety issues—motorcycle awareness, driving impaired, work zone safety, distracted driving, speeding, and seatbelt usage. These results are portrayed in Figure 14 (a) (b) (c) and (d). On average, people thought it was very important to provide information to drivers on all six of these concerns, with less emphasis on staying below the posted speed limit.
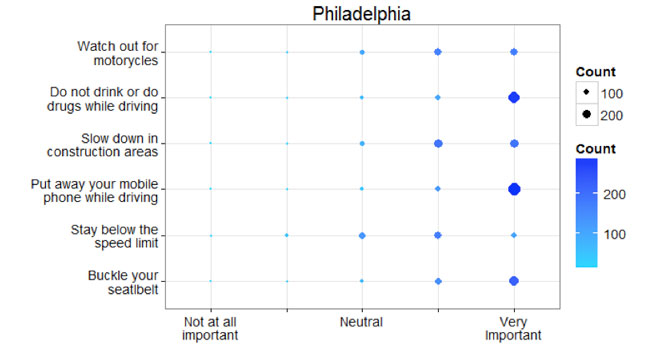
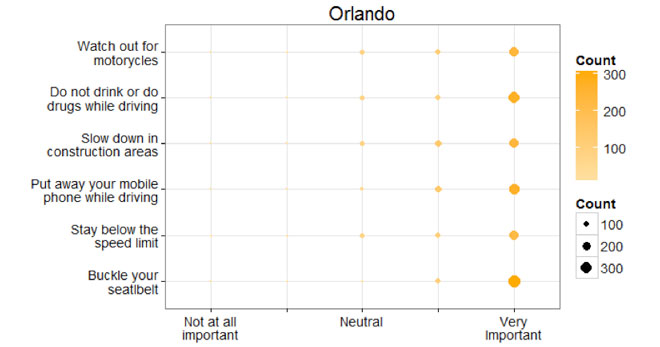
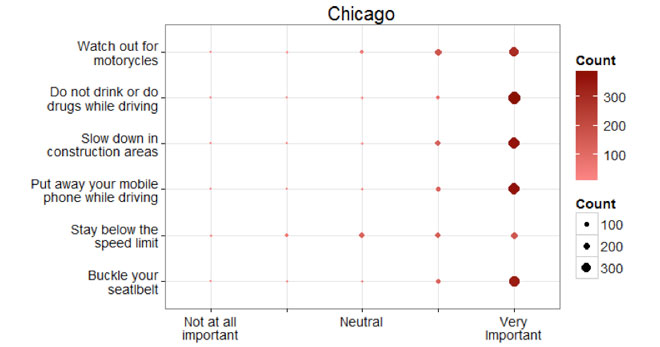
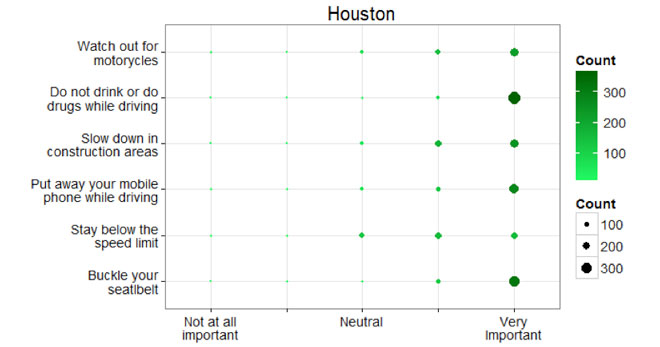
Figure 14 (a) (b) (c) (d). Chart. “How important is it to provide information to drivers on the following…”
Similarly, actual messages displayed in each of these cities that correspond to the six safety issues were assessed for their impact on driver behavior. Survey respondents were asked “if they would change their driving behavior or habits if they saw the following PSA on DMS while driving?” The possible responses ranged from “definitely not” to “definitely yes.” Orlando had the strongest responses toward “definitely yes” on all messages. Chicago responded strongly with “definitely yes” for messages relating to slowing down for emergency vehicles and in construction zones, with a majority of mixed responses between “probably” and “definitely yes” for the other messages. Philadelphia respondents were more neutral, with most responses in the “maybe” and “probably yes” behavior responses. Houston responses were the most scattered; the only two messages with a strong majority correspond to the two messages with more assertive language (“100 deaths this year on Texas road” and “Drunk driving, over the limit, under arrest”). Figure 15 (a), (b), (c), and (d) further depict these responses in behavioral changes linked to specific PSAs.
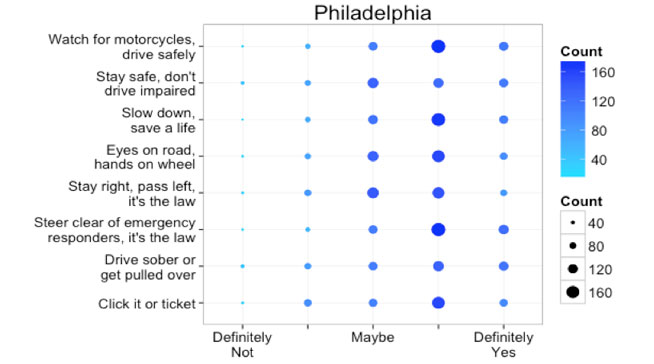
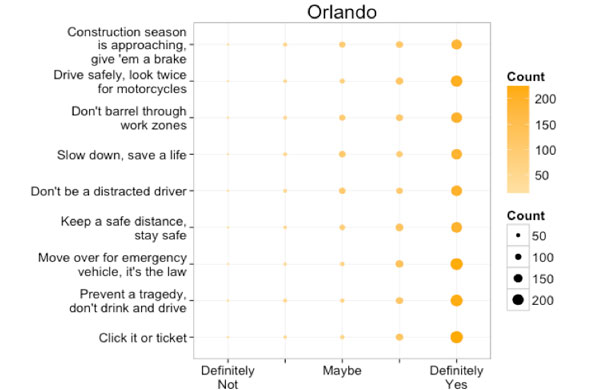
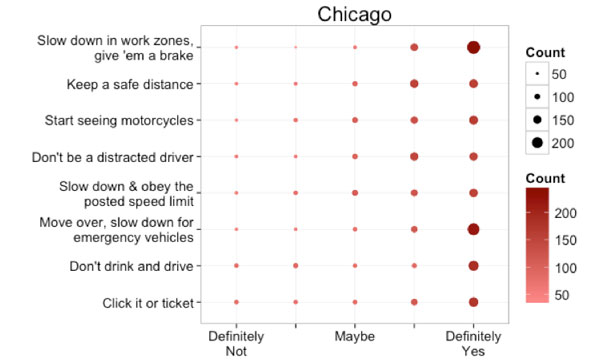
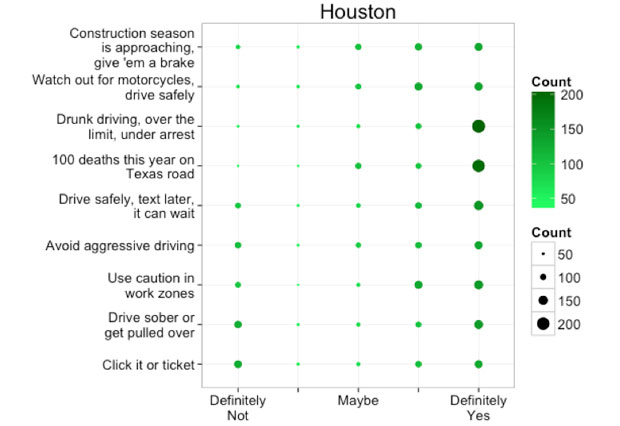
Figure 15 (a) (b) (c) (d). Chart. “Would you change your driving behavior or habits when you see the following PSA on DMS while driving…”
Inferential Statistics
A chi-square test was conducted on the responses for opinions relating to posting consequences, crash statistics, and fines on PSAs to determine how the results differed based on city. All chi-square values were less than 0.05, indicating that PSA opinions significantly differ based on city.
A binary logit model was developed for each city to predict the perceived usefulness of PSAs on DMS given various explanatory variables that include behavioral correlates and socioeconomic characteristics. The outcome was based on recoding the 5-point Likert scale so that those who indicated “Neutral” to “Less than useful” are coded 0 (not useful), and “Always useful” to “somewhat useful” are coded 1 (or useful).
In all four cities, individuals were more likely to agree that PSAs on DMS were useful if they encountered them more frequently. If the user felt that posting PSAs on DMS would be highly effective, then they would also feel that PSAs were more useful. In Philadelphia, males considered PSAs more useful, while in Orlando, females considered PSAs more useful. Only in Chicago was income a factor, where lower income individuals were more likely to regard PSAs to be useful when compared to those with higher incomes. In three cities (Philadelphia, Chicago, and Houston), there was a higher likelihood of reporting that PSAs were useful if the surveyed subjects also considered conveying information on impaired driving to be important. Table 27 provides a more in-depth summary on this model.
Table 27. Binary logit model for predicting perceived usefulness.
Philadelphia
| Odds Ratio |
Confidence Interval |
| estimate |
p-value |
lower |
upper |
| Frequency |
1.56 |
0.002 |
1.18 |
2.01 |
| Effective |
2.84 |
<0.001 |
2.18 |
3.78 |
| Seatbelt |
2.11 |
0.017 |
1.15 |
3.92 |
| DUI |
1.99 |
0.042 |
1.03 |
3.90 |
| Speeding |
- |
ns |
- |
- |
| Lives in Area |
- |
ns |
- |
- |
| Male |
1.48 |
0.098 |
0.93 |
2.36 |
| Younger |
- |
ns |
- |
- |
| Older |
- |
ns |
- |
- |
| High School |
- |
ns |
- |
- |
| Grad School |
- |
ns |
- |
- |
| Lower Income |
- |
ns |
- |
- |
| Crash |
- |
ns |
- |
- |
| Tickets |
- |
ns |
- |
- |
| Null Deviance = 575.64 |
| Residual Deviance = 458.13 |
Orlando
| Odds Ratio |
Confidence Interval |
| estimate |
p-value |
lower |
upper |
| Frequency |
1.68 |
<0.001 |
1.31 |
2.17 |
| Effective |
1.94 |
<0.001 |
1.48 |
2.58 |
| Seatbelt |
- |
ns |
- |
- |
| DUI |
- |
ns |
- |
- |
| Speeding |
2.56 |
<0.001 |
1.48 |
4.41 |
| Lives in Area |
- |
ns |
- |
- |
| Male* |
0.60* |
0.046* |
0.36 |
0.99 |
| Younger |
- |
ns |
- |
- |
| Older |
- |
ns |
- |
- |
| High School |
- |
ns |
- |
- |
| Grad School |
- |
ns |
- |
- |
| Lower Income |
- |
ns |
- |
- |
| Crash |
- |
ns |
- |
- |
| Tickets* |
0.47* |
0.028* |
0.24 |
0.92 |
| Null Deviance = 485.44 |
| Residual Deviance = 369.04 |
* Odds ratio estimate is less than 1.
Chicago
| Odds Ratio |
Confidence Interval |
| estimate |
p-value |
lower |
upper |
| Frequency |
1.46 |
0.007 |
1.11 |
1.94 |
| Effective |
3.50 |
<0.001 |
2.57 |
4.87 |
| Seatbelt |
- |
ns |
- |
- |
| DUI |
4.00 |
<0.001 |
1.93 |
8.52 |
| Speeding |
1.84 |
0.013 |
1.14 |
2.97 |
| Lives in Area* |
0.65* |
0.086* |
0.40 |
1.06 |
| Male |
- |
ns |
- |
- |
| Younger* |
0.67* |
0.111* |
0.41 |
1.10 |
| Older* |
0.48* |
0.074* |
0.22 |
1.08 |
| High School |
- |
ns |
- |
- |
| Grad School |
- |
ns |
- |
- |
| Lower Income |
2.16 |
0.014 |
1.18 |
4.08 |
| Crash* |
0.61* |
0.079* |
0.35 |
1.06 |
| Tickets |
- |
ns |
- |
- |
| Null Deviance = 573.19 |
| Residual Deviance = 439.46 |
* Odds ratio estimate is less than 1.
Houston
| Odds Ratio |
Confidence Interval |
| estimate |
p-value |
lower |
upper |
| Frequency |
1.60 |
<0.001 |
1.24 |
2.08 |
| Effective |
2.11 |
<0.001 |
1.61 |
2.81 |
| Seatbelt |
- |
ns |
- |
- |
| DUI |
2.54 |
0.014 |
1.21 |
5.39 |
| Speeding |
1.73 |
0.028 |
1.06 |
2.84 |
| Lives in Area |
- |
ns |
- |
- |
| Male |
- |
ns |
- |
- |
| Younger* |
0.53* |
0.019* |
0.31 |
0.90 |
| Older |
- |
ns |
- |
- |
| High School* |
0.62* |
0.080* |
0.36 |
1.06 |
| Grad School* |
0.41* |
0.019* |
0.19 |
0.87 |
| Lower Income |
- |
ns |
- |
- |
| Crash |
- |
ns |
- |
- |
| Tickets |
- |
ns |
- |
- |
| Null Deviance = 495.67 |
| Residual Deviance = 414.44 |
* Odds ratio estimate is less than 1.
Notes:
- Frequency = encounter PSAs always or sometimes
- Effective = consider PSAs on DMS more effective/much more effective compared to other media means
- Seatbelt/DUI/Speeding = consider important/very important to provide information on topic to drivers
- Younger = less than 30 years old
- Older = older than 60 years old
- High School = some high school or high school diploma
- Grad School = some graduate school or postgraduate degree
- Lower Income = less than $25,000 per year
- Crash/Tickets = has been in at least one crash/received ticket within past 5 years
A second binary logit model was developed to predict the perceived effectiveness of PSAs on DMS given variables that were identical across all four cities. Rather than four separate models for each city, this model is aggregated across all survey locations. Similar to the first model, survey questions based on the 5-point Likert scale were recoded such that “Neutral” to “Less than effective” are coded as 0 (for not effective), and “Always effective” to “somewhat effective” are coded as 1 (or effective).
Table 28 provides the model summary for the aggregated data across all cities. Individuals were 1.74 times more likely to consider PSAs effective on DMS when they encountered PSAs frequently and were 3.29 times more likely if they also consider PSAs to be useful. These outcomes echo the findings at the individual city level. In addition, individuals who had some graduate schooling or a postgraduate degree were 1.34 times more likely to find these
messages effective.
Based on the aggregation across all cities, the team was also able to examine interaction effects. Specifically, lower income males were less likely to find these DMS effective. Older respondents (older than 60) were more likely to consider PSAs effective, while younger respondents (less than 30) were less likely to consider them effective. As a reference, 10 percent of the dataset included lower-income males, 8 percent were in the older category, 57 percent were younger, and 17 percent were represented by the graduate school variable.
Table 28. Binary logit model for predicting perceived effectiveness when compared to other media.
| Odds Ratio |
Confidence Interval |
| estimate |
p-value |
lower |
upper |
| Frequency |
1.74 |
<0.001 |
1.41 |
2.15 |
| Useful |
3.29 |
<0.001 |
2.64 |
4.10 |
| Low Income Male* |
0.73* |
0.081* |
0.52 |
1.04 |
| Younger* |
0.76* |
0.017* |
0.60 |
0.95 |
| Older |
1.55 |
0.051 |
1.00 |
2.42 |
| Grad School |
1.34 |
0.048 |
1.00 |
1.79 |
| Null Deviance = 2249.5 |
| Residual Deviance = 2039.6 |
| Observations = 1620 |
* Odds ratio estimate is less than 1.
Notes:
- Frequency = encounter PSAs always or sometimes
- Useful = consider PSAs on DMS useful or very useful
- Low Income Male = males with an annual income less than $25,000
- Younger = less than 30 years old
- Older = older than 60 years old
- Grad School = some graduate school or postgraduate degree