Effectiveness of Safety and Public Service Announcement Messages on Dynamic Message Signs
Chapter 3. Survey Design and Execution Plan
To successfully administer the surveys in all four locations and produce reliable and credible results, the project team developed a detailed survey design and execution plan that highlights the process for:
- Identifying key safety and PSA messages for further evaluation.
- Developing a clear, succinct, and customized survey questionnaire for each of the four
urban areas.
- Identifying the target population.
- Calculating the sample size.
- Collecting and analyzing the data.
The remainder of this chapter further describes the survey design and execution plan in the four selected locations, as well as the pilot study.
Survey Design
This section describes the approach to identifying key safety and PSA priority messages in each of the four test locations, the survey format, and the survey content.
Priority Messages
The project team researched and identified the type and content of safety and PSA messages that have been posted on DMS in the study areas (Chicago, Houston, Orlando, and Philadelphia). The team coordinated with the four state transportation agencies to gain information on the agencies’ policies, guidelines, and rules for displaying these safety and PSA messages on DMS. The team compiled:
- A comprehensive list of safety and PSA messages that have been used by each state traffic management center, with an additional column indicating the frequency of use over the
past year.
- A recommended list of messages to use in the survey and the justification for the proposed messages. Based on input from stakeholders, proposed messages were suggested for further evaluation and inclusion in the survey. In addition, message consistency across the four regions was considered to provide a solid framework for comparison on the national scale.
Chicago
Table 1 shows the final list of recommended priority messages for Chicago, based on conversations with the Illinois DOT.
Table 1. Recommended messages for Chicago, IL.
| Priority Messages for Chicago, IL |
| Click It or Ticket |
| Don’t Drink and Drive |
| Move Over, Slow Down for Emergency Vehicles |
| Slow Down and Obey the Posted Speed Limit |
| Don’t Be a Distracted Driver |
| XXX Deaths This Year |
| Seat Belts Save Lives, Buckle Up |
| Don’t Text and Drive |
| Slow Down in Work Zones, Give ’em a Brake |
| Start Seeing Motorcycles |
| Construction Season Is Approaching – Give ‘em a Brake |
Houston
Priority messages for Houston were generated through interviews with TxDOT staff and the local Houston DOT/Transtar office. Table 2 presents the final list of recommended priority messages for Houston.
Table 2. Recommended messages for Houston, TX.
| Priority Messages for Houston, TX |
| Click It or Ticket |
| Drive Safely, at or under the Speed Limit |
| Move Over or Slow Down, It’s the Law |
| Watch for Motorcycles, Drive Safely |
| Drive Safely, Text Later, It Can Wait |
| XXX Deaths This Year on Texas Road |
| Drive Safely, Arrive Alive |
| Use Caution in Work Zones |
| If Water on Road, Turn Around, Don’t Drown |
| Drink, Drive, Go to Jail |
Orlando
Table 3 presents the final list of recommended priority messages for Orlando. The messages were identified based on communications with FDOT staff.
Table 3. Recommended messages for Orlando, FL.
| Priority Messages for Orlando, FL |
| Click It or Ticket |
| Prevent a Tragedy, Don’t Drink and Drive |
| Move Over for Emergency Vehicle, It’s the Law |
| Keep Safe Distance, Stay Safe |
| Drive Safely, Look Twice for Motorcycles |
| Don't Barrel Through Work Zones |
| Slow Down, Save a Life |
| Don’t Be a Distracted Driver |
| Report Impaired Drivers, Dial *347 |
Philadelphia
Based on discussions with PennDOT staff in Philadelphia, a list of priority messages for Philadelphia was identified. Table 4 presents the final list of recommended priority messages
for Philadelphia.
Table 4. Recommended messages for Philadelphia, PA.
| Priority Messages for Philadelphia, PA |
| Click It or Ticket |
| Steer Clear of Emergency Responders, It’s the Law |
| Stay Right, Pass Left, It’s the Law |
| Slow Down, Save a Life |
| Eyes on Road, Hands on Wheel |
| Drive Sober or Get Pulled Over |
| Watch for Motorcycles, Drive Safely |
| Avoid Aggressive Driving |
| Stay Safe, Don’t Drive Impaired |
Survey Format
The surveys included demographic information (e.g., age, gender, income) as well as questions on behavior, acceptance, and comprehension. Paper and online surveys were used for
enhanced outreach:
- The four-page, tri-fold paper-based survey had an imprinted postage-paid address so it could be easily returned by mail. This ensured that the survey could be completed and returned easily and quickly. In addition, the paper-based survey included a link to a web-based survey for those participants wishing to complete the questionnaire online.
- The web-based survey had questions that were identical to the paper-based survey and accessible through any Internet connection. Respondents were given an opportunity to preview, go backwards, and change answers. Once completed and submitted, respondents received a confirmation.
Both surveys allowed respondents to skip questions that they did not feel comfortable answering.
Survey Questionnaire/Content
The survey design was based on the priority safety and PSA messages that were identified based on suggestions from state agencies in each of the four studied urban areas and that were reviewed by the PFS members. The surveys attempted to accurately depict the weaknesses and strengths of the system and any areas of improvement by gathering input from system users that have been exposed to those safety and PSA messages on DMS.
The survey questions were clear, succinct, simple to answer, and able to be completed in 15 minutes or less. Appendix A: Survey Questionnaires provides a complete set of the administered survey questionnaires.
To achieve a 95-percent confidence level, 500 surveys needed to be returned per site. In total, 2,088 responses were received.
Survey Execution
This section describes the approach for administering the survey in all four sites. This includes the recruitment of potential respondents and locations for face-to-face delivery of the surveys.
Subject Recruitment
For the purposes of this study, the project team targeted drivers who may have encountered DMS with safety and PSA messages. Drivers included local residents and out-of-town travelers. The following survey administration techniques were considered:
- Utilization of vehicle registration/licensing information.
- In-person delivery of survey questionnaire.
- Posting the surveys online.
Despite the anticipated effectiveness of Technique 1: Utilization of Vehicle Registration/Licensing Information, it raises privacy and technical concerns for some agencies (such as the Florida, Illinois, and Pennsylvania DOTs). Therefore, a combination of Techniques 2 and 3 was used to obtain the largest sample size in the most cost-effective and timely manner. Appendix B: Sample Size Calculation provides details on the sample size calculation.
Survey Locations for In-Person Interviews
The team selected 18 potential survey locations across the four selected cities (Philadelphia, Houston, Orlando, and Chicago) for distribution of the surveys. Appendix C: Potential Survey Locations by City provides a list of these potential locations.
Prior to selecting the potential survey locations, the team conducted research to locate all DMS locations for each city. In most cases, these DMS locations are available online via local or state DOT websites. In cases where DMS locations were not available online, the project team reached out to the state DOT for a list of these locations. The lists were then used to map all of the DMS locations across the four cities.
In most cases, DMS are located along freeway and arterial routes in all four cities. Using the DMS map that was created, the team began to look for suitable locations to conduct the survey. Survey locations were selected based on type of facility. Emphasis was placed on finding facilities that would contain a high rate of commuter traffic that would have potentially passed a DMS sign en route to the location. For this reason, facilities such as park-n-ride lots, transit stations, rest stops, gas stations, and shopping centers were considered ideal locations due to their expected rate of commuter traffic and high turnover, which is thought to provide a larger audience for survey distribution. Facilities were then narrowed down based on their proximity to a DMS. Only those facilities that had at least one DMS within a 2-mile radius of the site were considered for a potential survey location.
Once suitable facilities were found, the team then catalogued the facilities based on the number of parking spaces, where applicable, and the average daily traffic (ADT) of the freeway/arterial closest to the facility in an effort to illustrate the potential audience capture for the survey at each location.
Pilot Study
The project team conducted a live, face-to-face pilot in Philadelphia and developed web-based surveys for Chicago, Houston, and Orlando to test the survey instrument in advance of the final survey implementation. The purpose of the pilot testing was to validate the survey and ensure that the sampled population would understand the wording, order of questions, and template. The pilot study included administering the survey to a small sample, coding the data, and performing descriptive analyses of the data. Some preliminary statistics were needed to examine the variability across several of the key dependent variables, as the initial goal of the pilot survey was to assess statistical proportions and variations since they can vary greatly depending on the specific behavior (or driver/travel characteristic) being considered (e.g., proportion that will change seat belt usage, change route, or slow down).
Live In-Person Survey
The live pilot survey was conducted in the Philadelphia area on Thursday, March 7, 2013, from 2:00 pm to 4:00 pm at the I-95 Pennsylvania Welcome Center.
The I-95 Pennsylvania Welcome Center was selected due to its known proximity to a DMS location, with the closest DMS approximately 0.5 mile south of the Welcome Center on I-95 Northbound, as shown in Figure 1. The Welcome Center is a limited-access facility, with the only access to the site from I-95 Northbound where the DMS was located. This guaranteed that all traffic arriving at the Welcome Center had passed the DMS immediately before arriving. The team selected a 2-hour afternoon slot in an effort to capture travelers prior to the evening rush hour, when traffic flow may impede access to the Welcome Center and thereby potentially decrease the survey audience.
The project team coordinated with the Welcome Center staff in this city to set up a table inside the Welcome Center for the survey. This table was staffed near the entrance to the building, where travelers were approached to fill out the survey as they entered. Twenty-five surveys were completed during the pilot survey time period.
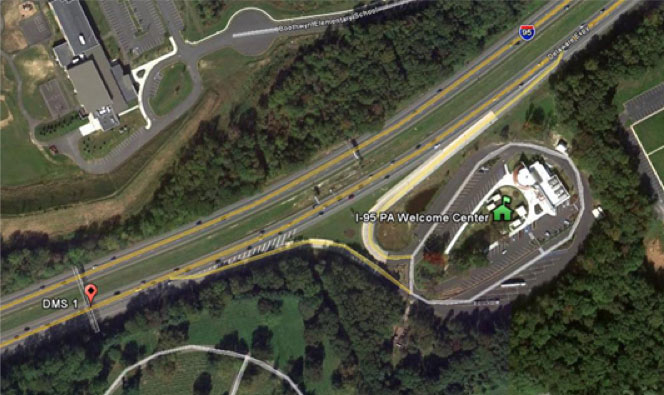
Figure 1. Photo. Pilot survey location.
Survey Results
The survey was given to 25 participants, with an age range from 23 to 84 years old, and a mean age of 47 years old (S.D. = 18.45 years). Thirty-two percent of the participants shared a household with one or more persons. Only 2 out of the 25 participants have children under the age of 6. Forty-four percent of the participants own their own a home. Twenty-four percent of the participants have high school as their highest education; 28 percent of the participants have graduate or post-graduate degrees (Table 5). The median household income is between $25,000 and $50,000 per year (Table 6).
Table 5. Educational level of study participants.
| Highest Level of Education |
% |
| Some Schooling |
8 |
| High School |
24 |
| Associate Degree |
8 |
| Undergraduate |
8 |
| Graduate |
12 |
| Postgraduate |
16 |
Table 6. Household income in $/year of study participants.
| Household Income |
% |
| Less than $25,000 |
12 |
| $25,001 to $50,000 |
32 |
| $50,001 to $75,000 |
12 |
| $75,001 to $100,000 |
8 |
| $100,001 to $125,000 |
8 |
| Greater than $125,000 |
3 |
The survey showed that some messages on the highway are more recognized than others. Sixty percent or more of the participants recognized the followings PSAs: “Buckle up, seat belts save lives,” “Click it or ticket,” “Live free, ride alive,” and “Steer clear of emergency responders, it’s the law.” Other messages did not get as much attention and were recognized within a range of 20 to 40 percent. Further answers to questions indicated that, in general, most survey participants have encountered DMS on the highway in the past (Figure 2). Only 4 out of 25 participants stated that they have rarely or never seen one.
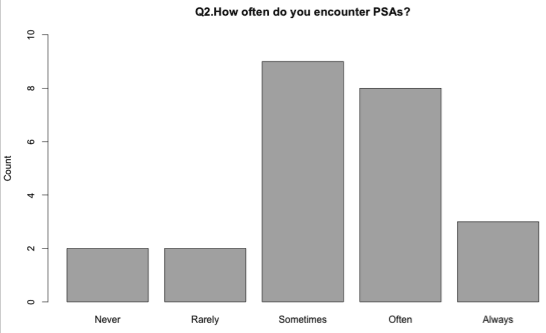
Figure 2. Chart. Recognition of PSA messages.
Forty percent of the participants strongly agree that there is a high level of police enforcement in all categories including seat belt use, speeding in a work zone/construction area, speeding over the posted speed limit, DUI, texting or using a mobile device while driving, tailgating (or following too close to another vehicle), and using the left lane for regular driving (not passing). No participant disagrees or strongly disagrees with that statement (Table 7).
Table 7. Level of enforcement.
| Activity |
Strongly Agree |
Agree |
Neutral |
Disagree |
Strongly Disagree |
| Seat belt use |
16 |
6 |
0 |
0 |
0 |
| Speeding in a work zone/construction area |
10 |
11 |
0 |
0 |
0 |
| Speeding over the posted speed limit |
12 |
10 |
0 |
0 |
0 |
| DUI |
17 |
5 |
0 |
0 |
0 |
| Texting or using a mobile device while driving |
13 |
9 |
0 |
0 |
0 |
| Tailgating (or following too close to another vehicle) |
18 |
4 |
0 |
0 |
0 |
| Using the left lane for regular driving (not passing) |
16 |
6 |
0 |
0 |
0 |
| Other general reckless behaviors not already described in A to G |
16 |
5 |
0 |
0 |
0 |
Forty percent of the participants always respond to the dynamic messages they see. The most recognized DUI warning message is “Drive sober or get pulled over,” with 12 out of 25 participants always responding to this message (Table 8).
Table 8. Would you change your driving behavior when you see the listed PSAs?
| Activity |
Never |
Rarely |
Sometimes |
Often |
Always |
Buckle your seatbelt if it was not buckled
…for “Click it or ticket” |
1 |
1 |
8 |
2 |
10 |
Remember to stay at or below the speed limit
…for “Slow down, save a life” |
1 |
3 |
6 |
5 |
6 |
Put away your mobile phone while driving
…for “Don’t drive distracted” |
1 |
2 |
8 |
3 |
7 |
Slow down
…for “Steer clear of emergency responders, it’s the law” |
1 |
2 |
4 |
5 |
10 |
Not drink or do drugs
…for “Drive sober or get pulled over” |
0 |
2 |
6 |
2 |
12 |
Be more aware of motorcycles
…for “Watch for motorcycles, drive safely” |
0 |
1 |
7 |
5 |
9 |
Only 8 percent of the participants strongly disagree to change their driving patterns or habits based on the listed PSA messages. On the other hand, the majority of the participants responded that they would “agree” or “strongly agree” to change their driving behavior. Most participants agreed with the message “Click it or ticket” (48 percent) and would change their driving patterns based on that message (Table 9).
Table 9. Whether to change driving patterns or habits based on the following PSAs.
| Message |
Strongly Agree |
Agree |
Neutral |
Disagree |
Strongly Disagree |
| Click it or ticket |
12 |
5 |
1 |
0 |
2 |
| Steer clear of emergency responders, it’s the law |
10 |
7 |
1 |
0 |
2 |
| Stay right, pass left, it’s the law |
9 |
8 |
1 |
0 |
2 |
| Slow down, save a life |
9 |
7 |
1 |
0 |
2 |
| Eyes on road, hands on wheel |
8 |
10 |
1 |
0 |
2 |
| Drive sober or get pulled over |
9 |
8 |
1 |
0 |
2 |
| Watch for motorcycles, drive safely |
7 |
11 |
1 |
0 |
1 |
| Stay safe, don’t drive impaired |
9 |
8 |
1 |
0 |
2 |
Seventy-six percent of the participants “strongly agree” or “agree” that PSAs that show a fine will impact their driving behavior. At the same time, 48 percent of the participants “agree” or “strongly agree” that they are uncomfortable reading threatening messages while driving.
Two participants out of 25 have been involved in a collision that was reported to the police in
the past 5 years, and four have received one ticket for a moving violation (Figure 3). This proportion helped in verifying that the pilot study captured a realistic and representative sample of the population.
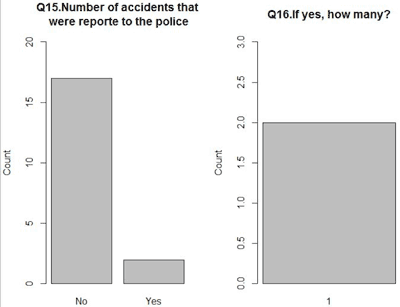
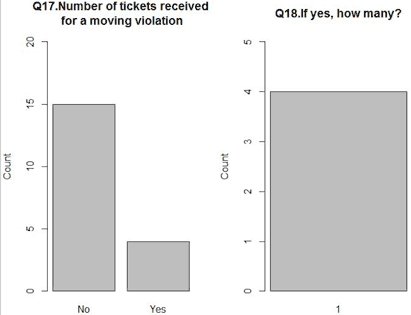
Figure 3. Chart. Number of collisions and number of ticket instances in the past 5 years.
Lessons Learned from the Pilot Survey
The pilot study resulted in several key lessons learned in relation to the survey administration and execution plan:
- The pilot survey was conducted without incentive, and the response rate was 95 percent for all persons approached. However, several comments were made about the survey length—even at a rest stop, many people were not willing to spend 10 minutes to complete the full survey and left some pages or questions blank. An incentive such as printed coupons was worth providing to ensure high participation in the final survey.
- A highway rest stop was found to capture an audience primarily of travelers, not locals. Efforts were made to select multiple locations for the final survey to spread contact over all traveler populations.
- Coordinating with local officials (such as local DOTs, operators of facilities, etc.) prior to conducting surveys is crucial to ensure that all jurisdictions are aware of the team’s operations for a successful survey experience. This also helps in marketing the survey—during the pilot survey, the rest stop personnel were helpful in marketing the survey to all groups that came into the parking lot, before they entered the building.
There was a segment of the pilot survey population that had never seen a DMS, had never seen some of the PSA messages, or did not understand the meaning of several of the messages, and asked the survey administrator for explanations. It is helpful to have additional literature or a web link available to provide more information.