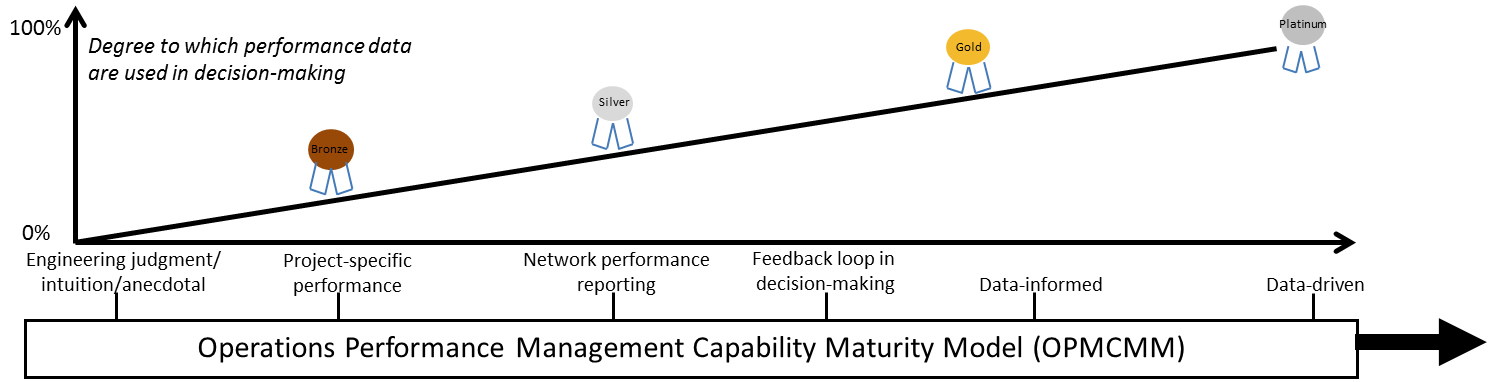
| All "ribbon levels" typically use travel time-based or delay performance measures, including total delay, delay per mile, travel time index, planning time index, etc. Measures are computed at the spatial and temporal scales of interest. |
| Perf. Measures (Content): |
→ Limited, project-specific "after" study; snapshot of outcome measures (averages) |
→ Only required (“siloed”) reporting |
→ Family of output and outcome measures in some areas of organization |
Full/seamless family of output/outcome measures across organization; real-time link (and decision-making) between project-level and system reporting; averages and reliability |
| Perf. Mgmt (Culture): |
→ Minimal perf mgmt interest; performed only as required |
→ Isolated champions of perf mgmt; nothing coordinated across any agency "silos" |
→ Evidence of entire portions of agency implementing and making decisions with perf measures; evidence of "data-informed" process to select projects |
Perf mgmt is ubiquitous in agency culture; entire agency speaks "perf mgmt language" – it feeds mgmt decision-making; "data-driven" decisions using real-time information |
| All "ribbon levels" typically use speed, volume and roadway inventory information at spatial and temporal scales of interest. As the industry matures to the "platinum level," real-time performance management and decision-making are possible. |
| Data: |
→ "Siloed" datasets; no connections |
→ Dataset connections possible – requires programming/processing |
→ Evidence of some coordination of datasets across traditional agency "silos" |
Connected with other agency datasets (volume, crashes, pavement, etc.); application programming interface (API) to visualize/query data for decision-making |
| Modes: |
→ Mode areas are "siloed" in agency; limited communication |
→ Some ability to capture/estimate mode shifts within "silo" of interest |
→ Ability to capture mode shifts across entire agency |
Ability to capture mode shifts over time and across the agency, including intermodal considerations (freight and person) |
| Facility and Trip Coverage: |
→ Limited temporal/ spatial coverage in "silos" |
→ Selected modes/facilities and temporal coverage |
→ All modes, all facilities, all days, all times covered |
In addition to gold level, ability to capture diversion from traveler info or control strategies |
| Traveler Preferences/ Tradeoffs: |
→ Limited ability to capture trip preferences or revealed behavior |
→ Some ability in selected agency "silos" to capture some trip preferences |
→ Technological methods identified/used to capture trip preferences or revealed behavior |
Agency ability to gauge or capture traveler preferences and revealed behavior (i.e., how you traveled and How/where you really wanted to travel) |