Operations Benefit/Cost Analysis TOPS-BC User's Manual – Providing Guidance to Practitioners in the Analysis of Benefits and Costs of Management and Operations Projects
Chapter 4. Map B/C Methodologies to Your Organization's Needs
Overview
Dozens of individual analysis tools and methodologies designed for conducting B/C analysis of one or more TSM&O strategies have been developed to date. Chapter 4 of the Desk Reference document provides an overview of many of these tools and methods. These include tools developed by regional, state, and Federal agencies, as well as proprietary tools developed by many private-sector enterprises. These tools and methods range from simple methods intended for one-time analysis to more complex tools that are continually maintained and updated that form a continuing standardized framework for conducting B/C analysis for various agencies. Additionally, several emerging tools/methods are currently undergoing development as part of parallel efforts by U.S. DOT, American Association of State Highway and Transportation Officials (AASHTO), individual states and regions, and research organizations. Chapter 4 of the Desk Reference document provides a synthesis of many of the available tools and their specific capabilities and limitations.
No single tool or method is appropriate to address the requirements of all of the wide ranging needs for conducting B/C analysis, and it is critical that practitioners select the right tool for the job to produce meaningful analysis results within the resources available for the assessment. With the large and growing number of tools and methods available, however, it has become increasingly difficult for practitioners to know which tool to apply.
TOPS-BC includes the capability to research different tools and methods in order to quickly winnow out those methods that are not applicable and allow you to better focus on those tools that are most relevant to the needs of your analysis. This capability also is intended to provide practitioners with an enhanced understanding of how different criteria affect the needs of their analysis, and make them more aware of the many tradeoffs involved in selecting an analysis approach (e.g., greater level of analysis detail and more accuracy often requires more resources to complete the analysis). The process used by TOPS-BC to provide this capability is described in the section below.
Using Capability 2 to Map B/C Methodologies to Your Organization’s Needs
TOPS-BC’s capability of researching available analysis tools is designed around having you enter information related to several key criteria reflecting your analysis needs. The tool will match those criteria to the known capabilities of a number of publicly available tools and methods, and present you with a list of those appropriate methods for conducting the analysis. Where available, you will then be presented with links to more information regarding the method(s) in order to conduct additional research on the specifics of the suggested tool(s).
Figure 4-1 shows a sample screen view of the capability within TOPS-BC, located on the “Method Selection” worksheet. Upon opening this worksheet, an automated macro populates a table of selection criteria related to B/C criteria. These criteria include:
- Geographic scope of the analysis;
- Desired level of confidence in the results;
- TSM&O strategies to be analyzed;
- Key Measures of Effectiveness (MOEs);
- Travel modes to include;
- Level of resources to support the analysis; and
- Data/tools available to support the analysis.
As shown in Figure 4-1, TOPS-BC contains a list of some of the most widely distributed and applied tools used for conducting B/C analysis of TSM&O strategies. This listing summarizes those major tools developed by Federal, state, or regional transportation agencies (or affiliated research organizations) that are available within the public realm. This listing does not include proprietary offerings of private-sector vendors. Specific descriptions of the various tools are provided in Chapter 4 of the Desk Reference. The listing also includes general analysis approaches (not specific tools) such as travel demand modeling and simulation modeling methods. Methods for applying these analysis tools for supporting B/C analysis are provided in Chapter 5 of the Desk Reference.
To operate this capability, review the various input criteria and make selections that define your specific analysis needs on the Method Selection worksheet. For example, if the analyst wants to analyze performance on a corridor, select the “Corridor” option under the “What is the geographic scope of the analysis?” question. For each question, either “Select 1” by choosing from the defined radio buttons, or “Choose Multiple” by checking however many multiple selection boxes that are relevant. You are not required to enter information for each criteria question, and may leave any question answered as “No preference.”
Figure 4-1. Partial Screen View of the Method Selection Worksheet
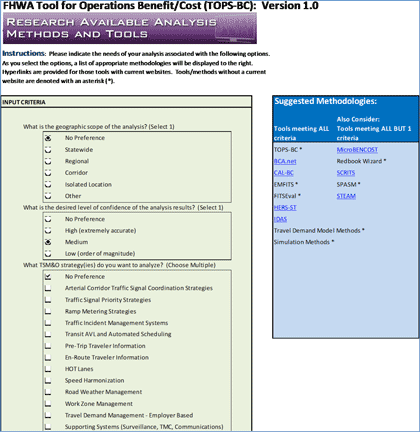
Source: Federal Highway Administration.
As you enter information for the criteria you feel is relevant, a macro is activated that will dynamically identify those tools and methods that meet all the criteria indicated, as well as those that meet all but one of the user defined criteria settings. Tools failing to meet two or more of the user defined criteria will be eliminated from further consideration. The results will be displayed in the Suggested Methodologies box located to the right of the criteria input selection area as shown in Figure 4-2. Tools meeting all user defined criteria are listed separately from tools meeting all but one criteria. Note: the order in which the tools are listed in either the “Tools meeting ALL criteria” or the “Also Consider: Tools meeting ALL BUT 1 criteria” listing is not intended to represent any prioritization of the tools listed under either category.
Figure 4-2. Partial Screen View of Suggested Methodologies Output
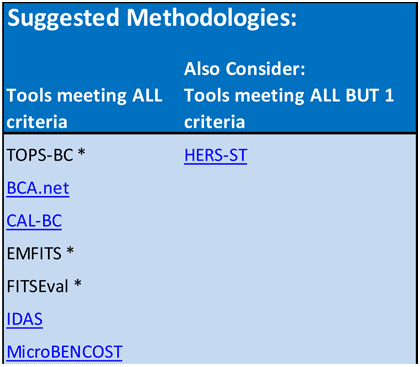
Source: Federal Highway Administration.
You may review this list and return to the input criteria selection to make modifications if necessary. By making changes to the input criteria and reviewing the automatically refreshed results, you may gain a better understanding of the contribution key criteria have in selecting a tool.
Once you have developed a list of tools to consider, the capabilities of the tools may be further investigated by reviewing the information contained in Chapter 4 of the Desk Reference document. Additionally, many of the tools listed under the Suggested Methodologies contain hyperlinks that will direct you to external websites or information sources related to the particular tool.