Active Transportation and Demand Management
ATDM Analysis Brief #3: Example Application (HOV to HOT) of ATDM Capacity and Operations Analysis
Contact Information: Operations Feedback at OperationsFeedback@dot.gov.
Download the Printable Version (PDF, 125KB)
PDF files can be viewed with the Acrobat® Reader®.
Overview
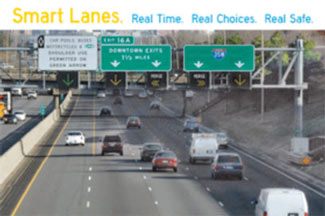
Source: Minnesota Department of Transportation
The Federal Highway Administration (FHWA) Office of Operations sponsored a research project to develop new and updated methodologies, data sets, and content for the Highway Capacity Manual (HCM) that will better reflect the demand and traffic flow behavior that results from the application of Active Transportation and Demand Management (ATDM) concepts and strategies. This project was completed in June 2013.
This is the third in a series of informational briefs on ATDM analysis:
- ATDM Analysis Brief #1 introduced this project.
- ATDM Analysis #2 described the technical analysis method.
- ATDM Analysis Brief #3 (the subject of this brief) provides an example application of the analysis method for converting a high occupancy vehicle (HOV) lane to a high occupancy toll (HOT) lane with dynamic congestion pricing.
- ATDM Analysis Brief #4 illustrates the application of the method to travel demand management (TDM) for incident management.
These analysis briefs as well other ATDM program briefs are available on the FHWA Office of Operations publications page.
Applying the HCM to ATDM Analysis
The ATDM Analysis framework uses modest extensions of conventional Highway Capacity Manual methods combined with SHRP 2-L08 reliability analysis methods to develop estimates of the effects of ATDM investments on facility demand, capacity, travel time, and travel time reliability. These conditions will fluctuate throughout the year and ATDM strategies will generally have their greatest benefits under non-typical conditions. The analysis is performed twice on 30 possible demand, weather, incident, and work zone scenarios for the facility. (The reason for selecting 30 scenarios is that it keeps the amount of effort to develop input data manageable while capturing the major sources of variability in performance.) In this way, the performance of the facility over time is replicated by accounting for the factors that cause travel times to vary from day-to-day. This variability is captured in performance measures related to reliability. The first round of analysis evaluates "before ATDM" conditions. The second round evaluates "after ATDM" conditions. ATDM Analysis Brief #2 provides more details on the methodology.
A pair of spreadsheet based computational engines, implementing Visual Basic routines, have been developed to research and demonstrate the analysis method. The core engine is an extended version of the HCM 2010 FREEVAL software (FREEVAL-ATDM) for evaluating peak period freeway facility operations. A second engine, the ATDM Analyzer, generates the scenarios and the ATDM investments to be tested in FREEVAL-ATDM.
Exhibit 1: Flow Chart of ATDM Analysis Process
Source: Cambridge Systematics, Inc.
Example Application – Conversion of HOV Lane to HOT Lane
The selected study freeway is 7.6 miles long with three basic through lanes. It currently experiences relatively little recurrent congestion, but it is operating very close to the margin. Therefore, when work zones, weather, and/or incidents are present, significant congestion can occur. The left most lane is currently dedicated to HOV 2+ during weekday PM peak periods. The HOV lane is currently slightly underutilized, carrying at most 1,350 vehicles per hour.
The agency wishes to determine the value of investing in a strategy that would convert the HOV lane to HOT operation with dynamic congestion pricing. This would allow spare capacity in the HOV lane during weekday PM peak periods when weather, work zone, and incident events occur, as well as when demand is unusually high such as during special events. The analysis presented below allows the agency to evaluate the productivity, speed, delay, and reliability effects of changes to the operations of the managed lane.
The steps to conduct the analysis are presented below. (Note: for more detailed discussion of each of the steps, please see ATDM Analysis Brief #2).
Exhibit 2:
Source: Cambridge Systematics, Inc.
1. Preparation
Data is assembled for the selected study facility and time period for a traditional HCM freeway facility analysis. (This HCM data becomes the "seed file" for the reliability analysis and generation of scenarios.) Data is then assembled on the day-to-day variability of demand, the historical frequencies of adverse weather, the frequencies of incidents and crashes, and the frequencies of work zones by type. These are used to reflect how the facility currently performs under varying conditions present throughout a year.
2. Generate Scenarios for "Before" Condition
As noted in the description of the methodology in ATDM Analysis Brief #2, the method allows for the following ranges of conditions: 7 possible levels of demand; 16 weather subscenarios; 13 incident subscenarios; and 7 work zone subscenarios. These conditions can vary independently resulting in 10,192 possible combinations (or scenarios) for analysis. The probability of any given scenario is estimated by multiplying together the probabilities of the individual subscenarios and demand levels. From these 10,192 scenarios, 30 scenarios are selected for detailed analysis of the effectiveness of the proposed ATDM strategies. The ATDM Analyzer generates the scenarios and creates the input files required by FREEVAL-ATDM to evaluate the unique demand, capacity, and free-flow speed characteristics of each scenario.
3. Apply Operations Tool to Scenarios for "Before" Condition
A conventional HCM analysis (with SHRP 2-L08 extensions to predict capacities and speeds for adverse weather, incident, and work zone conditions) is applied to the 30 scenarios. This analysis is fully automated within the FREEVAL-ATDM software. The methodology uses capacity and speed adjustment factors for weather, work zones, and incidents from the HCM in order to model these disruptions.
4. Compute MOEs for "Before" Condition
FREEVAL-ATDM generates the MOEs for each scenario as well as combined summary results for the 30 scenarios. (See exhibit following Step 8.)
5. Design ATDM Strategy
Examination of the "before" results determined that congestion regularly occurs at medium to high demand levels (with or without incidents) and suggests that there might be spare capacity in the HOV that could be used during periods of high congestion or incidents. The maximum HOV demand is 1,350 vph compared to a target capacity of 1,600 vph for a HOT lane. Therefore conversion of the HOV lane to a HOT lane with dynamic congestion responsive tolling seems an appropriate ATDM investment.
The slight difference between the current HOV lane and the target 1,600 vph operating volume for a HOT lane has agency management concerned that there may be only marginal benefits of the HOT lane conversion, hence the motivation for conducting this ATDM analysis.
6. Convert ATDM Strategy into Operations Tool Inputs for "After" Condition
With dynamic congestion pricing, the assumption is that the toll for the HOT lane will be dynamically set as low or as high as necessary to fill the HOT lane to its target operating capacity of 1,600 vph. Allowing for some latency in the tolling/demand cycle, it will be assumed that a target maximum volume of 1,500 vph will be achieved. Thus, volumes in the HOT lane will be limited in the HCM analysis to 1,500 vph, where demand on the facility is sufficient to reach those levels.
7. Apply Operations Tool for "After" Condition
As in Step 3, a conventional HCM analysis (with SHRP 2-L08 extensions to predict capacities and speeds for adverse weather, incident, and work zone conditions) is applied to the 30 scenarios. This analysis is fully automated within the FREEVAL-ATDM software, using capacity and speed adjustment factors from the HCM. In this example, the HOV lane to HOT lane conversion is present for all 30 scenarios. However, the methodology allows the user to choose the scenarios to which individual ATDM strategies are applied.
8. Compute MOEs for "After" Condition
FREEVAL-ATDM generates the MOEs for each scenario as well as combined summary results for the 30 scenarios; see exhibit below. The conversion of the HOV lane to a HOT lane increases the lane’s capacity, and that leads to improved performance. Note that in the "before" case not all of the demand is "served" by the facility – this is due to queuing that exists at the end of the analysis period. After HOT lane implementation, all potential demand is served.
TTI = Travel time index, ratio of actual travel time to free-flow travel time.
Conclusion
Converting the HOV lane to HOT lane operation with dynamic congestion pricing is estimated to reduce vehicle-hours of delay by 22 percent (across all lanes), increase average speeds on the facility by 7 percent, and improve reliability of the facility (as measured using the planning time index) by 17 percent. The productivity of the facility is improved so that now it is able to process all of the PM peak period VMT demand (VMT served now equals VMT demanded with the HOT lane).
There is still significant congestion on the facility (as evidenced by the high planning time index of 3.36), which suggests that additional ATDM investments should be considered. To further improve facility operations, additional ATDM strategies applied to this hypothetical scenario are examined in ATDM Analysis Brief #4.
ATDM Project Informational Briefs
This informational brief is one of the ATDM briefs in the Analysis category of the FHWA ATDM Brief Series. ATDM briefs are or will be available in the categories of:
- ATDM Program: Yellow
- ATDM Planning: Purple
- ATDM Analysis: Orange
- ATDM Design: Green
- ATDM Operations: Red
In addition to this overview brief of the ATDM/HCM Analysis method, FHWA is releasing additional project briefs to provide high-level descriptions of the various components of the ATDM/HCM methodology and its application.
FHWA ATDM Program
The United States Department of Transportation (U.S. DOT) is advancing the development of guidance, planning, case studies, and research in the application and design of active transportation and demand management approaches. In addition, the ATDM program will provide lessons learned, standards, and best practices on key underlying ATDM planning, evaluation, analysis techniques and design elements that serve as a foundation for ATDM implementation.
For more information on this project or the FHWA ATDM program efforts, please contact:
FHWA ATDM web site: https://ops.fhwa.dot.gov/atdm/index.htm

FHWA-HOP-13-036
June 2013