Active Transportation and Demand Management
ATDM Analysis Brief #2: Methodology for Capacity and Operations Analysis of ATDM
Contact Information: Operations Feedback at OperationsFeedback@dot.gov.
Download the Printable Version (PDF, 173KB)
PDF files can be viewed with the Acrobat® Reader®.
Project Purpose
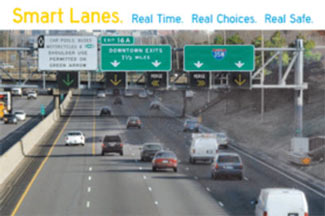
Source: Minnesota Department of Transportation
The Federal Highway Administration (FHWA) Office of Operations has sponsored a research project to develop new and/or updated methodologies, data sets, and content for the Highway Capacity Manual (HCM) that will better reflect the demand and traffic flow behavior that result from the application of Active Transportation and Demand Management (ATDM) concepts and strategies.
Although the new methodology is currently limited in its ability to model dynamic operations, the method allows for the analysis of operational strategies under varying demand and capacity conditions, which serves as an important foundation for analyzing ATDM as well as other operational strategies. FHWA will continue to support research to further refine this methodology.
What is ATDM?
ATDM is the dynamic management, control, and influence of travel demand, traffic demand, and traffic flow on transportation facilities. Through the use of available tools and assets, traffic flow is managed and traveler behavior is influenced in real time to achieve operational objectives, such as preventing or delaying breakdown conditions, improving safety, reducing emissions, or maximizing system efficiency.
Under an ATDM approach, the transportation system is continuously monitored. Using real-time performance data and predictive methods, dynamic actions are evaluated and deployed in real time to achieve or maintain system performance.
Table. Active management of transportation and demand can include multiple approaches spanning demand management, traffic management, parking management, and efficient utilization of other transportation modes and assets. Table displays some example approaches.
| Active Demand Management | Active Traffic Management | Active Parking Management |
|---|---|---|
| Dynamic Ridesharing | Dynamic Lane Use Control | Dynamically Priced Parking |
| On-Demand Transit | Dynamic Speed Limits | Dynamic Parking Reservation |
| Dynamic Pricing | Queue Warning | Dynamic Way-Finding |
| Predictive Traveler Information | Adaptive Ramp Metering | Dynamic Parking Capacity |
Source: Cambridge Systematics, Inc.
Why is there a need for an ATDM Chapter in the HCM?
The HCM provides a comprehensive set of methodologies for predicting the capacity and performance of a given highway facility design. However, except for signal timing, these methodologies are not sensitive to advanced traffic operations and demand management techniques. Moreover, real world daily variations in weather, incident conditions, and travel demand are not typically considered in HCM computations. As a result, transportation engineers and planners cannot use resource-efficient HCM methods to assess the benefits of advanced management techniques that reduce the adverse impacts of these factors on highway capacity and performance. The 2010 edition of the HCM contains Chapter 35 dedicated to Active Traffic Management (ATM) strategies. However, this chapter is mostly introductory in nature, defining ATM, describing typical ATM strategies, and citing some research on ATM strategies. This FHWA project is intended to develop procedures for predicting how ATDM strategies can affect facility demand, and improve travel time reliability and facility performance. The research will provide content to support a new permanent chapter on ATDM integrated into subsequent editions of the HCM.
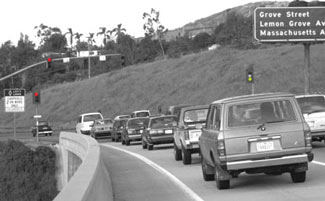
Minnesota DOT Dynamically Priced High Occupancy Toll (HOT) Lanes –
Source: U.S. DOT
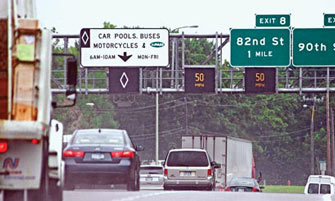
Source: Minnesota Department of Transportation
The ATDM analysis methodology developed in this research should be viewed as an initial, foundational set of procedures primarily focused on traffic management applications. The methodology provides practitioners with an approach to represent the varied demand and capacity conditions that facilities may be expected to operate under and suggests a realistic set of transportation management actions to respond to those conditions. Although the methods are intended to support ATDM analysis and provide content for Chapter 35 of the HCM, several aspects of the methodology, such as considering various combinations of demand levels and the characteristics of incidents, weather, and workzone when evaluating alternatives can be applied to analyzing most any improvement covered by the HCM. The ATDM Analysis methodology is designed to provide estimates of the effects of ATDM strategies on a facility in terms of throughput, travel time, speed, delay, and travel time reliability. The analysis considers a "before" case prior to the implementation of ATDM strategies and an "after" case with the ATDM strategies implemented.
The before conditions are used to calibrate and error check the selected traffic operations models to be used to estimate maximum person throughput, mean travel time, and travel time reliability. Depending on the availability of "before" information on traffic counts, incidents, weather, mean travel time, and reliability, the calibration can be relatively simple or quite sophisticated.
The after conditions represent conditions immediately after the ATDM strategy is implemented. The methodology predicts how facility throughput, mean travel times, and travel time reliability will change after implementation of the ATDM strategy. The methodology does not take into consideration any possible long-term induced travel from the improvement in facility performance.
The ATDM Analysis methodology, as currently structured, is designed to be applied to a freeway facility. Future research may extend the method to signalized roadways. Its current capabilities are built around concepts in Chapter 10 of the HCM ("Freeway Facilities"). In order to implement these concepts, the FREEVAL software tool (which was designed to implement the HCM Chapter 10 procedure) was modified to accommodate the inputs required to analyze ATDM strategies. This computational engine was developed so that the methodology could be tested for research and development purposes.
A flowchart of the analysis within the ATDM Analysis methodology is given in Exhibit 1. The major steps of the analysis are summarized below.
Exhibit 1: Flow Chart of ATDM Analysis Process
Source: Cambridge Systematics, Inc.
1. Preparation
This first task consists of setting the scope and purpose of the analysis, defining the target study area, and collecting data. Generally the same amount and type of data as are required for a typical highway operations analysis.
The primary difference is that additional historical data is needed on demand variability, weather frequencies, and incident frequencies. Default values may be used where actual historical data are not available to establish frequencies and demand variability.
The study area and time period must be valid for nonrecurring congestion conditions, and therefore will usually be larger than normally required by a conventional analysis evaluating only recurring congestion conditions.
An additional consideration is the selection of the period (the reliability reporting period) over which the reliability of the facility operations are to be compared with and without ATDM improvements. This reliability reporting period will usually be on the order of one year's worth of weekday peak periods (approximately 250 days; see Exhibit 2).
2. Generate Scenarios
Using historical data on demand, incidents, and weather, a set of demand and capacity scenarios are generated against which to evaluate current conditions and to test the new ATDM strategy. This is the "before" condition. Typically, 30 scenarios are generated, representing 5 different levels of possible demand and 6 different capacity levels as affected by different combinations of capacity reducing events, such as, bad weather and incidents. The probabilities of each scenario are computed based on the historical frequencies of the selected combination of demand, weather, and incident conditions for each scenario. The reason for selecting 30 scenarios is that it keeps the amount of effort to develop input data manageable while capturing the major sources of variability in performance. (See Exhibit 3 for a typical example.)
A conventional operations analysis input file is used as the "seed" file from which the various scenarios are created by factoring the demands and capacities. The seed file capacities and free-flow speeds are reduced for poor weather and incidents using capacity and speed adjustments recommended in the 2010 HCM where available.
Exhibit 2: Study Section, Study Period, and Reliability Space
Source: FHWA
| Capacity Level | Demand Level 5th Percentile | Demand Level 20th Percentile | Demand Level 50th Percentile | Demand Level 80th Percentile | Demand Level 95th Percentile | Row Total |
|---|---|---|---|---|---|---|
| Fair Weather, No Incidents | 6.18% | 15.45% | 18.54% | 15.45% | 6.18% | 61.80% |
| Fair Weather, Single Lane Closed | 1.07% | 2.68% | 3.21% | 2.68% | 1.07% | 10.71% |
| Fair Weather, 2 Lanes Closed | 0.04% | 0.09% | 0.11% | 0.09% | 0.04% | 0.36% |
| Poor Weather, No Incidents | 2.30% | 5.75% | 6.90% | 5.75% | 2.30% | 23.00% |
| Poor Weather, Single Lane Closed | 0.40% | 1.00% | 1.20% | 1.00% | 0.40% | 3.99% |
| Poor Weather, 2 Lanes Closed | 0.01% | 0.04% | 0.04% | 0.04% | 0.01% | 0.14% |
| Column Total | 10.00% | 25.00% | 30.00% | 25.00% | 10.00% | 100.00% |
3. Apply Selected Operations Analysis Tool to Scenarios
The appropriate operations analysis tool is used to evaluate facility operations for each scenario. Since FREEVAL was used as the analysis tool in this research, the analysis period is broken into 15-minute time slices, in accordance with HCM concepts.
Each scenario consists of a combination of demand, incident, and weather conditions. Essentially, the HCM analysis method (FREEVAL for this research) is run for each combination of demand, incident, and weather conditions. This differs from a typical HCM analysis where a single analysis would be made by using fixed factors assuming the average or "typical" condition.
4. Compute Measures of Effectiveness (MOEs)
The results output by the operations analysis tool are combined to yield the desired throughput, delay, and travel time reliability measures of effectiveness (i.e., performance measures) for the "before" condition. A combination of basic metrics is output along with other measures of effectiveness, relevant to system efficiency, travelers' perspectives, and reliability (see Exhibit 4).
| Basic Performance Measures Useful for Computing MOEs |
|---|
| Vehicle-Miles Traveled Demand (VMT-Demand) |
| Vehicle-Miles Traveled Served (VMT-Served) |
| Vehicle-Hours Traveled (VHT) |
| Vehicle-Hours Delay (VHD) |
| Measures of Effectiveness (MOEs) |
| System Efficiency: Average System Speed (MPH) |
| Traveler Perspective: Vehicle-Hours Delay/Vehicle-Mile Traveled (VHD/VMT) |
| Reliability: The Planning Time Index (PTI) |
5. Design ATDM Strategy
Based on an assessment of the "before" conditions and an identification of the relative contribution of weather, demand, incidents, and work zones to the undesirable performance of the facility or system, the analyst selects and designs the ATDM strategy that he or she wishes to test. If ATDM is already in place for the before condition, then the analyst identifies the changes in the existing ATDM strategy to be tested.
ATDM strategy response plans are identified to respond to any of the possible weather conditions, incident conditions, and peak demand conditions. The analyst identifies the threshold conditions which will trigger each ATDM response and describes the specific ATDM response. The software then implements the selected ATDM plan when the trigger conditions are met by one of the 30 scenarios.
The analyst specifies the ATDM response according to the response types, for example:
- Managed lane responses – these include opening and closing shoulder lanes, and adjusting the occupancy requirements for HOV lanes.
- Variable speed limit responses – these responses include different speed limits by section of freeway each limit applying equally to all lanes.
- Ramp metering responses – these include time-of-day, locally dynamic, and facility optimal dynamic metering plans.
- Pricing responses – These include static, time-of-day, and dynamic pricing responses.
- Traveler information responses include different levels of travel information responses in terms of their market penetration and likely effect on demand.
- Employer-based travel demand management (TDM) responses include different levels of employer/employee participation in TDM responses.
The effect of ATDM strategies is determined by modifying key inputs to the methodology: capacity, demand, free-flow speed, and incident duration. The user must decide which of these inputs is affected by a particular strategy and what the size of the impact is, and would code the impacts as adjustment factors for each of these inputs. Guidance is provided for how users should determine the size of these adjustments, but considerable judgment on the part of the user is required.
For example, consider the addition of a high-occupancy toll (HOT lane). At this point in time, the 2010 HCM does not yet incorporate HOT lane analysis capabilities. The recently completed NCHRP 3-96 research project should address this capability, when it is incorporated into the next update of the 2010 HCM. In the interim, an approximate procedure is recommended to evaluate freeway operations with a HOT lane present. The HOT lane is assumed to be continuously accessible. The total capacity of the three-lane freeway cross-section is the weighted average of the capacity of the HOT lane and the other two mixed-flow lanes. The policy operating capacity of the HOT lane is set at 1,600 vehicles per hour per lane (vphpl). This capacity is discounted to 1,500 vphpl to allow for some inefficiencies in the toll-setting process.
As another example, consider the effect of adding dynamic ramp metering. Locally optimal dynamic ramp metering is emulated in the HCM analysis tool by comparing the predicted total demand (ramp plus mainline) for the on-ramp merge section to the target maximum desirable flow rate for the freeway. The difference between the target merge section volume and the upstream freeway mainline input volume is the ramp metering rate, subject to certain constraints.
- The maximum ramp metering rate is set at 900 vphpl;
- The minimum ramp metering rate is set as 240 vphpl; and
- If, during the course of the analysis, the number of vehicles stored on the ramp hits 40, then the meter rate is set to the maximum rate until the queue drops below 40 vehicles.
6. Convert ATDM Strategy into Operations Analysis Tool Inputs
The ATDM strategy to be evaluated must be converted into the appropriate demands, capacities, and control inputs required for each specific scenario. This is done automatically based on the analyst-specified ATDM plan responses and data generated by this project on the impacts of different ATDM strategies on demand and capacity of freeways.
7. Apply Selected Operations Analysis Tool to Scenarios ("After" condition)
The same operations analysis tool as was used in the "before" analysis is used to evaluate the "after" performance. "After" condition demands are held essentially constant at this stage with the exception that drivers are assumed to cooperate with the new controls in effect (wait for ramp meters, obey new speed limits, etc.) and take advantage of any new capacity provided (simple lane shifts, but no route, time-of-day, or mode shifts).
ATDM Project Informational Briefs
This informational brief is one of the ATDM briefs in the Analysis category of the FHWA ATDM Brief Series. ATDM briefs are or will be available in the categories of:
- ATDM Program: Yellow
- ATDM Planning: Purple
- ATDM Analysis: Orange
- ATDM Design: Green
- ATDM Operations: Red
In addition to this overview brief of the ATDM/HCM Analysis method, FHWA is releasing additional project briefs to provide high-level descriptions of the various components of the ATDM/HCM methodology and its application.
8. Compute MOEs ("After" condition)
The results output by the operations analysis tool are combined to yield the desired MOEs. The "after" results are assessed by the analyst to determine if the ATDM strategy should be fine-tuned and re-evaluated.
FHWA ATDM Program
The United States Department of Transportation (U.S. DOT) is advancing the development of guidance, planning, case studies, and research in the application and design of active transportation and demand management approaches. In addition, the ATDM program will provide lessons learned, standards, and best practices on key underlying ATDM planning, evaluation, analysis techniques and design elements that serve as a foundation for ATDM implementation.
For more information on this project or the FHWA ATDM program efforts, please contact:
FHWA ATDM web site: https://ops.fhwa.dot.gov/atdm/index.htm

FHWA-HOP-13-035
June 2013