Measures of Effectiveness and Validation Guidance for Adaptive Signal Control Technologies
Appendix A. Technical Approach for Collecting MOES
There are four types of data necessary for computing the MOEs presented in the previous sections:
- High-resolution phase timing and detector actuation data collected by the ASCT, signal system, or controller;
- GPS probe vehicle trajectory data;
- Travel time and origin-destination data collected by vehicle re-identification equipment; and
- Volume data collected by system detection zones or vehicle counting equipment.
To validate objectives of ASCT, the first step is to collect any or all of these data elements. From these four basic sources, the next step is to ingest and store the data in a common database and process the data further. MOEs are then computed as requested by an analyst. This generic process is illustrated in Figure 24. Data formats and technologies for each of the types of data are discussed in the following sections.
Figure 24. Diagram. Generic Illustration of the Data Collection and Processing Methodology.
(Source: Kimley-Horn and Associates, Inc.)
High-Resolution Phase Timing and Detector Data
High-resolution phase and detector data can be recorded in one of two ways, either as time-stamped events or as raw status entries for every time slice. Modern controllers typically run the clock at 0.1s increments, but in most cases 1s increments should be suitable for performance measurement purposes. Some storage methods record detector data in subsecond increments each second to capture the case where a detector is active only a subset of the 0.1s increments of that second. Several controllers are known to store this information on the controller and allow an external process to retrieve the information as a binary file via FTP. Other controller vendors may be in the process of adding similar logging functionality. In the case of the one controller type, the storage is one file per hour of the day, so only one query per hour from an external process is necessary. A software application provided by the vendor is needed to convert the binary data to a generic CSV format. This makes the data accessible in near real-time while minimizing bandwidth requirements and the reliance on continual connectivity.
Some ASCT are known to store event-based phase timing and detector data on a daily basis. For example, one ASCT system stores second-by-second phase timing and detector data for each intersection in one .ZIP (A .ZIP file is a popular data compression format.) file for each intersection for each day. An external process can retrieve this raw data from a field or central ASCT server on a daily basis (e.g., 3:00 a.m.) using common file transfer tools. This approach does not provide the data close to real-time, but does not require a connection to every field controller. The ZIP files are typically larger than the hourly files stored by a controller. Other performance measurement systems such as the cabinet harness equipment developed by TTI or University of Minnesota store event based data in an SQL database on the field-hardened PC processor in the cabinet.
Some central systems poll controllers every second for phase timing and detector status data and archive this information in binary files or SQL database tables for analysis or display. This storage methodology provides the information in as close to real-time as possible, but is contingent upon constant reliable communication to each controller (see Figure 25).
Figure 25. Screen Shot. Hourly Phase and Detector Data Files from a Controller.
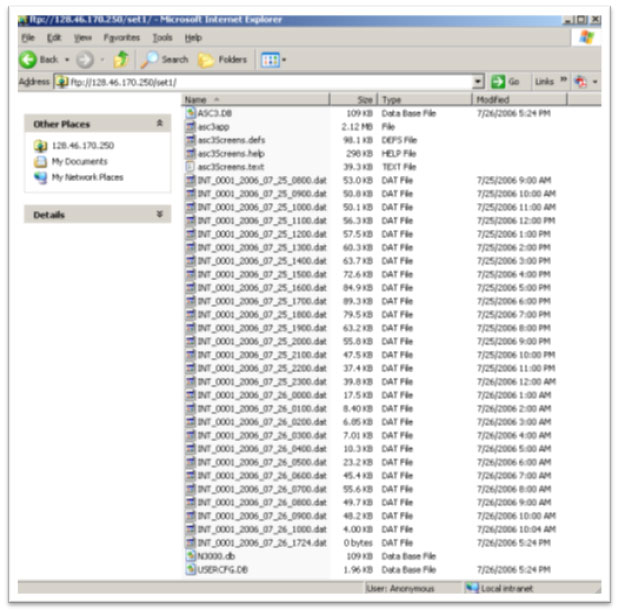
(Source: Smaglik et al., 2006.)
Each of these retrieval and storage methods use different formats and retrieval mechanisms. No industry-standard storage format or retrieval methodology has been established. For this project, all of these data availability methods cannot be implemented under the budget and schedule. Retrieval of high-resolution phase timing and detector data from the ASC/3 controller was implemented in this project. Once this high-resolution data is stored in a common database with the other data sources, the MOEs are computed.
Vehicle Re-Identification Data
There are several technologies that are available for measuring origin destination flows. These methods include:
- Bluetooth scanners.
- License plate readers.
- Magnetometers/inductive loop amplifiers.
All technologies have been shown to provide acceptable performance for measuring point to point travel times. No industry standard format exists for storage and reporting of the travel time information from the different field equipment types. Recently, several Bluetooth scanner vendors have promoted the use of the XML encoding format for providing feeds or file-based storage of travel time performance measurements. An example XML feed from a scanner server is shown in Figure 26.
Figure 26 . Message. Example XML Feed from BT Scanner Server
(Source: Nevada DOT Freeway Management System, 2012.)
Bluetooth data from the BlueTOAD website using real-time XML retrieval was implemented in this project.
GPS Probe Data
GPS probe data is available from a variety of laptop and Smartphone applications and systems. There is no industry standard format for the storage of GPS probe data. Laptop applications typically provide probe data trajectories in CSV output files. Smartphone GPS applications typically store travel time run information on the phone as CSV files or alternatively they push location, velocity, etc., data to a web server in real-time for analysis and display as the driver progresses along the route. For this project, GPS probe data will be stored on a web site in a SQL table format that records the location, speed, heading, altitude, and acceleration of each probe trip. Figure 27 illustrates typical data format from GPS tracking devices.
Figure 27. Table. Sample GPS Tracking Data.
(Source: Kimley-Horn Mobile Tracking System, 2010.)
GPS data from an Android smartphone app was supported in this project. Import of trajectories from other recording programs can be added at a later time.
Midblock Detection Data
Volume data is available from a variety of types of field equipment, including:
- Tube counters.
- Stand-alone detection stations (radar, magnetometer, video).
- System detectors connected to traffic controllers (variety of technologies).
Tube counter equipment includes a relatively simple field processor unit that stores the count and classification data locally. Most counters allow data to be retrieved from the device via a USB or serial interface after the tube is removed from the field. Most if not all tube counter devices do not have remote communications capability. Count summaries are typically provided in configurable bins such as five-minutes, 15-minutes, etc. Data is typically aggregated for subsequent use in simple CSV format or formatted Excel spreadsheets.
Stand-alone detection stations typically aggregate volume and associated information at a central server in a SQL database. The industry-standard X3 protocol has been developed for retrieval of data from detection stations in real-time (primarily in freeway applications, but arterial deployments can use the same equipment and protocols). Typically detection stations are polled every 20 to 30s for a summary count over that time period instead of being interrogated every second like most traffic controllers. Other interfaces such as XML-RPC have also been used to retrieve information from detector stations for archiving and analysis or use in traffic-responsive algorithms.
System detectors are also frequently deployed and connected to traffic controllers. The traffic controller aggregates the count and occupancy data on a specified interval and allows a central system to poll the aggregated data. This polling is typically done no faster than once per minute, and it is more typical (although this is not recommended) to aggregate the information in longer intervals (five to 15 minutes). NTCIP and AB3418E define standard storage formats for the aggregated data. Other vendor-specific storage formats are also used for storing and retrieval of volume count and classification data.
All methodologies have been shown to provide acceptable performance for measuring screen-line counts and vehicle classification, with appropriate configuration and deployment. Due to budget and schedule constraints this project only used volume data from manual import of tube counter files. Other methods can be supported at a later time.
Table 8 maps each data source to the group of MOEs that need the data for computation.
Table 8. Mapping of MOEs to Data sources.
| MOEs |
Data Sources |
Operational Objectives |
- Route travel time
- Route travel delay
- Route average speed
- Route travel time reliability
|
- Import travel time data from Bluetooth scanner
- Import trajectory data from GPS probe
|
- Smooth flow
- Multiple objectives by TOD
|
- Link travel time, delay
- Number of stops per mile on route
|
- Import trajectory data from GPS probe
|
- Smooth flow
- Manage queues
- Multiple objectives by TOD
|
- Traffic volume on route (throughput)
- Time to process equivalent volume
|
- Import count data from tube counter file
|
- Smooth flow
- Manage queues
- Multiple objectives by TOD
|
- Percent arrivals on green, by link
- V/C ratio by movement
- Platoon ratio, by link
- Phase green to occupancy ratio by movement
- Reliability of phase metrics
|
- Import high-resolution signal timing and detector data
|
- Smooth flow
- Access equity
- Multiple objectives by TOD
|