Traffic Analysis Toolbox Volume XIV: Guidebook on the Utilization of Dynamic Traffic Assignment in Modeling
3.0 Modeling Capabilities
Two main topics are covered in this chapter. The first topic is the network-related capabilities that DTA models may have, and the second is the methodology of Multi-Resolution Modeling and how a DTA model becomes an essential element of the MRM framework.
3.1 Network Capabilities
An important aspect of DTA is its ability to capture dynamic interactions between travelers and the network. One significant interaction is vehicle movements at arterial intersections, especially turning movements or lack thereof (i.e., turn prohibitions). Another design-related network capability is restrictions to facilities based on traveler type, such as high-occupancy vehicle (HOV) and HOT lanes and truck restrictions.
The following information on network capabilities is presented in four categories: capacity, traffic control, pricing, and evacuation modeling.
Capacity
DTA is designed to model a wide range of scenarios, including temporary capacity changes. Capacity expansion and reduction adjustments can be implemented to represent certain Active Traffic Management (ATM) strategies, such as hard-shoulder running or reversible lane operations. Hard-shoulder running, reversible lane operations, rush-hour truck-lane restrictions, and truck-only lanes on freeways are good examples of freeway capacity changes. These strategies can be implemented using the pricing capability in DTA to restrict certain vehicle classes. Changing arterial capacity in practice is typically implemented through restricting roadside parking or reversible lanes during rush hours.
A DTA model considers the effects of capacity changes in assignment and simulation. To model a traveler’s reaction towards an immediate change in capacity reduction one must consider both the reaction to prevailing congestion and the reaction to information describing congestion. The first aspect is based on the premise that a traveler may consider commencing diversion during the journey when, upon arrival at an intersection, his or her current travel time exceeds the historical travel time by a tolerance threshold.
The second aspect is premised on the provision of pre-trip and en-route information. When information indicates that a traveler’s current route may be disrupted by an incident, the traveler may consider an alternative route. Depending on the spatial and temporal availability of the information, this rerouting decision can be commenced either at trip origin or mid journey. For example, pre-trip information provided through the Internet or public access television (TV) may influence a certain percentage of travelers. Conversely, en route information provided by radio, DMS, or smartphone affects travelers’ rerouting decision differently depending on temporal and spatial access. Radio or smartphone information only reaches a percentage of the network’s travelers, while DMS information is spatially limited, reaching only those who traverse the DMS location.
Modeling route diversion generally follows this principle: the latest information accessed by the user will take the highest priority. For example, at the time of departure, a traveler can decide to reroute or not to reroute; however, at a later time, when traversing a DMS location he or she can engage in another rerouting decision.
In simulation and in real life, changes in capacity can happen in certain situations that are unknown to travelers beforehand, such as incidents. At the location of the incident, the simulation would reduce the number of lanes by a user-defined percentage. For those travelers caught on the link at the time of capacity reduction, the density will increase, thereby altering the speed-density relationship (i.e., density will increase and speed will decrease). Those travelers upstream of the link then experience a shock-wave that propagates backwards. The “choke-point” is located at the upstream location of the capacity reduction link, and the reduced speed occurs upstream of the “choke-point.”
DTA provides functionality so that travelers in queue may find an alternative route based on their perceived delay, which is determined by past experience. Those travelers who are informed about the en route or pre-trip conditions of the network may choose an alternative route before entering the capacity reduction location.
Other time-dependent instances that are known to the travelers (e.g., work zones, hard-shoulder running, and reversible-lane operations) may experience something similar to that described above; however, the occurrence is repeated on a daily basis, so adaptation to the known occurrence is possible via DTA. Once the simulation iteration is complete, time-dependent travel-time information is fed to the shortest path algorithm which then recognizes the increase in travel time due to the occurrence. New shortest paths will be calculated that should avoid the problematic location, thus providing alternative routes bypassing the location. This has an effect on the surrounding area by increasing volume and travel times on alternative routes. Over many iterations, DTA works to find a new equilibrium based on the new network conditions.
For the case when capacity is increased (such as creation of a new facility, new lane capacity to existing roadways, temporary capacity increase during rush hour (hard-shoulder running or reversible-lane operations)), in the assignment procedure, the shortest path will recognize the improvement of travel time, and in turn, the traffic assignment will assign travelers to those facilities. If the capacity is time-dependent, the DTA will determine the appropriate departure-time intervals that will most benefit from the increased capacity.
Traffic Control
Typically, traffic control devices traffic signals, ramp meters, etc. assign right-of way at intersections and junctions, and as a result these controls introduce delays. Traffic control devices on the roadway act as time-dependent capacity reductions and expansions. Typically, traffic control devices and strategies modeled in DTA are pretimed and actuated signals, yield signs, stop signs, and ramp metering. Coordination of pre-timed and actuated signals and ramp metering also can be modeled in DTA.
Signal Control
Like the signal controllers in the field, a DTA model can have cycle lengths, phasing, splits, and offsets to represent the conditions of the real network. Having this information in place in a DTA model provides a realistic approach to emulating existing conditions. For instance, if a span of pre-timed signals along a roadway is coordinated, the directionality of progression would display the discharge of heavy traffic for a certain direction.
In DTA simulation, the prevailing saturation flow rate, phasing, movements, green-time allocation, and turn capacity play a significant role in experienced delay, which feeds travel-time information for traffic assignment to determine better routes. A DTA model could have different capacity for each major movement (left-turn, through, and right turn). Given the green time and turn capacity, the simulation will determine the discharge flow rate for each turning movement. The simulation also should consider the situation in which permissive left turns (and right turn on red) are allowed, which means the use of critical gap acceptance is considered. Depending on the theory and methodology of the simulation model – whether it be link-based or lane-based simulation – the model should consider the possibility of the congestion and spill-back of turning bays.
Ramp Meters
Ramp metering is modeled by managing the flow rate of the on-ramp by way of a signal control on the ramp roadway. Different DTA models should have the capability of applying different ramp metering strategies from fixed time, to time of day, to adaptive strategies. The objective of adaptive ramp metering is to minimize travel time for a corridor or a freeway segment taking into account for freeway and ramp traffic. In the model, measured traffic flow and/or speed on the freeway mainline lanes, as well as delay and queues at on-ramps are fed into an algorithm to determine the appropriate metering rate.
Unmetered ramps are essentially a no-control situation in which vehicles are not subject to any delay caused by a meter when traversing the node. A fixed-time ramp meter allows a ramp meter to be turned on during a modeler-specified time window. The metering rate is fixed at a specified level and vehicles traversing that link will be discharged at this given rate. Locally-adaptive ramp meters adjust the metering rate according to the traffic conditions of the mainline immediately downstream of the metered ramp. A user will specify a minimum and maximum rate, and the metering rate is adjusted within this range. Corridor-adaptive ramp meters group multiple consecutive ramp meters to operate as a coordinated ramp group. During the onset of congestion, if the meter alert is triggered for one of the ramps, the group to which this ramp belongs is set to be in the coordination state; otherwise, these meters are operated independently as locally-adaptive meters.
When the meter group is in the coordination state, the metered rates for each member ramp are computed based on the joint assessment of the congestion condition of the main-line encompassed by the meter group. All the ramps in the same group upstream of the bottleneck will start to have their metered rate decreased in order to accomplish the targeted reduced rate, without excessively penalizing the most downstream ramp.
Pricing
DTA models can be designed to use several types of pricing schemes, namely, fixed, time-of-day, and congestion-responsive pricing. From a route-choice perspective, DTA assumes that HOV/HOT utilization is primarily a route-choice problem, and possibly a departure-time-choice problem in which a traveler could choose to leave earlier or later so as to avoid the higher toll. DTA employs the concept of a generalized cost; the costs are time-varying, including link travel times, intersection delays, lane-specific monetary cost, and facility-based bias factor. The three common types of pricing schemes modeled by DTA include the following:
- Fixed Pricing. This pricing scheme is of the simplest form in which a link’s generalized cost is set at a constant price.
- Time-of-Day Pricing. The time-of-day pricing scheme significantly amplifies the fixed scheme by making the price dependent upon vehicle class and time of travel. Tolls are typically converted to time equivalence by dividing by value-of-time and then added to the travel time to form a generalized cost.
- Dynamic/Variable Toll Pricing. In dynamic pricing, the toll price is determined based on current or recent operations in a HOT lane and/or the general purpose lanes. Also, the pricing formula can vary depending on specific operating criteria such as maintaining a minimum speed of 35 mph at the HOT lane.
Evacuation Modeling
DTA has the ability to capture complex and dynamic interactions between demand and supply during an evacuation event. The total number of evacuees, the intended evacuation destinations, the departure-time profile, and the chosen routes determine “desires” to request the transportation service. On the supply side the network topology, capacity, configurations, and traffic controls limit the amount of “available service” that can be used by the evacuees.
During an evacuation event, demand is usually much greater than supply, resulting in traffic congestion. Evacuees may change their evacuation decisions prior to or during evacuation in response to traffic management strategies such as evacuation information, contra-flow lanes, etc. Once the decisions are modified the traffic demand on evacuation routes would change, and so would the congestion resulting from the new demand-supply interaction. The system-level outcome of such an interaction, as depicted in Figure 3.1, can be properly captured through a DTA model equipped with pertinent simulation modeling components.
The “information” component is an important element in evacuation modeling. Evacuation-related information provided to evacuees by public or private entities through various information dissemination channels – such as commercial radio stations or highway advisory radios (HAR), TV, web site, or DMS – often affect evacuees’ evacuation decisions prior to or during evacuation. DTA can be applied to model different classes of users who have different levels of information as well as different levels of compliance with indicated routes.
Figure 3.1 Demand-Supply Interactions for Evacuation Event
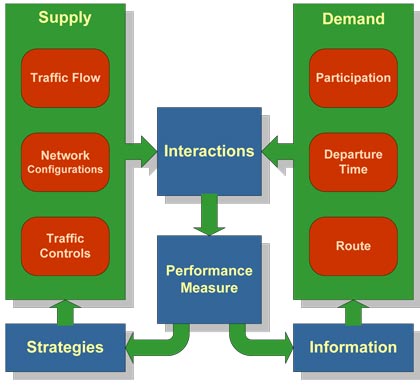
Source: University of Arizona.
The overall evacuation modeling capability can be considered from either a “descriptive” or “prescriptive” perspective.
- Descriptive capability. Here the model is used to evaluate the outcome of the demand-supply conditions and evacuation management, as well as information strategies specified by the user. The descriptive capability is suitable for modeling “what-if” scenarios and for testing different strategies.
- Prescriptive capability. Here an optimal strategy would be sought to satisfy a specified objective. The search of the optimal strategy is automatically performed by the model through the simulation of the demand-supply interactions as well as a solution algorithm.
3.2 Multi-Resolution Modeling
Existing transportation analysis models share certain features but vary widely in their implementations and data requirements. Every tool type represents a tradeoff between geographic scope and level of resolution (scale versus complexity). Less detailed tool types are tractable for large networks, while more detailed tool types are restricted to smaller networks. Depending on network size and the types of analyses required, all tool types are potentially valuable for transportation analysis.
Microscopic simulation models are effective at analyzing system optimization strategies such as freeway ramp metering and arterial traffic signal coordination. Travel demand models are better at estimating mode shift, but microscopic and mesoscopic simulation models are better at estimating route shifts. Mesoscopic tools can estimate regional dynamic diversion of traffic and congestion pricing, while microscopic tools can estimate route shift at a smaller geographic scale.
Each tool type has different advantages and limitations and is better than other tool types at some analysis capabilities. An integrated approach can support transportation planning, design, and operations by combining the capabilities of these tools. Interfacing between different analysis tool types presents consistency challenges including maintaining the consistency across analytical approaches in the different tools and maintaining the consistency of performance measures used in the different tool types.
Multi-Resolution Modeling (MRM) encompasses tools with different traffic analysis resolutions. Three classes of modeling approaches – macroscopic, mesoscopic, and microscopic – are considered essential components of a general MRM methodology. Overall, the MRM methodology includes macroscopic trip table manipulation for the determination of overall trip patterns, mesoscopic analysis of the impact of driver behavior in reaction to mitigation strategies (both within and between modes), and microscopic analysis of the impact of traffic control strategies at roadway junctions (such as arterial intersections or freeway interchanges).
From a technical stand point MRM is a modeling technique that integrates models with different temporal and spatial resolutions, i.e., macroscopic, mesoscopic and microscopic modeling. The term “temporal resolution” refers to the time interval or frequency at which the dynamic state of the model is updated. “Spatial resolution” refers to the detail of network representations and flow characteristics.
A mesoscopic model’s resolution is typically fractions of a minute from one to ten seconds. The mesoscopic resolution requires more computational effort than the macroscopic model because the system state of the network is updated much more frequently. The resolution of a microscopic model is typically fractions of a second to a second. Again, the computational effort increases relative to the macroscopic and mesoscopic models because of the frequency of the update to the system state of the network.
In addition to the more frequent system state updates, the model flow behavior creates increasing computational time between the model resolutions. Macroscopic models are the least intensive and deal with groups of vehicles. Mesoscopic models are more intensive and deal with groups of vehicles at a more refined lane by lane level. Microscopic models are the most intensive and deal with the interaction between individual vehicles. The spatial resolution (geographic size and network detail) may vary between the model resolutions. Macroscopic models tend to have the larger areas and the coarsest network, including higher functional classification of roadways such as major freeways and arterials. Microscopic models tend to cover a smaller geographic area but with more detail, including minor streets and even driveways. Mesoscopic models’ spatial resolution ranges widely depending on the modeling needs.
Each of these models serves different purposes, but these models are not mutually exclusive. Rather, these models can be complementary, and MRM aims to take advantage of that fact.
The notion of hybrid simulation also exists in literature (Florian, Mahut, and Tremblay 2001; Burghout 2004; Burghout, Koutsopoulos, and Andréasson 2005; Leclercq 2006; Mammar, Lebacque, and Salem-Haj 2006; Shi, Ziliaskopoulos, and Zhang 2006; Yang and Morgan 2006; Wilco Burghout 2007). Hybrid simulation generally refers to on-line or run-time integration of microscopic and mesoscopic simulation models. In a hybrid simulation model, a subarea is typically created that runs with the microscopic simulation logic and rules while the rest of the network runs with mesoscopic traffic simulation rules. In a hybrid simulation process, mesoscopic and microscopic domains are typically pre-defined and vehicles in both regions are simulated concurrently.
The concept of MRM discussed in this document is geared toward mostly the off-line model integration. Concepts and issues discussed below are also applicable to hybrid simulation.
The challenge in applying a MRM modeling framework lies in the consistency and effort requirements of the framework. Figure 3.2 demonstrates the relationship between different modeling resolutions in MRM.
Figure 3.2 Multi-Resolution Modeling Frameworks
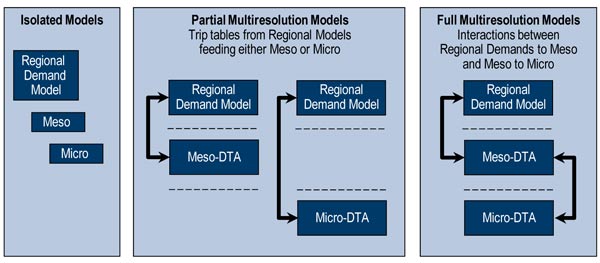
Source: Cambridge Systematics, Inc.
3.3 Reference
Burghout, W., 2004, Hybrid Microscopic-Mesoscopic Traffic Simulation, Ph.D. Dissertation, Royal Institute of Technology.
Burghout, W., H. Koutsopoulos, and I. Andréasson, 2005, “Hybrid Mesoscopic-Microscopic Traffic Simulation,” Transportation Research Record: Journal of the Transportation Research Board 1934(-1): 218-255.
Florian, M., M. Mahut, and N. Tremblay, 2001, A hybrid optimization-mesoscopic simulation dynamic traffic assignment model, Intelligent Transportation Systems, 2001, Proceedings, 2001 IEEE.
Leclercq, L., 2006, Hybrid Resolution of the LWR Model, 85th Annual Meeting of the Transportation Research Board, Washington, D.C.
Luo, L. L., and S. Joshua, 2011, Can Multi-Resolution Dynamic Traffic Assignment live up to the Expectation of Reliable Analysis of Incident Management Strategies? The 13th TRB National Transportation Planning Applications Conference, Reno, Nevada, TRB.
Mammar, S., J.-P. Lebacque, and H. Salem-Haj, 2006, A Hybrid Model Based on a Second Order Traffic Model, 85th Annual Meeting of the Transportation Research Board, Washington, D.C.
Shelton, J., 2007, IH-10 East Corridor Improvement Study Using Multi-Resolution Dynamic Traffic Simulation Approach – Final Report, El Paso, Texas Transportation Institute.
Shelton, J., 2010, Multi-Resolution Modeling Methods for Bus Rapid Transit Planning and Alternatives Analysis in El Paso, Third Annual Border to Border Transportation Conference, El Paso, Texas, Center for International Intelligent Transportation Research.
Shi, H., A. K. Ziliaskopoulos, and J. Zhang, 2006, A Hybrid Mesocopic-Microscopic Traffic Simulation Model: Design, Implementation and Computational Analysis, 85th Annual Meeting of the Transportation Research Board, Washington, D.C.
Villalobos, J. A., Y.-C. Chiu, P. L. Gurian, and J. M. C. Heyman, 2005, Development of a Multi-Resolution Large-Scale Vehicular Simulation and Assignment Model to Assess Impact of Port-of-Entry on Regional Infrastructure. Proceedings of the 2004 ASCE Computing in Civil Engineering Conference, Cancun, Mexico.
Wilco Burghout, J. W., 2007, “Hybrid Traffic Simulation with Adaptive Signal Control,” Transportation Research Record: Journal of the Transportation Research Board 1999(2007): 191-197.
Yang, Q., and D. Morgan, 2006, A Hybrid Traffic Simulation Model, 85th Annual Meeting of the Transportation Research Board, Washington, D.C.
American Society of Civil Engineers