Priced Managed Lane GuideCHAPTER 2. Planning and Implementation2.1 Development and Implementation of Priced Managed LanesThe planning and implementation process for priced managed lanes should be familiar to most transportation professionals. As shown in Figure 1, the steps involved are similar to those associated with any highway improvement and also align with the metropolitan planning organization (MPO) and National Environmental Protection Act (NEPA) processes. 2.1.1 Pre-PlanningOnce the need for an improvement is identified, the responsible transportation agency—often in coordination with the local MPO—identifies and reviews conceptual, operational and physical solutions for their effectiveness, anticipated cost, ease of implementation, and acceptability to the public. The improvement is then weighed against the other needs facing the state and local region, and then a decision is made whether or not to proceed with the project. 2.1.2 PlanningIf the project sponsor makes a decision to proceed with the project, the project must be incorporated into the MPO’s long-range Metropolitan Transportation Plan (MTP) that identifies transportation needs and policy over a 20-year horizon. Once in the MTP, federal funding may be used to support planning work and the completion of NEPA environmental clearance documents. During this process, the project sponsor narrows and refines conceptual improvements and assesses the ability of a shortlist of more promising alternatives to meet a variety of desired goals. The process culminates with the identification of a preferred alternative, which is approved through a Categorical Exclusion, a FONSI upon the completion of an Environmental Assessment, or a Record of Decision (ROD) upon completion of an EIS. In order to be cleared with a FONSI or ROD, projects must also be incorporated into the MPO’s Transportation Improvement Program (TIP), which is a near-term, fiscally constrained plan identifying which projects in the MTP will be completed in the coming four-year cycle. 2.1.3 Design and ProcurementOnce the MPO and NEPA requirements have been completed and funding commitments have been secured, the project sponsor completes design work for the preferred alternative and then puts the project out to bid. If the project is being procured using the traditional design-bid-build (DBB) model, the project sponsor would retain a design consultant to complete 100-percent final design drawings and hold a second procurement for project construction, with the award made to the qualified contractor submitting the lowest bid. Alternatively, if the project sponsor opts to procure the project on a design-build (DB) or DBFOM concession basis, a design-builder or private concessionaire would complete the final design work. The sponsor would also need to undertake additional analyses in order to determine if DBFOM procurement would be feasible. These would include conducting a financial feasibility analysis to see if the project could be funded from forecasted toll proceeds and preparing a “base financial case” to determine what project sponsor’s cost would be if it built, operated, and maintained the project. The project sponsor would compare the “base financial case” with offers submitted by private developers to determine whether private development would deliver a better value than a traditional public procurement. 2.1.4 ConstructionDuring the construction phase a private contractor, design-builder, or private development partner builds the project according to the design or design specifications and implementation schedule established in the construction contract. The project sponsor supervises the construction to ensure that it will be consistent with the design and meets the necessary quality standards. 2.1.5 Operation and MaintenanceOnce the construction has been completed to the satisfaction of the project sponsor, the new facility is put into operation. With traditional DBB or DB procurements, the project sponsor assumes responsibility for maintaining and operating the managed lane. With DBFOM concessions, the private developer operates and maintains the facility for a designated concession period, during which it has the right to collect toll revenues or receive availability payments from the project sponsor. In some cases, the project sponsor or other public toll agency might be responsible for toll collection. Responsibility for enforcement and incident management also remains with the appropriate public agencies. 2.2 Common Challenges with Priced Managed LanesWhile the steps involved in the implementation process may be familiar, priced managed lane projects can be expected to introduce new technical, institutional, and outreach challenges. Because of these challenges, agencies implementing priced managed lane projects must develop expertise that is not needed to implement more traditional highway improvements. The following section and subsequent chapters of the Priced Managed Lane Guide discuss these issues. 2.2.1 Technical ChallengesThe following are technical challenges associated with implementing priced managed lanes:
2.2.2 Institutional ChallengesThe following are potential institutional challenges associated with implementing priced managed lanes:
2.2.3 Public Acceptance ChallengesPublic outreach and consensus building activities are critical components throughout the process of implementing priced managed lane projects, due to numerous challenges:
As described further in Chapter 4, Outreach efforts are essential to the successful outcome of priced managed lane projects. This Guide recommends the following approach:
2.3 Operational and Policy Decisions for Priced Managed LanesAs agencies begin the planning process for new priced managed lane projects, they need to make important decisions on a wide range of operational and policy decisions. This is often accomplished with the preparation of a Concept of Operations document. While the preparation of a Concept of Operations is not required, FHWA strongly recommends preparing a Concept of Operations document for priced managed lane improvements, especially for larger more complex projects. Section 2.3.1 describes the Concept of Operations process. 2.3.1 Concept of OperationsThe Concept of Operations is a formal document that describes the use and operation of priced managed lanes projects. It is used to present the proposed project to decision makers and other stakeholders and to solicit their feedback on how to improve it. The Concept of Operations is often a living document that evolves as decisions are made as planning and design work progresses. The Concept of Operations provides information on the following issues:
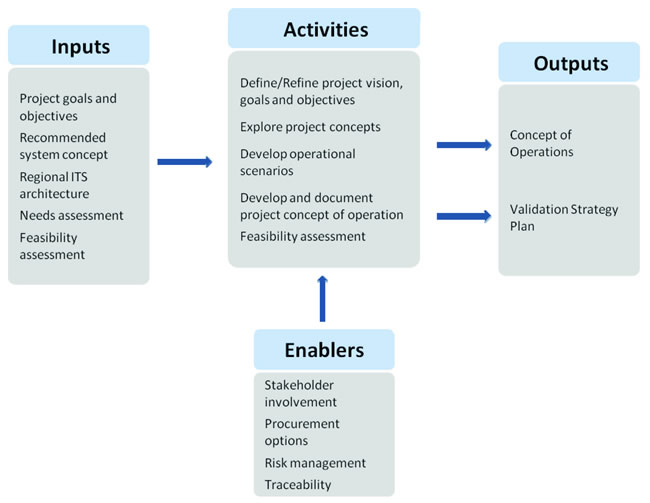
As part of a larger Systems Engineering Guidebook, FHWA’s California Division Office has developed guidance on the Concept of Operations process (Figure 2-1). In addition to descriptive information, this guidance also provides examples of Concept of Operations documents as well as other useful templates and checklists. Figure 2-1: Concept of Operations Process
The Concept of Operations should inventory all known institutional requirements that will be needed to implement the priced managed lane project, as well as any outstanding institutional or technical needs. These could range from issues such as the need to pass toll authorization legislation or enhance travel demand models. The document should also describe the public information program that will be implemented to gain feedback and support for the priced managed lane. Lastly, the Concept of Operations should also identify the different stakeholders that would be involved in implementing and operating the managed lanes, together with their respective roles. The development of the Concept of Operations should also involve all stakeholders and serve to build consensus in defining the mission and goals behind the project and agreement on the roles each of the stakeholders will play. The Concept of Operations process should be flexible and can be used to guide improvements in a single corridor or the development of a regional network of priced managed lanes. Regional Concept of Operations do not address the specifics of individual corridors, but rather address policy, operations, and technology issues. They may also be used to determine the extent of the network of lanes on which pricing will be implemented, as well as the phasing of those improvements. Regional Concepts of Operations tend to be top-down efforts that establish policies that will be applied at a broad level. As such, they support the development of individual projects that will ultimately become part of the network. For example, the Metropolitan Transportation Commission (MTC – the MPO for the San Francisco Bay Area) prepared a regional Concept of Operations for the region in 2010-2011. That same document also supported the opening of the I-680 Express Lane in Alameda County in 2010 and the SR 237 Lanes in Santa Clara County in 2012. While the development of Concepts of Operations tends to begin as a top-down process led by a state department of transportation (DOT) or regional planning authority, this may change as individual projects near implementation when a subsequent project-specific Concept of Operations document would be prepared by the project sponsor. In this case, as lessons are learned from an individual project, they may also be to Concepts of Operations for other priced managed lanes in the region. 2.3.2 Establishing Operational ObjectivesEstablishing goals and objectives is an essential early step in the planning process for priced managed lanes. The establishment of operational objectives should also be a collaborative process between the project sponsor, the local MPO, transit partners and local communities. Planning for operations is different than planning for capital improvement projects. FHWA promotes the use of an objectives-driven, performance-based approach to planning for operations as an effective way to integrate operations in local transportation plans and provides comprehensive guidance on the process in its 2007 guide, Advance Metropolitan Planning for Operations: The Building Blocks of a Model Transportation Plan Incorporating Operations. Operating agencies are typically involved in the regional transportation planning process and interact with MPOs. However, it is important to engage day-to-day operating agency managers from a systems operations perspective and not simply as advocates for capital projects. Developing an interagency committee that focuses on improving regional management and operations has been an effective technique used by several MPOs to engage operators in addressing regional operations. This forum can be uses this forum to determine system performance priorities, operations objectives, data availability, and funding opportunities. Once the goals for road pricing projects have been established, project sponsors and planning organizations develop a set of objectives to assess and compare the extent to which different pricing alternatives are able to achieve the desired goals. Possible objectives include one or more of the following:
In cases where the private sector is responsible for developing and financing priced managed lanes, their main objective may be to maximize revenue levels. Public agencies implementing priced managed lane facilities may also be more focused on maximizing operational efficiencies such as throughput and travel-time savings. These metrics are not necessarily exclusive as revenue maximization should generally coincide with the optimization of operational efficiencies, such as throughput and travel-time savings. 2.3.3 Occupancy RequirementsOccupancy requirements are another essential issue underpinning priced managed lane projects. Most HOV and HOT lane facilities have a two-person occupancy requirement for free trips, but a number of highly utilized facilities have an HOV-3 occupancy requirement. The project sponsor will need to make decisions about which vehicles will be allowed to use the priced managed lane for free or at a reduced priced and which vehicles will pay the full variably priced toll. Decisions on occupancy rate should be driven by HOV utilization, revenue generation aspirations, and occupancy requirements on other HOV or priced managed lanes in the region. They may also reflect other regional goals such as encouraging ride sharing and greater use of transit. In some instances, increasing HOV occupancy requirements poses public acceptance challenges. However, these may be easier to overcome if increases in occupancy rates are made along with other improvements, such as the implementation of priced managed lanes. With projects that involve the conversion of an existing HOV facility to priced operation, the pre-existing occupancy rate on the HOV lanes is a fundamental metric. As discussed in Section 1.8, if the HOV lanes are under-utilized during peak periods, occupancy rates are usually left unchanged. However, if the lanes are at or near capacity during the peak period then there may be a need to increase them. Increases may apply to all hours of operation or they may be limited to peak travel periods. Similar issues arise with priced managed lane projects involving the provision of new capacity. However, in this case occupancy rates may be driven to a greater degree by policy goals and revenue generation needs and less by expected utilization rates. For example, the I-95 Express in Miami involved the conversion of an existing HOV lane to HOT operation and the provision of an additional managed lane. The existing HOV-2 lane was heavily utilized and the project sponsor was concerned that the new lane would fill quickly with additional HOV motorists if the occupancy rate remained unchanged. So, the decision was made to increase the occupancy requirement for free trips to HOV-3 when the HOV-to-HOT conversion was made. This ensured that the new lanes would not become congested with non-paying HOV vehicles and enable the lanes to generated additional toll revenue. It also avoided the challenges of increasing the occupancy rate at a later date. Interestingly, the change from HOV-2 to HOV-3 did not generate much controversy because conditions improved in both the managed and general-purpose lanes after new lanes entered service. This was particularly true on the managed lanes with the provision of a second travel lane each direction, allowing motorists to pass slower vehicles. In some cases it may be helpful not to make decisions on occupancy early on in the assessment of priced managed lane projects, to provide the flexibility to respond to future developments, such as increases in the cost of fuel or the decision to implement the project on a P3 basis. Planning and environmental studies provide an excellent process by which to assess the performance of the priced managed lanes assuming different occupancy rates, as well as the opportunity to assess public opinion. 2.3.4 Vehicle RequirementsThere are other vehicle requirements that need to be established for priced managed lane projects. The most fundamental is whether vehicles need to be equipped with ETC transponders in order to use the facility. Currently, all priced managed lane facilities in the U.S. require paying non-HOV vehicles to have transponders. Access to transponders is another mechanism to manage the number of vehicles using the managed lane. However, this may change in the future with the greater deployment of tolling systems with license plate readers using character recognition technology and greater use of transponders among motorists. Today, qualified HOVs are not required to be equipped with transponders on most priced managed lane facilities. However, in some cases project sponsors may also require HOV motorists to have transponders that identify them as qualified non-paying HOV vehicles. This approach is being used on the HOT conversion of the existing HOV lanes on I-10 and I-110 in Los Angeles. These Metro Express Lanes will be the first in the U.S. requiring HOV motorists to use transponders with a toggle switch to identify their vehicle as a qualified HOV vehicle or declare themselves as a paying SOV if they are driving alone and wish to use the lanes. Any HOV vehicles using the Metro Express Lanes with standard transponders will be charged the same toll as SOVs. In addition to qualified HOV vehicles, certain other vehicles may be allowed to use priced managed lanes at no cost. These normally include transit vehicles (buses and vanpools), police, emergency response vehicles, and in some cases motorcycles. Certain SOVs may also be allowed to use priced managed lanes at no cost. The most common exemption of this type is made for low-emission ILEVs.[2] Some states provided unlimited free access to ILEVs on priced managed lanes. Others have limited the number of qualified ILEVs allowed on managed lanes by issuing a fixed number of ILEV permits. In some cases the more prevalent use of low-emission vehicles, has lead to significant numbers of ILEVs on HOV facilities to the point where they may degrade traffic services. Many policymakers now believe that the reduced fuel costs are incentive enough for the purchase of ILEVs and that the ILEV exemption is no longer necessary. Project sponsors should consider ILEV policies carefully on new priced managed lane projects, as non-paying ILEVs take up priced managed lane capacity that could otherwise be sold to paying vehicles. This phenomenon limits available capacity and thereby drives prices up for other paying vehicles. Experience in states that have allowed ILEVs to use managed lanes also demonstrates that this policy is difficult to reverse once a precedent has been established. 2.3.5 Revenue SharingThe disposition of project revenues is another important policy issue that will be of particular interest to the public. Decisions on the use of toll proceeds are often sensitive and should be addressed up front. As shown in Table 2-1, annual toll revenues and operating costs associated with priced managed lane projects vary greatly from facility to facility. Revenues from managed lanes may be used to cover the cost of operating the facilities. If there are excess proceeds, they may be used to pay for the initial implementation of the managed lanes or to support other transportation needs in the corridor or region. Close coordination with transit providers and the possible use project revenues to support transit improvements in the corridor is often an effective strategy to garner support for managed lane improvements from a wide cross section of stakeholders. Revenues for projects involving the conversion of an existing HOV facility to HOT operation should be expected to be modest and are often not adequate to offset operating costs. This is the case with the SH 167 near Seattle, the I-15 Express in Salt Lake City, and the I-35W MnPASS in Minneapolis. While the I-394 MnPASS in Minneapolis generates an operating profit of approximately $540,000 per year, this is offset by an annual payment of $1.5 million by the Minnesota Department of Transportation (MnDOT) to repay a capital loan account that was used to pay for the implementation of the project. Two-lane HOT lane facilities, such as the I-25 in Denver may be expected to earn a modest operating profit. This 8-mile, two-lane reversible facility has annual revenues of $2.4 million and operating costs of $1.5 million. Under state law, excess revenues are permitted to be designated to transportation improvements in the corridor (including transit, vanpool, and carpool services) as well as reconstruction, expansion, and extension of the managed lanes. Under the right conditions, revenue from higher volume managed lanes with at least two lanes per direction can exceed operating costs by a significant amount. This is the case with projects such as the Katy Freeway managed manes in Houston and the I-95 Express in Miami, which have annual operating surpluses of $5.6 million and $7.1 million, respectively. In Houston the operating surplus is used to repay underlying debt that was used to cover a portion of the cost of building the new lanes, while in Miami nearly half of the operating surplus is used to support transit operations and the remainder is held in reserve accounts. With annual revenues of over $41.2 million, the SR 91 generates the most revenue of operating U.S. managed lane facilities by far. Operating costs—including the repayment of underlying project debt—total nearly $22.4 million, leaving its sponsor—the Orange County Transportation Authority (OCTA)—with $18.9 million annual to support other transportation needs. While the SR 91’s ability to generate revenue is exceptional given that it is the only high-capacity route through a mountain pass between large activity centers in Orange and Riverside Counties in California, other new managed lane facilities currently in implementation are also anticipated to generate significant amounts of revenue. These include the $2.0 billion I-495 Capital Beltway Project, which is adding four managed lanes to one of the most congested Interstate highway in the U.S. This project is being financed largely through the anticipated toll revenues. The same is also true of the $2.0 billion North Tarrant Express and the $2.6 I.H. 635 Managed Lanes, both of which are being implemented through P3 procurements in Dallas / Fort Worth. 2.3.6 Traffic and Revenue Forecasting for HOT LanesThe Role of Modeling in developing Priced Managed Lane projectsPriced managed lanes share some aspects of both HOV lanes and toll roads. Like HOV lanes, they provide priority treatment for high-occupant vehicles. Like tolled roads, they provide premium service for paying motorists. One of the unique aspects of planning for priced managed lanes is that planners must forecast demand levels for both high-occupant and single-occupant vehicles that buy in under a variety of pricing and occupancy requirement scenarios. This exercise serves a dual purpose: First, it allows to the project sponsor to determine the combination of pricing and occupancy requirements that maximizes transportation benefits for all motorists traveling in the priced managed lane corridor. Second, it allows the project sponsor to forecast revenue streams and then evaluate financing approaches. Forecasting demand on the priced managed lane corridor is accomplished by using a travel demand forecasting model. Travel demand models are mathematical tools that estimate roadway and transit travel based on projected population levels, land use trends, and expected roadway and transit characteristics such as cost and travel time. A travel demand model will forecast the level of demand for the toll facility, the impacts of tolling and pricing on corridor and regional travel, and the impacts of tolling on different groups of travelers. Forecasting travel demand for priced managed lanes is challenging because traditional travel models use simplified representations of pricing and have limited capabilities for predicting how travelers would change mode, route, departure time, destination, or trip frequency in response to pricing. In addition, forecasting demand for priced managed lanes is very sensitive to future conditions, such as land use, population growth, characteristics of alternative road and transit modes, and even macro-economic cycles. The complexity of the forecast is compounded by the sensitivity of demand for priced managed lanes to travel conditions in the general-purpose lane and to the extent to which multiple-occupant vehicle trips are made in the corridor. At a minimum, demand assessments must consider the difference between travel times in the priced managed lanes to those in the general-purpose lanes, because motorists will chose the priced manage lane only if the value of the time savings value exceeds the cost of the toll. They should also consider the value of time savings afforded by the HOT lane, as it is likely that motorists will chose the HOT lane if the time savings value exceeds the out-of-pocket cost required to achieve the savings. The array of factors affecting travel demand for HOT lanes and priced managed lanes is provided in Table 2-2. Desirable Travel Demand Model CharacteristicsHow well the model predicts demand for the priced managed lane and the resulting revenues depends on the structure of the model, how well it is calibrated and validated, and how it is applied to quantify the uncertainty inherent in any forecast of future economic activity. In the case of priced managed lanes, three model structural characteristics are most important: representation of relevant travel choice decisions, representation of travel costs, and representation of travelers’ willingness to pay. Relevant Travel ChoicesThe following first-order choices are the direct or immediate reactions that travelers may have to the presence of a priced managed lane:
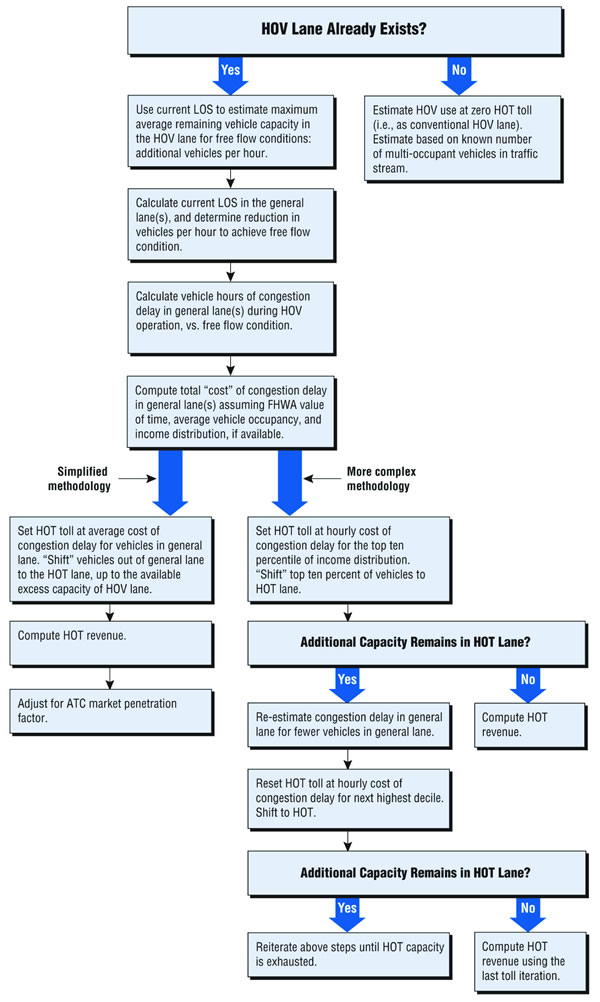
The travel demand model should explicitly capture all of these first-order responses. Longer-term or second-order responses tend to be of a smaller magnitude, but over time they can also be significant. They include changing destinations, trip frequency, and even residential choice, among others. Travel demand models vary in their ability to represent both first-order and second-order responses to priced managed lanes. This effort should be commensurate with the level of analysis sought. A focus on a subset of first-order responses may be sufficient for preliminary feasibility studies, while an investment-grade study requires a better understanding of all choices and how they may vary under different land use, and economic assumptions. Representation of Travel CostsThe cost of using priced managed lanes or alternate routes or modes includes not just the cost of the toll, but also the perceived value of travel time, fuel, vehicle maintenance and depreciation costs. The perception of these costs can also vary, depending on the length of the trip and the type of user. Traditional travel demand models employ relatively simple approach, while more advanced models take into account traveler perceptions based partly on studies conducted with managed lane users.[3] Accurate representation of the out-of-pocket cost of using the priced managed lane is an important property of the travel demand model. The model must be able to distinguish the price differential across types of vehicles, vehicle occupancy, time-of-day, congestion levels, method of payment, entry and exit locations, and other relevant attributes. Of these attributes, accounting for the differences in toll prices inherent in a dynamic, variably priced system are by far the most challenging, due both to the frequency at which tolls change (as frequent as every 5 minutes) and value of the toll. Models that are not designed to handle these types of pricing schemes rarely have the ability to represent them accurately, and therefore require substantial modifications to the trip assignment step, as well as feedback to upper level models such as mode and destination choice. Willingness to PayWillingness to pay refers to the tradeoff that travelers make between time and money, and it is a critical factor for priced managed lane applications. For the price of the toll, travelers are “buying” travel time savings or travel-time reliability or some other trip-related improvement. The value of time (VOT) can be thought of as the “price” of travel-time savings. The value of reliability (VOR) has a similar interpretation, but it measures willingness to pay for increased travel-time reliability for a given trip. Travelers have different VOTs and VORs, partly as a function of measurable personal, household, and trip characteristics (such as income, gender, worker status, trip purpose, etc.), and partly as a function of situational variables and other attributes that the forecaster cannot observe. To reflect the diversity of VOT and VOR, travel demand models subdivide the population into groups with similar VOT and/or VOR. The greater the VOT (or VOR) stratification, the more accurate is the response of the model to tolls. The more advanced travel demand models use continuous VOT functions that reflect both observed and unobserved variability within the travel population. Appropriate market segmentation attributes include trip purpose, time of travel, household income, auto ownership, traveler gender, ownership of a transponder or toll pass, among others. The choice of market stratification variable is typically dictated by data availability; however, at a minimum a model used for managed lane analysis should be segmented by trip purpose, time of day and household income. Data Used in Managed Lane Travel Demand ModelingTravel demand models use a variety of data sources, including household travel surveys, population censuses, origin-destination surveys, and traffic counts, among others. These data, along with assumptions about the mathematical form of the model, are used to establish the parameters of the travel model and to validate its forecast for a base year (i.e., a year for which the traffic volumes in the study corridor are known). As discussed above, a critical parameter for forecasting priced managed lane demand is the travel population’s willingness to pay. Willingness to pay for managed lanes can be measured empirically by observing the behavior of travelers in managed lane corridors, including both those that choose the managed lane and those that prefer to use the alternative routes or modes. These data can consist of observations of individuals’ behavior or they can consist of historical traffic volume, travel time and toll series for all lanes in the managed corridor. Estimates of the elasticity of managed lane demand to travel time and tolls can be derived from the travel model (when disaggregate data are available), or from the historical traffic data (i.e., when only aggregate data are known). However, in many regions priced managed lanes do not exist, thus precluding the use of revealed preference or historical data to develop the travel model. In these cases, modelers use relationships built with data from existing priced managed lane facilities, and/or employ stated preference surveys to gather information about potential users of the new facility. Stated preference surveys attempt to elicit willingness to pay information by asking travelers to state the travel choices they would make when presented with a set of hypothetical scenarios. The scenarios are designed so that a limited set of travel conditions (e.g., travel time, tolls, and reliability) for likely travel choices (e.g., a managed lane and a parallel mixed-flow lane) is varied and respondents are asked to indicate what they would most likely choose under those specified conditions. Under carefully constructed experimental designs and data analysis techniques, these types of surveys elicit willingness to pay information that can in turn inform a travel demand model. Traffic and Revenue Forecasting Methods as Applied to Managed LanesTools and TechniquesVarious methods are available to forecast priced managed lane demand and revenues. Three of these methods are briefly described here: a sketch planning technique, trip-based models, and activity-based models. These tools progressively offer a more rigorous framework for studying the travel time versus cost tradeoff posed by managed lane strategies. It should be noted that use of advanced demand modeling tools alone is not a sufficient condition for preparing “investment-grade” forecasts. These types of forecasts place a premium on identifying sources of uncertainty and their effect on managed lane demand. Sketch-Planning ToolFigure 2-2 depicts a sketch-planning methodology that can be useful in preparing initial feasibility assessments of priced managed lanes and other surface transportation investments. The sketch-planning approach is less rigorous than a trip or activity-based demand model but can still provide helpful information to decision makers. The sketch-planning model incorporates various situations the analyst may face, for example:
Figure 2-2: Priced Managed Lane Revenue Forecasting Process
Trip-Based Travel Demand ModelsFundamentally, a trip-based model forecasts priced managed lane demand in a manner similar to the sketch-planning method outlined above: by trading off travel-time savings against the value of the toll. However, there are important differences between a fully fledged regional model and the sketch-planning tool. Whereas the sketch-planning tool relies on a simple representation of the choice between the priced managed lane and the general-purpose lane, the regional model typically incorporates various choices, including mode choice, carpool formation, destination choice, and possibly time of day choice. Route choice includes both vehicles that are choosing between the priced managed lane and general-purpose lanes, as well as vehicles that are choosing between alternate routes, priced managed lanes, or general-purpose lanes. In cases where the priced managed lane spans multiple access and egress points, the trip-based model will determine whether vehicles change the points at which they enter or exit the corridor in response to the tolls charged (and resulting time savings achieved) on each route segment. A trip-based model can incorporate more complex generalized cost functions than the sketch-planning method. A common alternative to a fully fledged regional model is to study the priced managed lane in isolation, in the same manner that the sketch-planning model does, but using a more complex HOT lane choice function than described above. By ignoring the destination and mode choice dimensions, these corridor-based models can apply greater realism to the representation of value of time over the entire population and travel-time variability, than a regional model is capable of doing. Activity-Based Travel Demand ModelsActivity-based travel models are also regional travel demand models that overcome many of the shortcomings of trip-based models. Activity-based models rely on a more behaviorally correct representation of travel choices, incorporating both long-term effects and short-term effects. Particularly relevant for modeling priced managed lane demand, these models are able to represent VOT and VOR as a unique attribute of each traveler in the population, rather than the average VOT or VOR used in trip-based models. This representation of distributed VOTs lends greater realism to forecasting optimal tolls—that is, the toll that equilibrates priced managed lane demand with the minimum desired level of service. In these models VOT is not just a function of income but also of taste variations and situational effects observed in the travel population. Activity-based models are also better equipped to model carpool formation since they can consider household composition and travel patterns for the entire household in the choice of mode. Another important advantage for modeling variably priced managed lanes is the finer time of day periods typically used by activity-based models, compared to trip-based models or sketch-planning tools. Lessons Learned on Toll Traffic and Revenue ForecastingExperience around the country with toll roads and transit systems indicates that demand projections and revenue forecasts are more likely to err on the high side. Overestimates of revenue potential can result in unexpected public expenditures or even project default. Therefore, it is preferable to build in reasonably conservative assumptions regarding travel demand characteristics and the underlying economic conditions that drive travel demand forecasts. Such assumptions are questioned as a matter of course in the due diligence reviews that private lenders require when they finance infrastructure projects. Similarly rating agencies focus closely on forecasting assumptions when rating project bonds. The reasons for which toll projects fail to achieve the forecasted toll traffic and revenues vary from project to project. Numerous studies have identified and examined several sources of forecast error[4] . According to these sources, the top drivers of toll traffic and revenue forecast failure are:
Three of these forecast failure drivers are particularly applicable to managed lane projects: poorly estimated VOTs, high variability in traffic volumes, and complexity of the toll regime. Poorly estimated VOTs, in particular ignoring the presence of travelers that exhibit very high VOTs is problematic for priced managed lane projects because the optimal toll (and traffic and revenue) are highly dependent on these drivers. Models that use traditional market segmentation as opposed to distributed VOTs tend to under-estimate the number of high VOT users, which are the prime market of managed lane strategies. Traffic volume variability, such as is common in hyper congested corridors where managed lanes are attractive, results in travel-time savings that vary greatly over short periods of time. This type of travel-time variability is often ignored by models that forecast constant travel-time conditions over large (one to three hour) periods of time. Relying on average travel-time conditions over a relatively large time period ignores the travel-time variability that can make managed lanes attractive (or not) on the time scale in which the route choice decision is made. And finally, some priced managed lanes operate under quite complex tolling regimes, because the tolls are varying with the conditions in both the managed lane and the general-purpose lanes, in addition to discounts offered to certain types of users or payment methods. Capturing this level of complexity in a model expected to provide results in minutes or at most hours can be quite challenging, and therefore modelers tend to simplify the tolling regime. Over-simplifications of the tolling regime may lead to forecast failure, since the modeled conditions can be quite different from the actual travel conditions. Given all the uncertainties and simplifications that are present in travel demand forecasting, it is recommended that analysts perform a risk analysis, whereby the impact of key modeling or project assumptions on toll traffic and revenues is examined in detail. Rather than providing a single point estimate of the expected traffic and revenue, a range of estimates is provided along with the assumptions that underpin these estimates. Footnotes [2] The 1990 Clean Air Act Amendments established the clean-fuel vehicle program and the specific attributes of qualifying ILEV vehicles. It also authorized publicly owned ILEVs to use HOV facilities without meeting vehicle-occupancy requirements means to encourage the purchase of low emission vehicle fleets. The Transportation Equity Act for the 21st Century (TEA-21) allowed states to expand this authorization to include individually owned ILEVs. This provision was scheduled to expire, but has been extended in subsequent authorization legislation. Back to reference 2. [3] Transportation Research Board (2012). Improving our Understanding of How Highway Congestion and Pricing Affect Travel Demand. Strategic Highway Research Program, Report No. S2-C04-RR. Back to reference 3. [4] Bain, R. and M. Wilkins. (2002) Infrastructure Finance: Traffic Risk in Start-Up Toll Facilities, Standard & Poor’s, McGraw-Hill International (UK) Ltd., September 2002.; Flyvbjerg, B., M. K. Skamris Holm, and S. L. Buhl. (2005) How (In)accurate Are Demand Forecasts in Public Works Projects: The Case of Transportation, Journal of the American Planning Association, 71 (2), 131-146.; Flyvbjerg, B., M. K. Skamris Holm, and S. L. Buhl. (2006) Inaccuracy in Traffic Forecasts. Transport Reviews, 26 (1), 1-24.; George, C., W. Streeter, and S. Trommer. (2003) Bliss, Heartburn, and Toll Road Forecasts. Project Finance Special Report, Fitch Ratings, November 2003; George, C., S. Trommer, M. McDermott, G. Zurita, C. Lewis, L. Monnier, W. Streeter, E. Lopez, and C. Fuenalida. (2007) Global Toll Road Rating Guidelines. Criteria Report, Fitch Ratings, March 2007. Back to reference 4. | |||
|
United States Department of Transportation - Federal Highway Administration |
||