Priced Managed Lane Guide
Appendix: Priced Managed Lane Profiles
I-680 SB Express Lane
Alameda County, California
| Basic Description: |
|
| Description |
The I-680 SB Express Lane involved the conversion of an existing 14-mile HOV lane to HOT operation. It extends from Highway 84 in Alameda County to Highway 237 in Santa Clara County. The Express Lane has three entry and exit points and is separated from general-purpose lanes by new double-solid striping. Overhead electronic signs indicate entry and exit points and current toll rates. |
| Location |
Southbound on Interstate 680, between State Route 84 (south of the City of Pleasanton) in Alameda County, to State Route 237 in the City of Milpitas, in Santa Clara County, California |
| Project Sponsor |
Sunol Smart Carpool Lane Joint Powers Authority, a partnership of the Alameda County Transportation Commission (Alameda CTC), the Santa Clara Valley Transportation Authority (VTA), and the California Department of Transportation (Caltrans) |
| Project Delivery Method |
Traditional Design-Bid-Build |
| Status |
Operational since September 20, 2010 |
| Number of Lanes |
One |
| Length |
Approximately 14 miles |
| Opening Date |
September 20, 2010 |
| New Construction or Conversion |
HOV-to-HOV/Express Lane conversion |
| Environmental Approvals |
Categorical Exemption/Categorical Exclusion, February 2006 |
| Separation Treatment |
2-foot double-white buffer stripe |
| Number of Points of Access / Egress |
Three (3) ingress and three (3) egress locations in the southbound direction |
| Moveable or Reversible Lanes |
n/a |
| Transit / Park-and-Ride Facilities |
Existing transit service in I-680 corridor is unchanged |
| Other Innovations |
Use of dynamic pricing, including value of time algorithm that compares the difference in travel speed and volumes in the General-Purpose lanes and the Express Lane, and sets the toll accordingly. |
| Stakeholders |
|
| Project Sponsor |
Sunol Smart Carpool Lane Joint Powers Authority. Alameda CTC is the managing agency |
| Private Development Partner |
n/a |
| Transit Partners |
Central Contra Costa Transit Authority (CCCTA), Livermore Amador Valley Transit Authority (LAVTA WHEELS), San Joaquin Regional Transit District (RTD), and Santa Clara Valley Transit Authority (VTA) |
| Enforcement Agency |
California Highway Patrol (CHP) |
| Back-Office Operator |
Electronic Transaction Consultants Corporation (ETCC) |
| Other Local Partners |
Caltrans, VTA, CHP, Bay Area Toll Authority (BATA) |
| Implementation Costs |
|
| Capital Construction Cost |
$26 million (does not include cost for initial construction of HOV lane) |
| Technology Costs |
Approximately $5 million |
| Total Capital Cost |
Approximately $26 million. |
| Project Cost with Financing |
$0 |
| Other Complementary Investments |
Auxiliary lanes, ramp metering, closed-circuit television (CCTV) and traffic sensors |
| Utilization |
|
| ADT Un-tolled |
Approximately 13,000 vehicles per day |
| ADT Tolled |
Approximately 2,000 vehicles per day |
| Total ADT |
Approximately 15,000 vehicles per day |
| Hourly Operational Capacity |
1,850 vph, including HOV users |
| Peaking Characteristics |
 |
| Financial Information |
|
| |
 |
| Type of Financing |
n/a |
| Revenue Source |
Federal, State and Local |
| Sources of Capital Funding |
State- STIP-RIP: $8M Local: $18M |
| Federal Grants and Credit Enhancements |
VPPL: $3.4M; HP21: $2M |
| Financial Status |
Not Available |
| Annual Operating Costs |
Approximately $2.4 million |
| Annual Revenue Generation |
Approximately $1 million |
| Use of Revenues |
System maintenance and operations; roadway maintenance, toll collection and customer service enforcement; and management costs |
| Other Subsidies |
Project funds (available programmed funds) |
| Operational Policies |
|
| Occupancy Requirements |
HOV 2+ travel free with no registration requirement
SOV must pay the dynamic per-mile toll for each trip using a valid FasTrak® transponder (all ETC/open road tolling) |
| Type of Pricing |
Dynamic pricing. Price is based on entry and exit location pair. Pricing algorithm factors “value of time” based on calculated difference in speed and volumes between SB Express Lane and General-Purpose lanes. A motorist will always pay the amount for their trip that was displayed on the Variable Toll Message sign prior to entering the Express Lane. |
| Maximum Price |
$7.50 |
| Minimum Price |
$0.30 |
| Hours of Operation |
15 hours a day, on weekdays, from 5 a.m. to 8 p.m. The lane is “open to all” at night and on weekends. |
| Toll Exempted Vehicles |
Motorcycles, HOV 2+, and certain qualified low-emission (currently CNG) and zero-emission (e.g., Nissan Leaf, Chevy Volt) electric vehicles certified by California Air Resources Board (ARB) with valid California Department of Motor Vehicles white decal go for free. All others must pay the toll. |
| Technology and Enforcement |
|
| Toll Collection Technology |
California FasTrak®, subject to California Title 21 Specification for Automatic Vehicle Identification Equipment |
| Type of Transponder |
Title 21-compliant (currently Sirit, Inc./Federal Signal and TransCore/AmTech manufacture certified Title 21 tags) |
| Existing Regional Toll Operator |
Bay Area Toll Authority (BATA), processes transactions and manages Customer Relations Management (CRM) aspects of the project. ETCC captures transactions under contract to Alameda CTC. |
| Complementary Operations Systems |
Adaptive ramp metering, vehicle detection stations every ½ mile, freeway changeable message signs |
| Operation Center |
I-680 SB Express Lane operations managed by Alameda CTC and consultant staff, and staffed by ETCC maintenance personnel; Regional FasTrak Customer Service Center (RCSC) managed by MTC/BATA; Regional freeway operations managed by Caltrans District 4 Traffic Management Center (TMC) |
| Video Enforcement Authority |
n/a. |
| Occupancy Enforcement Procedures |
Currently, reliant on CHP for routine patrol (i.e., visual observation) although considering other enforcement strategies |
| Fine Levels |
Currently, minimum $381 fine per first offense, HOV violation. |
| Violation Rates |
Estimated to be above 20% of all traffic using the Express Lane |
| Transit Services |
|
| New Transit Services |
None to date |
| New Transit Facilities |
None to date |
| Daily Transit Utilization |
Not Available |
| Project Contact |
|
| |
Kanda “Raj”
I-680 SB Express Lane Operations and Maintenance Manager
(925) 330-8355
Kanda.raj@kimley-horn.com
Steward Ng
ACTC Deputy Director of Programming & Projects
stewarding@alamedactc.org
http://www.680expresslane.org/I-680.asp
|
Notes: Information gathered through readily available web information, and not validated by the Alameda CTC or its representatives.
I-10 ExpressLanes
Los Angeles, California
| Basic Description: |
|
| Description |
The I-10 Metro ExpressLanes is a pilot, one-year demonstration program to convert the 14.2- mile El Monte Busway on I-10 to HOT operation. The ExpressLanes will provide one lane in each direction west of I-710 and will be expanded to two lanes within the existing right-of-way east of I-710. |
| Location |
Los Angeles, California |
| Project Sponsor |
Los Angeles County Metropolitan Transportation Authority (Metro) |
| Project Delivery Method |
DBOM |
| Status |
Under construction |
| Number of Lanes |
1 each direction west of I-710/2 each direction east of I-710 |
| Length |
14.2 miles |
| Opening Date |
February 2013 |
| New Construction or Conversion |
Conversion |
| Environmental Approvals |
Environmental Impact Report/Environmental Assessment (EIR/EA) Approved June 2010 |
| Separation Treatment |
Separate alignment west of I-710/painted buffer east of I-710 |
| Number of Points of Access / Egress |
6 westbound/5 eastbound |
| Moveable or Reversible Lanes |
No |
| Transit / Park-and-Ride Facilities |
3 inline transit stations with park and ride |
| Other Innovations |
Interconnected transit services with I-110; switchable transponder for HOV occupancy declaration |
| Stakeholders |
|
| Project Sponsor |
Metro |
| Private Development Partner |
DBOM team led by Atkinson Construction with ACS and AECOM |
| Transit Partners |
Metro, Foothill Transit, Metrolink |
| Enforcement Agency |
California Highway Patrol |
| Back-Office Operator |
ACS (contractor to Metro) |
| Other Local Partners |
Caltrans, City of Los Angeles |
| Implementation Costs |
|
| Capital Construction Cost |
|
| Technology Costs |
|
| Total Capital Cost |
$79 Million (also includes I-110 corridor) |
| Project Cost with Financing |
|
| Other Complementary Investments |
|
| Utilization |
Under Construction |
| ADT Un-tolled |
|
| ADT Tolled |
|
| Total ADT |
13,206 WB/10,975 EB on existing single HOV lane (2008) |
| Hourly Operational Capacity |
Approximately 1,650 vphpl |
| Peaking Characteristics |
Double AM WB and PM EB peak reflecting change in occupancy thresholds; extended peak duration |
| Financial Information |
|
| Type of Financing |
USDOT CRD Grant, local matching funds |
| Revenue Source |
|
| Sources of Capital Funding |
|
| Federal Grants and Credit Enhancements |
$210 million USDOT CRD grant (includes I-110) |
| Financial Status |
|
| Annual Operating Costs |
|
| Annual Revenue Generation |
|
| Use of Revenues |
|
| Other Subsidies |
|
| Operational Policies |
|
| Occupancy Requirements |
3+ during peak period (6-9AM/3-7PM M-F), 2+ all other times |
| Type of Pricing |
Variable dynamic pricing |
| Maximum Price |
$0.25 per mile |
| Minimum Price |
$1.40 per mile |
| Hours of Operation |
24/7 |
| Toll Exempted Vehicles |
Eligible HOV, transit and other buses, emergency services |
| Technology and Enforcement |
|
| Toll Collection Technology |
RFID transponder with switchable self-declaration capability; LPR capture for secondary/enforcement |
| Type of Transponder |
Sirit Title 21 with switchable capability |
| Existing Regional Toll Operator |
No |
| Complementary Operations Systems |
Caltrans RITS |
| Operation Center |
Contracted with DBOM |
| Video Enforcement Authority |
Yes |
| Occupancy Enforcement Procedures |
All users required to carry transponder, regardless of toll paying; visual enforcement by CHP at toll locations with enforcement beacons indicating transponder declaration status |
| Fine Levels |
$380 minimum for HOV Occupancy Violation per CVC 21655.5(b) |
| Violation Rates |
<7.4% for existing HOV during peak period (3+) |
| Transit Services |
|
| New Transit Services |
Metro SilverLine BRT service interconnecting I-10 and I-110 |
| New Transit Facilities |
Reconstructed El Monte Transit Center; new SilverLine bus maintenance depot; proposed in line station at Patsaouras Plaza |
| Daily Transit Utilization |
|
| Project Contact |
|
| |
Stephanie Wiggins
Executive Officer for ExpressLanes Demonstration Project
Metro
213-922-1023
WIGGINSS@metro.net
http://www.metro.net/projects/expresslanes/ |
I-110 ExpressLanes
Los Angeles, California
| Basic Description: |
|
| Description |
The I-110 ExpressLanes is a pilot, one-year demonstration program converting 10.8 miles of existing HOV on I-110 to HOT operation. These include one lane in each direction south of I-105 and two lanes in each direction on a dedicated elevated facility north of I-105. |
| Location |
Los Angeles, California |
| Project Sponsor |
Los Angeles County Metropolitan Transportation Authority (Metro) |
| Project Delivery Method |
DBOM |
| Status |
Under construction |
| Number of Lanes |
1 each direction south of I-105/2 each direction north of I-105 |
| Length |
10.8 miles |
| Opening Date |
October 2012 |
| New Construction or Conversion |
Conversion |
| Environmental Approvals |
Environmental Impact Report/Environmental Assessment (EIR/EA) Approved June 2010 |
| Separation Treatment |
Elevated section north of 56th St/painted buffer south of 56th St. |
| Number of Points of Access / Egress |
6 westbound/5 eastbound |
| Moveable or Reversible Lanes |
No |
| Transit / Park-and-Ride Facilities |
5 inline transit stations with park and ride |
| Other Innovations |
Interconnected transit services with I-10; switchable transponder for HOV occupancy declaration |
| Stakeholders |
|
| Project Sponsor |
Metro |
| Private Development Partner |
DBOM team led by Atkinson Construction with ACS and AECOM |
| Transit Partners |
Metro, Orange County Transportation Authority (OCTA), City of Los Angeles Department of Transportation, Gardena Bus Lines, Torrance Transit |
| Enforcement Agency |
California Highway Patrol |
| Back-Office Operator |
ACS (contractor to Metro) |
| Other Local Partners |
Caltrans, City of Los Angeles |
| Implementation Costs |
|
| Capital Construction Cost |
|
| Technology Costs |
|
| Total Capital Cost |
$79 Million (also includes I-10 corridor) |
| Project Cost with Financing |
|
| Other Complementary Investments |
|
| Utilization |
Under Construction |
| ADT Un-tolled |
|
| ADT Tolled |
|
| Total ADT |
28,533 NB/27,490 SB in existing dual HOV lane (2008) |
| Hourly Operational Capacity |
Approximately 1,650 vphpl |
| Peaking Characteristics |
Extended peak-period duration |
| Financial Information |
|
| Type of Financing |
USDOT CRD Grant, local matching funds |
| Revenue Source |
|
| Sources of Capital Funding |
|
| Federal Grants and Credit Enhancements |
$210 million USDOT CRD grant (includes I-10) |
| Financial Status |
|
| Annual Operating Costs |
|
| Annual Revenue Generation |
|
| Use of Revenues |
|
| Other Subsidies |
|
| Operational Policies |
|
| Occupancy Requirements |
2+ |
| Type of Pricing |
Variable dynamic pricing |
| Maximum Price |
$0.25 per mile |
| Minimum Price |
$1.40 per mile |
| Hours of Operation |
24/7 |
| Toll Exempted Vehicles |
Eligible HOV, transit and other buses, emergency services |
| Technology and Enforcement |
|
| Toll Collection Technology |
RFID transponder with switchable self-declaration capability; LPR capture for secondary/enforcement |
| Type of Transponder |
Sirit Title 21 with switchable capability |
| Existing Regional Toll Operator |
No |
| Complementary Operations Systems |
Caltrans RITS |
| Operation Center |
Contracted with DBOM |
| Video Enforcement Authority |
Yes |
| Occupancy Enforcement Procedures |
All users required to carry transponder, regardless of toll paying; visual enforcement by CHP at toll locations with enforcement beacons indicating transponder declaration status |
| Fine Levels |
$380 minimum for HOV Occupancy Violation per CVC 21655.5(b) |
| Violation Rates |
<2.3% for existing HOV during peak period |
| Transit Services |
|
| New Transit Services |
Metro SilverLine BRT service interconnecting I-10 and I-110 |
| New Transit Facilities |
Safety and security enhancements at I-110 transit stations |
| Daily Transit Utilization |
|
| Project Contact |
|
| |
Stephanie Wiggins
Executive Officer for ExpressLanes Demonstration Project
Metro
213-922-1023
WIGGINSS@metro.net
http://www.metro.net/projects/expresslanes/ |
SR-91 Express
Orange County, California
| Basic Description: |
|
| Description |
The 91 Express Lanes consists of 40 lane-miles within the median of the Riverside Freeway (SR-91) in Orange County, CA. The eastern terminus of the toll road is the Orange-Riverside County Line and the western terminus is the intersection with the Costa Mesa Freeway (SR-55). Facility was originally constructed for approximately $135 million as a private for-profit investment. In January 2003, a public agency, the Orange County Transportation Authority (OCTA), purchased the operating franchise for $207.5 million. |
| Location |
Orange County, California |
| Project Sponsor |
Orange County Transportation Authority |
| Project Delivery Method |
Public Private Partnership |
| Status |
Operational |
| Number of Lanes |
4 Express Lanes (2 in each direction) |
| Length |
10 miles |
| Opening Date |
December 1995 |
| New Construction or Conversion |
New construction |
| Environmental Approvals |
Completed |
| Separation Treatment |
Barrier separated |
| Number of Points of Access / Egress |
No intermediate access |
| Moveable or Reversible Lanes |
No |
| Transit / Park-and-Ride Facilities |
Yes |
| Other Innovations |
FasTrak transponders and prepaid accounts; customer assistance patrol (dedicated tow trucks); traffic operations center (TOC) |
| Stakeholders |
|
| Project Sponsor |
Orange County Transportation Authority |
| Private Development Partner |
Originally built and constructed by the California Private Transportation Company, whose franchise agreement was bought out in January 2003. |
| Transit Partners |
Orange County Transportation Authority, Riverside Transit Agency |
| Enforcement Agency |
California Highway Patrol |
| Back-Office Operator |
Cofiroute USA |
| Other Local Partners |
Caltrans, cities of Anaheim, Corona, and Riverside |
| Implementation Costs |
|
| Capital Construction Cost |
|
| Technology Costs |
|
| Total Capital Cost |
$135 million (2005 $) |
| Project Cost with Financing |
|
| Other Complementary Investments |
|
| Utilization |
Under Construction |
| ADT Un-tolled |
|
| ADT Tolled |
|
| Total ADT |
32,873 (2011 annual average daily transactions) |
| Hourly Operational Capacity |
3,800 vehicles per direction |
| Peaking Characteristics |
6-8 am westbound; 4-6 pm eastbound |
| Financial Information |
|
| Type of Financing |
Toll Road Revenue Refunding Bonds and Internal Borrowing |
| Revenue Source |
Toll and Non-Toll Revenues |
| Sources of Capital Funding |
Toll and Non-Toll Revenues |
| Federal Grants and Credit Enhancements |
N/A |
| Financial Status |
2.0 Debt Service Coverage Ratio for FY 2011 |
| Annual Operating Costs |
$22,381,682 (thru June 30, 2011) |
| Annual Revenue Generation |
$41,245,590 (thru June 30, 2011) – Excluding Interest |
| Use of Revenues |
Management and operational services;
Debt Service
Capital Expenditures
Administrative overhead;
Other operating expenses;
Insurance claims and premiums;
Professional services;
General and administrative;
Depreciation and amortization;
Interest expense |
| Other Subsidies |
N/A |
| Operational Policies |
|
| Occupancy Requirements |
None |
| Type of Pricing |
Variable tolls by time of day |
| Maximum Price |
$9.75 |
| Minimum Price |
$1.30 |
| Hours of Operation |
24/7 |
| Toll Exempted Vehicles |
Account holders with 3 or more people traveling in their vehicle travel toll-free except Eastbound, Monday through Friday from 4-6 pm. During this peak time carpools of three or more receive a 50% discount on the posted toll. Special Access Accounts are available for customers who always drive with three or more people in their vehicle, drive a motorcycle, a zero-emission vehicle, or have a disabled veteran or disabled person license place issued by the Department of Motor Vehicles. |
| Technology and Enforcement |
|
| Toll Collection Technology |
Toll collection is all-electronic using radio frequency identification (RFID) technology. |
| Type of Transponder |
FasTrak |
| Existing Regional Toll Operator |
Cofiroute USA |
| Complementary Operations Systems |
Yes |
| Operation Center |
Yes |
| Video Enforcement Authority |
Yes |
| Occupancy Enforcement Procedures |
The toll road is a limited-access, open road facility with two lanes in each direction. A third lane in each direction is provided at the toll plazas for identification of high-occupancy vehicles. Access is restricted to the east and west ends of the road and controlled by 3 feet tall, yellow delineators (channelizers) spaced 12 feet apart. There is one toll collection point (toll plaza) in each direction located approximately 6 miles from the western terminus. Each customer’s vehicle is required to have a transponder which is read by the toll collection equipment at the toll plaza. In addition, optical character recognition cameras are used for enforcement. |
| Fine Levels |
Each violation is assessed a $25 processing fee in addition to the amount of the toll. If you fail to respond to the first Notice of Toll Evasion, a second Notice will be mailed to you with an additional $30 processing fee. If you fail to respond to these notices, the penalty can escalate to up to $100 for the first violation, $150 for the second violation and up to $200 for each additional violation within one year. |
| Violation Rates |
|
| Transit Services |
|
| New Transit Services |
New inter-county express bus services between Riverside and Orange counties. |
| New Transit Facilities |
|
| Daily Transit Utilization |
15 Daily Express Bus Trips |
| Project Contact |
|
| |
Kirk Avila
91 Express Lanes General Manager
Orange County Transportation Authority
(714) 560-5674
KAvila@octa.net
http://www.91expresslanes.com/ |
I-15 Express Lanes
San Diego, California
| Basic Description: |
|
| Description |
The I-15 Express Lanes is a 20-mile HOT lane facility providing two travel lanes in each direction. It replaces an 8-mile two-lane reversible-flow facility that was converted from HOV operation in 1996 as the United States’ second HOT lane. It was expanded in three segments between 2005 and 2012. It uses skewed, per-mile dynamic pricing. |
| Location |
Interstate 15, between State Route 52 and State Route 78, in the Cities of San Diego and Escondido in San Diego County, CA |
| Project Sponsor |
I-15 Express Lanes were jointly developed and are operated by the San Diego Association of Governments (SANDAG) and the California Department of Transportation (Caltrans), District 11 |
| Project Delivery Method |
Phased project delivery. |
| Status |
Construction completed 2012. Operational as HOV 1988, HOT 1996, HOT with ETC 1998, and Expanded facility open to traffic January 2012. 20-mile, 4-lane concurrent-flow HOT lanes with moveable barrier/center reversible lanes. |
| Number of Lanes |
4 |
| Length |
20 miles |
| Opening Date |
January 2012 (original facility openings in 1988 and 1996/98) |
| New Construction or Conversion |
Both. Original HOV-to-HOT conversion and significant expansion new construction in 2000’s.Conversion of the original 8 mile segment between I-15/SR 163 merge and SR 56. New construction from SR 56 to SR 78 (12 miles) |
| Environmental Approvals |
CEQA Mitigated Negative Declaration / NEPA FONSI (document on Caltrans web site at http://www.dot.ca.gov/dist11/I15managed/I-15/I-15.htm) |
| Separation Treatment |
Barrier-separated southern 16 miles, with moveable center barrier (reversible center lanes); buffer-separated northern segment (4 miles) |
| Number of Points of Access / Egress |
10 northbound ingress from GP lanes; 8 southbound ingress from GP lanes; 5 NB/SB ingress from BRTC/DAR connectors |
| Moveable or Reversible Lanes |
Yes, southern 16 miles |
| Transit / Park-and-Ride Facilities |
Yes, integrated bus rapid transit (BRT) system with four completed and one planned BRT Station/park-and-ride lots having direct-access ramps (DAR) connections to Express Lanes. |
| Other Innovations |
World’s first use of dynamic pricing in tolling application; first HOV-to-HOT conversion (1996); moveable barrier; innovative use of signage integrating travel time and toll rate information with static Guide and Regulatory sign elements (installed under MUTCD Experimentation prior to 2009 Federal MUTCD update); innovative project financing and delivery methods (GARVEE bond, Design-Sequence/Design Build) and Transit innovations (integrated BRTC/DAR system) |
| Stakeholders |
|
| Project Sponsor |
SANDAG/Caltrans |
| Private Development Partner |
n/a |
| Transit Partners |
Metropolitan Transit System (MTS); North County Transit District (NCTD) |
| Enforcement Agency |
California Highway Patrol (CHP) |
| Back-Office Operator |
Currently, TransCore, L.P. |
| Other Local Partners |
Cities of San Diego, Poway, and Escondido |
| Implementation Costs |
|
| Capital Construction Cost |
$1.3 Billion (2009 dollars) |
| Technology Costs |
$27 Million (2009 dollars) for 2nd generation ETC system |
| Total Capital Cost |
$1.3 Billion (2009 dollars), including transit and highway improvements |
| Project Cost with Financing |
$1.3 Billion (only general revenue bonds were sold, no use of toll revenue to repay bonds was considered) |
| Other Complementary Investments |
Transit BRT system enhancements including new vehicles, stations, structured parking facilities, and BRT operational improvements, etc. |
| Utilization |
Note: all utilization data below derived from February 21, 2012 SANDAG FasTrak® Project Management Team agenda report: www.sandag.org/uploads/meetingid/meetingid_3338_14008.pdf |
| ADT Un-tolled |
22,026 |
| ADT Tolled |
5,530 |
| Total ADT |
27,556 |
| Hourly Operational Capacity |
Based upon a February 5, 1999 meeting between SANDAG and Caltrans District 11, it was agreed to use 1,632 passenger vehicles per hour per lane (VPHPL) as the maximum design flow rate for the I-15 Express Lanes. Applying a heavy vehicles adjustment factor of 0.93 results in a maximum design operational capacity of 304 vehicles per six-minute period per direction (for two-lane section) or effectively 3,000 VPH NB and 3,000 VPH SB for the expanded 20-mile, 4-lane Express Lanes facility. |
| Peaking Characteristics |
Need to request this data from Chris (no longer included in PMT reports) |
| Financial Information |
|
| Type of Financing |
TransNet (local, ½-cent sales tax): $241 Million; GARVEE bonds: $197 Million; California Voter Initiative Proposition 42 Corridor Mobility Improvement Account: $350 Million. |
| Revenue Source |
Other sources include CMAQ, TCRP, RSTP, local sources (tolls and fines). |
| Sources of Capital Funding |
Sales Tax, GARVEE bonds, CMIA bonds |
| Federal Grants and Credit Enhancements |
CMAQ, TCRP, RSTP. |
| Financial Status |
Project is completed |
| Annual Operating Costs |
Approximately $4.4 million [16]
|
| Annual Revenue Generation |
Approximately $4.4 million |
| Use of Revenues |
SANDAG Salaries, Benefits and Indirect Expenses: $135,053;
Other Direct Costs: $350,050; Professional/Contracted Services, i.e., TransCore System Operations and Maintenance: $2,854,042;
Materials and Equipment: $230,0001 |
| Other Subsidies |
Transit Subsidy: $800,0001 |
| Operational Policies |
|
| Occupancy Requirements |
HOV 2+ travel free with no registration requirement
SOV must pay the dynamic per-mile toll for each trip using a valid FasTrak® transponder (all ETC/open road tolling) |
| Type of Pricing |
Dynamic, skewed per-mile tolls (i.e., price varies by entrance location and is a rate per mile multiplied by the distance of travel for that trip). A motorist will always pay the amount for their trip that was displayed (or inferred) on the Variable Toll Message sign prior to entering the Express Lanes. Rates vary as often as every six minutes, a variable that is configurable (but has not changed since the initial facility conversion to dynamic pricing in 1998) |
| Maximum Price |
Currently, $8.00, policy maximum |
| Minimum Price |
Currently, $0.50, policy minimum toll per trip |
| Hours of Operation |
As of January 2012, the 20-mile facility is 24/7/365 operation |
| Toll Exempted Vehicles |
Motorcycles, HOV 2+, and certain qualified low-emission (currently compressed natural gas [CNG]) and zero-emission (e.g., Nissan Leaf, Chevy Volt) electric vehicles certified by California Air Resources Board with valid California Department of Motor Vehicles white decal go for free. All others must pay the toll. |
| Trucks Allowed? |
Note: Trucks with 3 or more axles and heavy vehicles with Gross Vehicle Weights in excess of 5,000 lbs. are currently prohibited from using the I-15 Express Lanes, although SANDAG is currently studying the possible use of the Express Lanes for heavy-vehicle goods movement during certain times of day |
| Technology and Enforcement |
|
| Toll Collection Technology |
California FasTrak®, subject to California Title 21 Specification for Automatic Vehicle Identification Equipment |
| Type of Transponder |
Title 21-compliant (currently Sirit, Inc./Federal Signal and TransCore/AmTech manufacture certified Title 21 tags) |
| Existing Regional Toll Operator |
SANDAG, directly operated under contract by TransCore. |
| Complementary Operations Systems |
Adaptive ramp metering, vehicle detection stations every ½ mile, freeway changeable message signs, ICM system for arterial/freeway/transit coordination, Regional Transit Management Systems |
| Operation Center |
I-15 FasTrak® operations managed by TransCore, regional freeway operations managed by Caltrans District 11 TMC |
| Video Enforcement Authority |
n/a. SANDAG has installed photo-enforcement cameras at selected tolling points on the I-15 Express Lanes and is currently evaluating violation enforcement strategies |
| Occupancy Enforcement Procedures |
Currently, reliant on CHP for routine patrol (i.e., visual observation) although significant planning for advanced violation enforcement approaches has been studied and planned and SANDAG is field testing solutions before selecting a permanent violation enforcement strategy/approach. |
| Fine Levels |
Currently, minimum $401 fine per first offense, HOV violation in San Diego County. |
| Violation Rates |
Estimated to be between 5-15% of all traffic using the Express Lanes (up to 5,000 vehicles per day) |
| Transit Services |
|
| New Transit Services |
Enhanced BRT system will launch in 2013. Existing/legacy (Premium) Commuter Express routes serving inland north San Diego County since early 1990’s continue to be high performing and attract a large percentage of choice riders. |
| New Transit Facilities |
Four newly constructed bus rapid transit centers were added as a component of the recent expansion of the I-15 Express Lanes facility. Each station has direct-access ramp connectors to the Express Lanes, park-and-ride surface lots and at least three of the lots will also have structured parking added in 2013, and include kiss-and-ride, local bus connections, and other passenger amenities (e.g., real-time information feeds). The Escondido Transit Center will also be served by the I-15 BRT service and is approximately 1 mile from the northernmost DAR ramp at Hale Avenue and includes connection to NCTD’s SPRINTER light-rail transit line serving the SR 78 corridor. |
| Daily Transit Utilization |
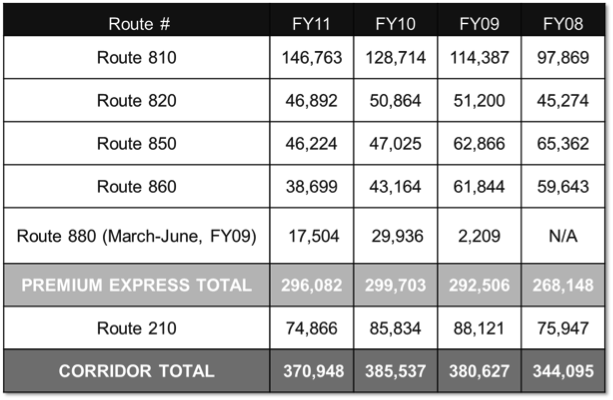
Ridership on I-15 Commuter Express routes have been steadily rising since the late 1990’s and totaled approximately 300,000 one-way passenger trips in FY 2011 (represents approximately 1,200 daily transit trips or roughly 600 unique riders). Additional local express bus routes accounted for another 70-90,000 trips in FY 2009-2011. Important to note these services only operate on weekdays during peak commute hours, and the future BRT service will operate all day, high-speed and high frequency service during peak hours. Below is a pasted in table courtesy of SANDAG showing I-15 corridor express bus utilization for FY 2008 through FY 2011:
 |
| Project Contact |
|
| |
Samuel Johnson, SANDAG, Director of Tolling Programs
(619) 699-6958 or sjo@sandag.org
Gustavo Dallarda, Caltrans District 11, I-15 Corridor Director
(619) 688-6738 or gustavo.dallarda@dot.ca.gov
http://fastrak.511sd.com/san-diego-toll-roads/i-15-express-lanes |
[16] Annual Revenue Generation and Operating Costs derived from SANDAG FY 2013 Annual Budget and Overall Work Program, Smart Mobility Programs and Services, Work Element #33103.00 - I-15 FasTrak® Value Pricing Program, page 128, www.sandag.org/uploads/publicationid/FY13Budget.pdf. Back to reference 16.
SR-37/I-880 Express
Santa Clara County, California
| Basic Description: |
|
| Description |
The express lanes along the SR 237 and I-880 corridor in Santa Clara County extend for 5.5 mile from a point south of Dixon Landing Road on I-880 to North First Street on SR 237. The express lanes opened in March 2012 and involved the conversion of an existing HOV facility. |
| Location |
SR 237: I-880 to North First Street
I-880: SR 237 to Dixon Landing
City of Milpitas, San Jose, Santa Clara County, California |
| Project Sponsor |
Santa Clara Valley Transportation Authority (VTA) |
| Project Delivery Method |
Design-Bid-Build |
| Status |
Opened March 20, 2012 |
| Number of Lanes |
SR 237: 1 Express Lane, 2 General-Purpose Lanes, 1 Auxiliary Lane per direction
I-880: 1 Express Lane, 3 General-Purpose Lanes, 2 Auxiliary Lanes (SB direction)
1 Express Lane, 4 General-Purpose Lanes, 2 Auxiliary Lanes (NB direction) |
| Length |
11 miles
I-880 SB to SR 237 WB – 7 miles
SR 237 EB to I-880 NB – 4 miles |
| Opening Date |
2012 |
| New Construction or Conversion |
Conversion |
| Environmental Approvals |
Categorical Exemption/ Categorical Exclusion (CE/CE) |
| Separation Treatment |
Double-white lines with 2ft buffer on SR 237 and 2ft to 4ft buffer on I-880 |
| Number of Points of Access / Egress |
1 Access / Egress point in each direction |
| Moveable or Reversible Lanes |
N/A |
| Transit / Park-and-Ride Facilities |
N/A |
| Other Innovations |
Conversion of HOV-to-HOV direct connectors to Express connectors
Use of WiMax for ETS Communication Network |
| Stakeholders |
|
| Project Sponsor |
Santa Clara Valley Transportation Authority (VTA) |
| Private Development Partner |
N/A |
| Transit Partners |
Santa Clara Valley Transportation Authority (VTA is the transit provider for light rail, buses and Para-transit in Santa Clara County) |
| Enforcement Agency |
California Highway Patrol (CHP) |
| Back-Office Operator |
Bay Area Toll Authority (BATA) |
| Other Local Partners |
California Department of Transportation (Caltrans) |
| Implementation Costs |
|
| Capital Construction Cost |
$2.7 mil |
| Technology Costs |
$2.9 mil |
| Total Capital Cost |
$5.6 mil |
| Project Cost with Financing |
$11.8 mil (No Financing) |
| Other Complementary Investments |
N/A |
| Utilization |
Part-time operations
I-880 SB to SR 237 WB: 5am to 10am; 3pm to 7pm
SR 237 EB to I-880 NB: 5am to 9am; 3pm to 7pm |
| ADT Un-tolled |
7,300 vehicles (9 hours of operation) |
| ADT Tolled |
1,900 vehicles (9 hours of operation) |
| Total ADT |
9,200 vehicles (9 hours of operation) |
| Hourly Operational Capacity |
1,650 vphpl |
| Peaking Characteristics |
7am – 10am; 4:30pm – 7:00pm |
| Financial Information |
|
| Type of Financing |
Federal, Local |
| Revenue Source |
Toll |
| Sources of Capital Funding |
Federal (ARRA, VPPP), Local |
| Federal Grants and Credit Enhancements |
Federal (ARRA, VPPP) |
| Financial Status |
Funding Complete |
| Annual Operating Costs |
$ 600,000 (Forecast) |
| Annual Revenue Generation |
$150,000 (March 20, 2012 to May 31, 2012) |
| Use of Revenues |
Operations & Maintenance, Enforcement, Improvements in Corridor including transit |
| Other Subsidies |
N/A |
| Operational Policies |
|
| Occupancy Requirements |
HOV 2+ free; single occupant vehicle pays toll |
| Type of Pricing |
Dynamic |
| Maximum Price |
No policy restriction |
| Minimum Price |
$0.30 |
| Hours of Operation |
I-880 SB to SR 237 WB: 5am to 10am; 3pm to 7pm
SR 237 EB to I-880 NB: 5am to 9am; 3pm to 7pm |
| Toll Exempted Vehicles |
All eligible HOV vehicles |
| Technology and Enforcement |
|
| Toll Collection Technology |
Electronic Toll Collection |
| Type of Transponder |
FasTrak – California Transponder |
| Existing Regional Toll Operator |
VTA for SR 237 Express Lanes; BATA for Bay area toll bridges; Golden Gate Bridge Authority(GGBA) for Golden Gate bridge; Alameda County Transportation Commission (ACTC)/ VTA for I-680 Express Lanes |
| Complementary Operations Systems |
Freeway service patrol supported by Caltrans Highway Patrol (CHP) and Caltrans Transportation Management Center |
| Operation Center |
Santa Clara Valley Transportation Authority (VTA) |
| Video Enforcement Authority |
Have authority but not implemented yet |
| Occupancy Enforcement Procedures |
CHP Visual Enforcement |
| Fine Levels |
$481+ |
| Violation Rates |
Not available yet |
| Transit Services |
|
| New Transit Services |
VTA provides existing express bus and regular bus services in Santa Clara County |
| New Transit Facilities |
N/A |
| Daily Transit Utilization |
Express Bus Route 104, 120, Extensive charter bus usage by major employers including Cisco, Google |
| Signage |
2 Dynamic Message Signs |
| Performance Monitoring |
Ongoing |
| Project Contact |
|
| |
Murali Ramanujam
Transportation Engineering Manager
Santa Clara Valley Transportation Authority
Phone: 408-952-8905; murali.ramanujam@vta.org
http://www.vta.org/expresslanes/SR_237_project.html |
I-25 Express lanes
Denver, Colorado
| Basic Description: |
|
| Description |
The Express Lanes includes seven miles of the I-25 HOV lanes, between Downtown Denver and US 36. At this time, solo drivers/toll-paying vehicles are not allowed to use the US 36 HOV lanes until the lanes start to merge to I-25 near Pecos. Anything west of Pecos is for HOV vehicles only. |
| Location |
Denver, Colorado |
| Project Sponsor |
Colorado Department of Transportation, Colorado Tolling Enterprise (now High Performance Transportation Enterprise) |
| Project Delivery Method |
HOV Conversion, developed and funded solely by the Colorado DOT under DBB |
| Status |
Operational |
| Number of Lanes |
2 (reversible) mainline; 1 reversible direct-access ramp to downtown Denver; 1 reversible direct-access ramp to U.S. 36 |
| Length |
7 miles |
| Opening Date |
June 2006 |
| New Construction or Conversion |
Conversion |
| Environmental Approvals |
Categorical Exclusion |
| Separation Treatment |
Concrete Barrier (reversible with gates) |
| Number of Points of Access / Egress |
South Terminus: 5 (1 southbound I-25 mainline, 1 northbound I-25 mainline, 1 northbound at 20th Avenue, 1 southbound at 19th Avenue, 1 bus-only to Denver Union Station)
North Terminus: 5 (1 northbound I-25 mainline, 1 southbound I-25 mainline, 1 westbound U.S. 36 mainline, 1 eastbound from U.S. 36 mainline, 1 reversible at 70th Avenue)
Intermediate: None |
| Moveable or Reversible Lanes |
2 Reversible lanes (mainline), 1 Reversible lanes (on 3 direct-access ramps) |
| Transit / Park-and-Ride Facilities |
Direct-access bus ramp to Denver Union Terminal. No park-n-rides directly on managed lane facility, although many exist in corridor north / west of the managed lanes. |
| Other Innovations |
Toll pricing in peak-period features a price floor equal to the prevailing express bus route fare. In the past six years, the toll in the peak period has increased due to the fare increase. |
| Stakeholders |
|
| Project Sponsor |
Colorado Department of Transportation, Colorado Tolling Enterprise (now High Performance Transportation Enterprise) |
| Private Development Partner |
None; however, one is currently being procured to include back-office operations and extension of the facility north and west |
| Transit Partners |
Regional Transportation District |
| Enforcement Agency |
Colorado Highway Patrol; City and County of Denver Police Department; Adams County Sherriff (all have jurisdiction) |
| Back-Office Operator |
E-470 Public Highway Authority under contract to HPTE |
| Other Local Partners |
Denver Regional Council of Governments, FHWA, Federal Transit Administration (original HOV lanes funded under a full funding grant agreement [FFGA]) |
| Implementation Costs |
|
| Capital Construction Cost |
$7.2 million |
| Technology Costs |
$1.8 million |
| Total Capital Cost |
$9 million |
| Project Cost with Financing |
Financing costs not identified; however, a loan was issued by CDOT to the HPTE, repaid in full in 2010 |
| Other Complementary Investments |
|
| Utilization |
|
| ADT Un-tolled |
8,400 |
| ADT Tolled |
3,900 (3,400 transponder, 500 license plate toll) |
| Total ADT |
11,800 |
| Hourly Operational Capacity |
1600 vphpl |
| Peaking Characteristics |
AM Peak Hour: 400 transponder toll, 50 license plate toll, 600 non-toll
PM Peak Hour: 350 transponder toll, 50 license plate toll, 850 non-toll |
| Financial Information |
|
| Type of Financing |
Federal Grant ($2.8 million); Public Loan from CDOT to HPTE ($6.0 million) |
| Revenue Source |
Colorado Department of Transportation operating funds |
| Sources of Capital Funding |
Unknown |
| Federal Grants and Credit Enhancements |
$2.8 million |
| Financial Status |
Debt is retired; currently profitable |
| Annual Operating Costs |
$1.5 million |
| Annual Revenue Generation |
$2.4 million |
| Use of Revenues |
Snow plowing, State Patrol, Back office, Marketing / outreach, CDOT Staff, Equipment replacement and upgrades, Pavement Maintenance, Courtesy Patrol. Excess revenues are permitted, under state law, to be designated to transportation improvements in the corridor, including transit, vanpool, and carpool services as well as reconstruction, expansion, and extension. |
| Other Subsidies |
None. Self-sufficient |
| Operational Policies |
|
| Occupancy Requirements |
HOV-2+ toll free (vehicles must use declaration lane in toll zone to avoid toll payment) |
| Type of Pricing |
Static Schedule (preset variable pricing by time-of-day) |
| Maximum Price |
$4.00 |
| Minimum Price |
$0.50 |
| Hours of Operation |
Lanes are open to southbound traffic from 5:00 a.m. to 10:00 a.m., and by northbound traffic from 12 noon to 3:00 a.m. |
| Toll Exempted Vehicles |
HOV-2+, buses, ILEV with registration, motorcycles, emergency vehicles |
| Technology and Enforcement |
|
| Toll Collection Technology |
Opening – 2012: Title 21 compliant transponder
2011 – ongoing: ISO 18000 6C compliant transponder
2008 – ongoing: License Plate Recognition |
| Type of Transponder |
Title 21 (2006 – 2012); ISO 18000 6C (2011 – current) |
| Existing Regional Toll Operator |
E-470 Public Highway Authority |
| Complementary Operations Systems |
NA |
| Operation Center |
Corridor monitoring facility (independent TMC operated by CDOT for the I-25 Express Lanes) |
| Video Enforcement Authority |
E-470 Public Highway Authority |
| Occupancy Enforcement Procedures |
Electronic tolling is administered at a single toll collection zone in the 7-mile stretch. At this point HOV and SOV must separate into marked lanes to declare their eligibility. Buses may use either lane. Police personnel monitor the HOV lane only, as all vehicles entering the toll lane will be captured by license plate recognition for non-compliance. |
| Fine Levels |
$5 surcharge for LPT, $15 collection fee for unpaid bills, $25 civil penalty after 3 month, $20 court fee after 4 months |
| Violation Rates |
1% |
| Transit Services |
|
| New Transit Services |
None |
| New Transit Facilities |
None |
| Daily Transit Utilization |
Unknown |
| Project Contact |
|
| |
Kari Grant
Colorado High Performance Transportation Enterprise
Kari.Grant@dot.state.co.us
303-757-9380
http://www.coloradodot.info/travel/tolling/i-25-hov-express-lanes |
I-95 Express Lanes
Miami, Florida
| Basic Description: |
|
| Description |
The 21-mile I-95 express facility converts a single HOV lane into two high-occupancy toll (HOT) lanes in each direction by narrowing the travel lanes from 12' to 11' and narrowing the shoulders. Construction includes some bridge and interchange improvements to maintain continuity of the dual managed lane facility. The project is being constructed in phases. Phase one is open and phase two will be completed in late 2014. |
| Location |
Miami-Dade and Broward Counties, Florida |
| Project Sponsor |
Florida Department of Transportation |
| Project Delivery Method |
Design, Build, Finance |
| Status |
Operational[17] :
Phase 1A Runs northbound on I-95 from just north of I-395/SR-836 to the Golden Glades area just north of NW 151st Street in Miami-Dade County.
Phase 1B runs southbound on I-95 from just south of Miami Gardens Drive/NW 186th Street to just north of I-395/SR-836.
Under Construction[18] :
Phase 2 will extend the express lanes to provide a continuous facility between I-395/SR-836 in Miami-Dade County and Broward Boulevard in Broward County. The project began construction in November 2011 with a tentative completion date of late 2014.
|
| Number of Lanes |
Two in each direction |
| Length |
Currently open: 7.3 miles both directions without the 1 lane Flyover; ~9.5 miles with the Flyover
Completed Project: 22 miles, both directions [19]
|
| Opening Date |
Phase 1A: December, 2008
Phase 1B: January, 2010
Phase 2: Late 2014 (scheduled) |
| New Construction or Conversion |
Conversion of one HOV lane and addition of one additional lane in each direction |
| Environmental Approvals |
Type 2 – Categorical Exclusion
FHWA Concurrence on August 15, 2007 |
| Separation Treatment |
Flexible Plastic Pylons |
| Number of Points of Access / Egress[20] |
Access Egress
Current Phase 1 NB 3 3
After Phase 2 NB 5 5
Current Phase 1 SB 3 1
After Phase 2 NB 5 3 |
| Moveable or Reversible Lanes |
No |
| Transit / Park-and-Ride Facilities |
Yes |
| Other Innovations |
Congestion Pricing, Ridesharing Incentives, Ramp Metering, New BRT Service, All Electronic Tolling |
| Stakeholders |
|
| Project Sponsor |
Florida Department of Transportation (FDOT) |
| Private Development Partner |
Federal Communications Commission CO - MCM JV |
| Transit Partners |
Miami-Dade & Broward County Transit |
| Enforcement Agency |
Toll Violations – Florida’s Turnpike Enterprise
Occupancy Violations - Florida Highway Patrol |
| Back-Office Operator |
Florida’s Turnpike Enterprise |
| Other Local Partners |
The Metropolitan Planning Organizations of Miami-Dade & Broward Counties, Florida’s Turnpike Enterprise, Miami-Dade Expressway Authority and South Florida Commuter Services. |
| Implementation Costs |
|
| Capital Construction Cost |
The Phase 1 construction cost was approximately $132 million.[21] |
| Technology Costs |
Technology including communications, back-office, and ramp metering equipment were in place prior to conversion |
| Total Capital Cost |
$132 million |
| Project Cost with Financing |
NA |
| Other Complementary Investments |
None |
| Utilization |
|
| ADT Un-tolled |
1,000 |
| ADT Tolled |
59,000 |
| Total ADT |
60,000[22] |
| Hourly Operational Capacity |
2700 to 3300 vehicles per direction[23] |
| Peaking Characteristics |
Weekdays – AM Peak (6AM to 9AM); PM Peak (4PM to 7PM) |
| Financial Information |
|
| Type of Financing |
Design, Build, Finance with some of the cost being carried by the contractor.[24] |
| Revenue Source |
$35 million was allocated by the Florida Legislature. The balance of funding will come from future toll revenues and FDOT work program money.[25] |
| Sources of Capital Funding |
Federal Grant, allocation form Florida Legislature, Contractor Financing, Toll Revenue, FDOT Work Program |
| Federal Grants and Credit Enhancements |
The project received $62.9 million from a USDOT UPA grant, of which $19.5 million was for transit.[26] |
| Financial Status |
|
| Annual Operating Costs |
$7.63 Million[27] |
| Annual Revenue Generation |
$14.79 Million – projected FY 2011/12[28] |
| Use of Revenues |
$3.61 Million Transit
$0.03 Million
$0.50 Million Phase 2 build out
$4.00 Million R&R Reserve/Sinking Account
($0.97) Million Escrow |
| Other Subsidies |
None |
| Operational Policies |
|
| Occupancy Requirements |
HOV status requires three or more occupants |
| Type of Pricing |
Dynamic Tolling |
| Maximum Price |
$7.10[29] |
| Minimum Price |
$0.25[30] |
| Hours of Operation |
Continuous |
| Toll Exempted Vehicles |
Registered carpools of three or more passengers, South Florida vanpools and registered hybrid vehicles can drive toll-free, but they must be registered with South Florida Commuter Services. Motorcycles can use the express lanes toll-free and do not need to register.[31] |
| Technology and Enforcement |
|
| Toll Collection Technology |
Transponder |
| Type of Transponder |
TransCore |
| Existing Regional Toll Operator |
SunPass (Florida’s Turnpike Enterprise) |
| Complementary Operations Systems |
All SunPass facilities including Miami-Dade Expressway Facilities, and Tampa Hillsborough Expressway Authority’s Selmon Expressway, Orlando-Orange County Expressway Authority Facilities, and LeeWay Facilities in Lee County, Florida. |
| Operation Center |
Sunguide Transportation Management Center
FDOT District 6 |
| Video Enforcement Authority |
Florida’s Turnpike Enterprise (SunPass) |
| Occupancy Enforcement Procedures |
Window Placard for exempt vehicles – Florida Highway Patrol Enforces for Occupancy |
| Fine Levels |
$100 |
| Violation Rates |
Not Available |
| Transit Services |
|
| New Transit Services |
95X - connects various locations in northern Miami-Dade County with various locations downtown.[32]
Route 195 (Dade-Broward Express - Sheridan Street.)[33]
Route 195 (Dade-Broward Express - Broward Boulevard)[34]
Route 107 (Pines Boulevard Express)[35]
|
| New Transit Facilities |
Addition of 535 parking spaces to the Golden Glades Park and Ride Lot[36] |
| Daily Transit Utilization |
2937 Riders (based on Jan-Apr 2010)[37] |
| Project Contact |
|
| |
Mr. Rory Santana, P.E., PTOE
rory.santana@dot.state.fl.us.
http://www.95express.com/ |
[17] http://www.95express.com/home/FAQ.shtm - Accessed April 16, 2012 Back to reference 17.
[18] Ibid Back to reference 18.
[19] https://ops.fhwa.dot.gov/freewaymgmt/publications/documents/nrpc0610/workshop_materials/case_studies/miami.pdf, Accessed April 18, 2012 Back to reference 19.
[20] 4/23 email from Rory Santana Back to reference 20.
[21] 95 Express Annual Report (Covering July 1, 2010 through June 30, 2011) Back to reference 21.
[22] Conversation with Rory Santana Back to reference 22.
[23] Based on observed capacities while maintaining stable flow per Rory Santana Back to reference 23.
[24] 95 Express Annual Report (Covering July 1, 2010 through June 30, 2011) Back to reference 24.
[25] Ibid. Back to reference 25.
[26] 95 Express Annual Report (Covering July 1, 2010 through June 30, 2011) Back to reference 26.
[27] FDOT Data Back to reference 27.
[28] FDOT Data Back to reference 28.
[29] 4/23 email from Rory Santana Back to reference 29.
[30] 95 Express Annual Report (Covering July 1, 2010 through June 30, 2011) Back to reference 30.
[31] Conversation with Rory Santana Back to reference 31.
[32] Based on observed capacities while maintaining stable flow per Rory Santana Back to reference 32.
[33] 95 Express Annual Report (Covering July 1, 2010 through June 30, 2011) Back to reference 33.
[34] Ibid. Back to reference 34.
[35] 95 Express Annual Report (Covering July 1, 2010 through June 30, 2011) Back to reference 35.
[36] FDOT Data Back to reference 36.
[37] FDOT Data Back to reference 37.
I-85 Express Lanes
Gwinnett and Dekalb Counties, Georgia
| Basic Description: |
|
| Description |
The I-85 Express Lanes involved the conversion of approximately 16 miles of existing High Occupancy Vehicle (HOV) lanes to HOT lanes (Express Lanes) to help improve mobility and provide reliable trip times through value pricing. Concurrent transit projects implemented, include two new Park-and-Ride lots, and 36 new commuter coaches. |
| Location |
I-85 North, Gwinnett and Dekalb Counties |
| Project Sponsor |
State Road and Tollway Authority , Georgia Department of Transportation |
| Project Delivery Method |
Design, bid, build for civil construction and Design-Build for tolling system |
| Status |
Open to traffic |
| Number of Lanes |
1 lane in each direction |
| Length |
15.5 miles |
| Opening Date |
September 30, 2011 |
| New Construction or Conversion |
Conversion, HOV2+ to HOT3+ |
| Environmental Approvals |
NEPA Environmental Assessment, FONSI |
| Separation Treatment |
Painted buffer separation, double-white lines with discrete entry/exit weave zones |
| Number of Points of Access / Egress |
7 Southbound and 7 Northbound |
| Moveable or Reversible Lanes |
N/A |
| Transit / Park-and-Ride Facilities |
6 Xpress Park-and-Ride lots along the I-85 corridor. As part of project, 2 new Park-and-Ride Lots were added and expansion took place at 2 existing Park-and-Ride Lots for a total of 2,200 new parking spaces. 36 new commuter coaches were added. |
| Other Innovations |
Gantry Control Access enforcement for double-white line violations and use of mobile Automatic License Plate to aid with occupancy enforcement |
| Stakeholders |
|
| Project Sponsor |
State Road and Tollway Authority (SRTA) and Georgia Department of transportation (GDOT) |
| Private Development Partner |
N/A |
| Transit Partners |
Georgia Regional Transportation Authority (GRTA) |
| Enforcement Agency |
Georgia Department of Public Safety |
| Back-Office Operator |
Electronic Toll Collection Corporation |
| Other Local Partners |
Atlanta Regional Commission, Gwinnett County, City of Atlanta, Georgia Institute of Technology, Metropolitan Atlanta Regional Transportation Authority (MARTA) |
| Implementation Costs |
|
| Capital Construction Cost |
$21 million |
| Technology Costs |
$23 million |
| Total Capital Cost |
$60 million |
| Project Cost with Financing |
$60 million |
| Other Complementary Investments |
$122 million in transit projects in the Atlanta region |
| Utilization |
|
| ADT Un-tolled |
In first year of operation, 14-18% |
| ADT Tolled |
In first year of operation, 82-86% |
| Total ADT |
In first year of operation, 18,800 trips |
| Hourly Operational Capacity |
1,800-2,000 vehicle per hours in the Express Lanes |
| Peaking Characteristics |
Longer full corridor trips and higher toll rates in AM, shorter length trips and low toll rates in PM |
| Financial Information |
|
| Type of Financing |
FHWA/RITA grant, FHWA federal program funds, State funds (i.e. motor fuel tax, General Obligation bonds) |
| Revenue Source |
Tolls |
| Sources of Capital Funding |
FHWA/RITA Intelligent Transportation System Operational Test to Mitigate Congestion grant, State funds (i.e. motor fuel tax, General Obligation bonds) |
| Federal Grants and Credit Enhancements |
FHWA/RITA Intelligent Transportation System Operational Test to Mitigate Congestion grant |
| Financial Status |
In first year of operation, TBD |
| Annual Operating Costs |
In first year of operation, TBD |
| Annual Revenue Generation |
In first year of operation, TBD |
| Use of Revenues |
Operation and maintenance, per the Section 166(c) of Title 23, United States Code |
| Other Subsidies |
|
| Operational Policies |
|
| Occupancy Requirements |
HOV3+ |
| Type of Pricing |
Dynamic and distanced based |
| Maximum Price |
In first year of operation and ramp-up phase, $5.00 for 15.5 mile ($0.32/mile) in AM |
| Minimum Price |
$.03 for 3 mile ($0.01/mile) during off-peak and weekends |
| Hours of Operation |
24 hours, 7 days a week |
| Toll Exempted Vehicles |
Registered vehicles only: HOV3+, motorcycles, transit, emergency vehicles, alternative fuel vehicles (AFV) with AFV license plates |
| Technology and Enforcement |
|
| Toll Collection Technology |
All Electronic Tolling, transponders and license plates |
| Type of Transponder |
6c protocol passive sticker transponder and legacy Transcore Super Ego protocol passive sticker transponder |
| Existing Regional Toll Operator |
SRTA |
| Complementary Operations Systems |
N/A |
| Operation Center |
GDOT Traffic Management Center and SRTA Toll Operations Center |
| Video Enforcement Authority |
SRTA |
| Occupancy Enforcement Procedures |
Occupancy enforcement is handled by police officers in the field.
All vehicles must register and use a Peach Pass transponders to use the Express Lanes. Drivers must self-declare their vehicles, via phone or internet, at least 15 minutes prior to using the Express Lanes if they are going to be in non-toll HOV3+ status. This self-declaration allows police officers to use mobile Automatic License Plate Reader systems to identify vehicles registered as non-toll HOV3+. These ALPRs use cameras mounted on police vehicles that “read” license plates of vehicle in the Express Lanes to notify police officers if a passing vehicle is registered as an HOV3+ vehicle. For vehicles identified as being registered HOV3+, the police officer does a visual check and pulls vehicles over that do not have 3 or more occupants and issues an occupancy violation. |
| Fine Levels |
1st offense $75; 2nd offense $100; 3rd offense $150 and 1 point on driver license |
| Violation Rates |
In first year of operation, TBD |
| Transit Services |
|
| New Transit Services |
36 new commuter coaches, 3 new GRTA Xpress routes |
| New Transit Facilities |
2 new Park-and-Ride Lots and expansion at 2 existing Park-and-Ride Lots, total of 2,200 new parking spaces. |
| Daily Transit Utilization |
In first year of operation, TBD |
| Project Contact |
|
| |
Patrick Vu, SRTA, (404) 893-6130, patrickvu@georgiatolls.com
Ben Rabun, GDOT, (404) 631-1008, brabun@dot.ga.gov
http://www.georgiatolls.com/programs/i-85-express-lanes/ |
I-95 Express Toll Lane
Baltimore, Maryland
| Basic Description: |
|
| Description |
The Maryland Transportation Authority (MDTA) is adding eight miles of Express Toll Lanes (ETLs) on the most congested portion of I-95 north of Baltimore City. This 8-mile segment stretches from the I-895 (N) split in east Baltimore City, to north of MD 43 in White Marsh features two ETL lanes in each direction. It is the first segment of what is envisioned as a 30-mile ETL facility. |
| Location |
I-95 Express Toll Lanes (ETLs) just north of Baltimore, MD |
| Project Sponsor |
Maryland Transportation Authority (MDTA) |
| Project Delivery Method |
Design-Bid-Build (DBB) |
| Status |
Under Construction |
| Number of Lanes |
4 GP lanes and 2 ETS Lanes northbound and southbound |
| Length |
Approximately 8 miles |
| Opening Date |
Late 2014 |
| New Construction or Conversion |
New construction along existing alignment |
| Environmental Approvals |
FONSI |
| Separation Treatment |
Positive separation with Concrete Barriers |
| Number of Points of Access / Egress |
Current: Southern termini at I-895, northern termini at MD 43 and north of MD 43. Additional access at I-695 may be added at a later date. |
| Moveable or Reversible Lanes |
No |
| Transit / Park-and-Ride Facilities |
Buses allowed on ETLs |
| Other Innovations |
Emergency turnarounds and barrier opening between GP/ETLs in each direction |
| Stakeholders |
|
| Project Sponsor |
MDTA |
| Private Development Partner |
None |
| Transit Partners |
None |
| Enforcement Agency |
Maryland State Police and MDTA Police |
| Back-Office Operator |
N/A |
| Other Local Partners |
N/A |
| Implementation Costs |
|
| Capital Construction Cost |
$866 million |
| Technology Costs |
$6 million |
| Total Capital Cost |
$1.03 billion |
| Project Cost with Financing |
TBD. MDTA bonds are generally not issued for individual projects. Financing cost (including interest on bonds) will depend upon ultimate mix of proceeds used from different bond issuances. |
| Other Complementary Investments |
N/A |
| Utilization |
|
| ADT Un-tolled |
194,500 vehicles along mainline I-95 (2025) [38] |
| ADT Tolled |
33,000 vehicles along mainline I-95 (2025) [39] |
| Total ADT |
227,500 vehicles along mainline I-95 (2025) 2 |
| Hourly Operational Capacity |
23,220 vehicles along mainline I-95 – GP & ETLs (2025) 2 |
| Peaking Characteristics |
Commuter - Morning (6-9am) and Evening (3-6pm) rush |
| Financial Information |
|
| Type of Financing |
Funded by the MDTA using MDTA issued toll revenue bonds and cash contributions |
| Revenue Source |
MDTA system toll revenues |
| Sources of Capital Funding |
MDTA system wide toll revenue backed bond proceeds and cash contributions |
| Federal Grants and Credit Enhancements |
N/A |
| Financial Status |
See below |
| Annual Operating Costs |
Varies: in current 6 year capital program period (FY 2012 through FY 2017) figures vary from $0.6 million in FY 2012 to estimated $4.00 million in FY 2017 |
| Annual Revenue Generation |
Varies: in current 6 year capital program period (FY 2012 through FY 2017) figures vary from $2.0 million in FY 2015 to estimated $3.55 million in FY 2017.
Notes:
Additional traffic and revenue forecasts to be performed prior to setting toll rates and opening of project in FY 15.
Revenues in initial years ramp up gradually.
Project is not financed on a stand-alone basis – project is financed on a system wide basis – all MDTA revenues and costs are consolidated. |
| Use of Revenues |
Revenues from all MDTA projects are consolidated pledged for use in repayment of MDTA system bonds and are used for operating and capital expenses and debt service payments. Projects are not financed on a stand-alone basis – project is financed on a system wide basis – all MDTA revenues and costs are consolidated. |
| Other Subsidies |
N/A |
| Operational Policies |
|
| Occupancy Requirements |
None |
| Type of Pricing |
Variable/Time of Day |
| Maximum Price |
TBD |
| Minimum Price |
TBD |
| Hours of Operation |
24/7 |
| Toll Exempted Vehicles |
Limited exemptions per MDTA Trust Agreement; examples: emergency responders, state owned vehicles. |
| Technology and Enforcement |
|
| Toll Collection Technology |
Transponder or video toll |
| Type of Transponder |
EZ-Pass |
| Existing Regional Toll Operator |
MDTA |
| Complementary Operations Systems |
N/A |
| Operation Center |
AOC North |
| Video Enforcement Authority |
MDTA |
| Occupancy Enforcement Procedures |
None |
| Fine Levels |
TBD |
| Violation Rates |
TBD |
| Transit Services |
|
| New Transit Services |
Working w/ Maryland Transit Administration to provide improved express bus service |
| New Transit Facilities |
No |
| Daily Transit Utilization |
TBD |
| Project Contact |
|
| |
David A. LaBella, P.E. (410-931-0808)
http://i-95expresstolllanes.com/ |
[38] ADT figures are from a 2006 traffic study. These figures may differ from more recent Traffic and Revenue Forecasts. Back to reference 38.
[39] Ibid. Back to reference 39.
I-35W MnPass
Minneapolis, Minnesota
| Basic Description: |
|
| Description |
The I-35W MnPASS is a 16-mile HOT facility providing one lane in each direction. It includes six miles of converted HOV lanes, six miles of new HOT lanes developed along with Crosstown Commons reconstruction, two miles of new construction NB, and two miles of priced dynamic shoulder lanes, which are the first of their kind to operate in the United States. |
| Location |
Minneapolis, Minnesota and southern suburbs in Hennepin and Scott Counties |
| Project Sponsor |
Minnesota Department of Transportation |
| Project Delivery Method |
Design-Build and Design-Bid-Build |
| Status |
Open since 2009 |
| Number of Lanes |
Northbound: 14 miles of single lane directional; 2 miles of northbound priced dynamic shoulder lanes
Southbound: 11 miles of single lane directional |
| Length |
Total length is 16 miles |
| Opening Date |
September, 2009 |
| New Construction or Conversion |
6 miles of converted HOV lanes in both directions, 6 miles of new HOT lanes developed along with Crosstown Commons reconstruction, 2 miles of new construction NB, 2 mile of priced dynamic shoulder lanes |
| Environmental Approvals |
Environmental Assessment |
| Separation Treatment |
Single-lane directional sections are separated with two foot double-white stripe buffer. It is always illegal to cross a double-white stripe buffer. However, 75% of the distance is open access which is designated with a single skip stripe. |
| Number of Points of Access / Egress |
See above description of separation treatment |
| Moveable or Reversible Lanes |
N/A |
| Transit / Park-and-Ride Facilities |
Two park-and-ride lots existed in the corridor prior to MnPASS conversion. Additionally, one park-and-ride facility was located and developed in the south I-35W corridor with MnPASS. Express bus service was added into downtown Minneapolis. |
| Other Innovations |
Uses fully dynamic pricing, multiple segment pricing, read/write transponders |
| Stakeholders |
|
| Project Sponsor |
Minnesota Department of Transportation |
| Private Development Partner |
Wilbur Smith consortium with SRF Consultants, Cofiroute USA, and Raytheon Corporation |
| Transit Partners |
Metro Transit |
| Enforcement Agency |
State Patrol |
| Back-Office Operator |
Cofiroute USA through Wilbur Smith |
| Other Local Partners |
Many partners were involved in the development of the I-35W UPA project. |
| Implementation Costs |
|
| Capital Construction Cost |
$48 million |
| Technology Costs |
$18 million in sign gantries, tolling infrastructure, freeway management system enhancements and intelligent lane control signals. |
| Total Capital Cost |
$66 million |
| Project Cost with Financing |
|
| Other Complementary Investments |
|
| Utilization |
|
| ADT Un-tolled |
|
| ADT Tolled |
About 4000 vehicles per day |
| Total ADT |
52,000 (South End) to 198,000 (North end near downtown) |
| Hourly Operational Capacity |
In peak period the lane is priced to accommodate about 1500 vehicles per hour in order to ensure a high level of service (50-55 mph) for transit and carpools |
| Peaking Characteristics |
20 percent of the vehicles in peak period are toll-paying MnPASS customers |
| Financial Information |
|
| Type of Financing |
State funds |
| Revenue Source |
|
| Sources of Capital Funding |
|
| Federal Grants and Credit Enhancements |
Urban Partnership Agreement |
| Financial Status |
|
| Annual Operating Costs |
$1.69 million in FY11 |
| Annual Revenue Generation |
$751,300 in FY 11 |
| Use of Revenues |
Operations |
| Other Subsidies |
|
| Operational Policies |
|
| Occupancy Requirements |
HOV 2+ are free and do not require transponder |
| Type of Pricing |
Fully dynamic when facility is priced (peak periods only) |
| Maximum Price |
$8.00 total |
| Minimum Price |
$0.25 per segment |
| Hours of Operation |
6:00 AM to 10:00 AM; 2:00 PM to 7:00 PM |
| Toll Exempted Vehicles |
Transit, HOVs , motorcycles |
| Technology and Enforcement |
|
| Toll Collection Technology |
Read-Write Transponders |
| Type of Transponder |
Raytheon |
| Existing Regional Toll Operator |
Cofiroute USA |
| Complementary Operations Systems |
Freeway Management System including ramp meters, CCTV and dynamic message signs. Managed lanes systems including Intelligent Lane Control Signals (ILCS) |
| Operation Center |
Regional Transportation Management Center |
| Video Enforcement Authority |
Minnesota does not permit video enforcement |
| Occupancy Enforcement Procedures |
Visual enforcement is primary means |
| Fine Levels |
$142 per violation, considered a petty misdemeanor |
| Violation Rates |
Around 5-8 percent of lane users are violators |
| Transit Services |
|
| New Transit Services |
Express transit service levels are extremely good in the corridor. Although no new service was added when the project was developed, transit service is always evolving and being tweaked. |
| New Transit Facilities |
Existing park and rides were enhanced after project was implemented. An online bus station was added at 46th St. as an independent project. |
| Daily Transit Utilization |
There are currently about 9,000 transit trips per day in the corridor. |
| Project Contact |
|
| |
Kenneth R. Buckeye
Value Pricing Program Manager
Minnesota Department of Transportation
http://www.mnpass.org/index%2035w.html |
I-394 MnPass
Minneapolis, Minnesota
| Basic Description: |
|
| Description |
Minnesota implemented I-394 MnPASS by converting the existing high-occupancy vehicle (HOV) lane into the state's first high-occupancy toll (HOT) lane. The lanes, which are dynamically priced, remain free to HOVs and motorcyclists during peak hours, and are free to all users in off-peak periods. The facility provides 8 miles of single lane directional HOT lanes and a 3-mile, two-lane reversible-flow section. |
| Location |
Minneapolis, Minnesota and western suburbs in Hennepin County |
| Project Sponsor |
Minnesota Department of Transportation |
| Project Delivery Method |
Design-build / ITS hybrid project development |
| Status |
Open since 2005 |
| Number of Lanes |
8 miles of single lane directional; 3 miles of double lane reversible |
| Length |
Total length is 11 miles |
| Opening Date |
May, 2005 |
| New Construction or Conversion |
HOV Conversion |
| Environmental Approvals |
Categorical Exclusion |
| Separation Treatment |
Single lane directional sections are separated with two foot double-white stripe buffer. It is always illegal to cross a double-white stripe buffer. Twenty five percent of the distance is open access which is designated with a single skip stripe. Reversible section is separated with Jersey barriers |
| Number of Points of Access / Egress |
Five access points eastbound, six access points westbound |
| Moveable or Reversible Lanes |
Three miles of reversible lanes |
| Transit / Park-and-Ride Facilities |
Three park-and-ride facilities located in the corridor provide express bus service into downtown Minneapolis |
| Other Innovations |
Uses fully dynamic pricing, multiple segment pricing, read/write transponders, enforcement transponder readers for enforcement agencies |
| Stakeholders |
|
| Project Sponsor |
Minnesota Department of Transportation |
| Private Development Partner |
Wilbur Smith consortium with SRF Consultants, Cofiroute USA, and Raytheon Corporation |
| Transit Partners |
Metro Transit |
| Enforcement Agency |
State Patrol and local officials |
| Back-Office Operator |
Cofiroute USA through agreement with Wilbur Smith |
| Other Local Partners |
N/A |
| Implementation Costs |
|
| Capital Construction Cost |
Nominal capital costs for restriping |
| Technology Costs |
$10 million |
| Total Capital Cost |
$10 million |
| Project Cost with Financing |
|
| Other Complementary Investments |
$2 million in 0.75 mile auxiliary lane development to enhance performance in bottleneck area |
| Utilization |
|
| ADT Un-tolled |
|
| ADT Tolled |
About 4000-5000 vehicles per day |
| Total ADT |
78,000 (West end) to 148,000 (East end near downtown) |
| Hourly Operational Capacity |
In peak period the lane is priced to accommodate about 1500 vehicles per hour in order to ensure a high level of service (50-55 mph) for transit and carpools |
| Peaking Characteristics |
20 percent of the vehicles in peak period are toll-paying MnPASS customers |
| Financial Information |
|
| Type of Financing |
State funds |
| Revenue Source |
|
| Sources of Capital Funding |
Initial sources of capital for development were from MnDOT owned parking garage accounts and road construction funds for auxiliary lane |
| Federal Grants and Credit Enhancements |
Value Pricing Pilot Program funds provided $500,000 for planning, outreach and education |
| Financial Status |
Authorizing legislation required capital account to be repaid first. Capital funds will be repaid by FY 2014. |
| Annual Operating Costs |
FY’11: $961,000 |
| Annual Revenue Generation |
FY’11: $1.6 million |
| Use of Revenues |
Operations including utilities, enforcement, customer service |
| Other Subsidies |
$1.5 million to repay capital loan account |
| Operational Policies |
|
| Occupancy Requirements |
HOV 2+ are free and do not require transponder |
| Type of Pricing |
Fully dynamic when facility is priced (peak periods only) |
| Maximum Price |
$8.00 total |
| Minimum Price |
$0.25 per segment |
| Hours of Operation |
6:00 AM to 10:00 AM; 2:00 PM to 7:00 PM |
| Toll Exempted Vehicles |
Transit, HOVs, motorcycles |
| Technology and Enforcement |
|
| Toll Collection Technology |
Read-Write Transponders |
| Type of Transponder |
Raytheon |
| Existing Regional Toll Operator |
Cofiroute USA through Wilbur Smith |
| Complementary Operations Systems |
Freeway Management System including ramp metering, CCTV |
| Operation Center |
Regional Transportation Management Center |
| Video Enforcement Authority |
Minnesota does not permit video enforcement |
| Occupancy Enforcement Procedures |
Visual enforcement is primary means. State troopers are equipped with transponder readers to aid in enforcement. |
| Fine Levels |
$142 per violation, considered a petty misdemeanor |
| Violation Rates |
Around 5-8 percent of lane users are violators |
| Transit Services |
|
| New Transit Services |
Express transit service levels are extremely good in the corridor. Although no new service was added when the project was developed, transit service is always evolving and being tweaked. |
| New Transit Facilities |
Existing park and rides were enhanced after project was implemented. |
| Daily Transit Utilization |
There are currently about 9,500 daily transit riders in the corridor. |
| Project Contact |
|
| |
Kenneth R. Buckeye
Value Pricing Program Manager
Minnesota Department of Transportation
http://www.mnpass.org/index%20394.html |
IH 45 South (Gulf)
Houston, Texas
| Basic Description: |
|
| Description |
The HI 45 South Gulf Freeway HOT lane is a single-lane, 15.5 mile reversible-flow facility. It involved the conversion of an existing HOV lane and opened to tolled operation in February 2012. |
| Location |
Houston, TX |
| Project Sponsor |
Metropolitan Transit Authority of Harris County (METRO) |
| Project Delivery Method |
Design-Build |
| Status |
Open |
| Number of Lanes |
One (reversible) |
| Length |
15.5 miles |
| Opening Date |
February 2012 |
| New Construction or Conversion |
Conversion |
| Environmental Approvals |
Category X |
| Separation Treatment |
Barriers (required due to reversible operation) |
| Number of Points of Access / Egress |
7 including termini |
| Moveable or Reversible Lanes |
Reversible |
| Transit / Park-and-Ride Facilities |
Yes, at interchanges and further out corridor: park-and-ride lots and transit centers |
| Other Innovations |
Direct-access ramps with some transit facilities |
| Stakeholders |
|
| Project Sponsor |
Houston METRO |
| Private Development Partner |
none |
| Transit Partners |
none |
| Enforcement Agency |
Houston METRO police |
| Back-Office Operator |
TransCore |
| Other Local Partners |
TxDOT for interagency agreement to operate on freeway and for routine and long-term pavement and structure maintenance |
| Implementation Costs |
|
| Capital Construction Cost |
|
| Technology Costs |
|
| Total Capital Cost |
|
| Project Cost with Financing |
|
| Other Complementary Investments |
NA |
| Utilization |
|
| ADT Un-tolled (est.) |
|
| ADT Tolled (est.) |
|
| Total ADT (est.) |
|
| Hourly Operational Capacity |
About 1500 vph |
Peaking Characteristics (est.)
Peak hour:
Peak period: |
|
| Financial Information |
|
| Type of Financing |
None, funded by METRO and a federal grant |
| Revenue Source |
NA |
| Sources of Capital Funding |
|
| Federal Grants and Credit Enhancements |
|
| Financial Status |
Funded |
| Annual Operating Costs (est.) |
|
| Annual Revenue Generation (est.) |
|
| Use of Revenues |
Policy is to cover O&M from revenues first. Any excess revenue is split 50/50 between Houston Metro and TxDOT |
| Other Subsidies |
None |
| Operational Policies |
|
| Occupancy Requirements |
2+ HOVs are free |
| Type of Pricing |
Variable |
| Maximum Price |
Authorized up to $10, rarely will exceed $4.50 |
| Minimum Price |
$1.00 |
| Hours of Operation |
5-11am inbound, 1-8 pm outbound, however the HOT lane is closed to tolling 7-8 am and 4-6 pm |
| Toll Exempted Vehicles |
Metro police, EMS, HOVs/motorcycles |
| Technology and Enforcement |
|
| Toll Collection Technology |
ETC |
| Type of Transponder |
Read only, RF sticker |
| Existing Regional Toll Operator |
Yes, HCTRA, but METRO operates tolling for these projects |
| Complementary Operations Systems |
New reversible gates and traffic monitoring capability |
| Operation Center |
Reversible gates are controlled from Houston TransStar regional traffic operation center |
| Video Enforcement Authority |
Yes |
| Occupancy Enforcement Procedures |
Declaration lanes for free users at entrances |
| Fine Levels |
$75-$250 |
| Violation Rates |
Insufficient data available from first two months of operation |
| Transit Services |
|
| New Transit Services |
None implemented in conjunction with this conversion |
| New Transit Facilities |
None implemented with this conversion |
| Daily Transit Utilization |
Number of bus trips daily: |
| Project Contact |
|
| |
Nader Mirjamali
Houston Metro
713-652-4375
nader.mirjamali@ridemetro.org
http://www.ridemetro.org/Services/HOTLanes/45SouthHOT.aspx |
IH 45 N (North Freeway)
Houston, Texas
| Basic Description: |
|
| Description |
The HI 45 North Gulf Freeway HOT lane is a single-lane, 20.6- mile reversible-flow facility. It involves the conversion of an existing HOV lane and opened to tolled operation in September 2012. |
| Location |
Houston, TX |
| Project Sponsor |
Metropolitan Transit Authority of Harris County (METRO) |
| Project Delivery Method |
Design-Build |
| Status |
Under construction |
| Number of Lanes |
One (reversible) |
| Length |
20.6 miles |
| Opening Date (est.) |
September 2012 |
| New Construction or Conversion |
Conversion |
| Environmental Approvals |
Environmental assessment, Category X |
| Separation Treatment |
Barriers (required due to reversible operation) |
| Number of Points of Access / Egress |
11 including termini |
| Moveable or Reversible Lanes |
Reversible |
| Transit / Park-and-Ride Facilities |
Yes, park-and-ride lots and transit centers |
| Other Innovations |
Direct-access ramps with some transit facilities |
| Stakeholders |
|
| Project Sponsor |
Houston METRO |
| Private Development Partner |
none |
| Transit Partners |
none |
| Enforcement Agency |
Houston METRO police |
| Back-Office Operator |
Houston METRO (TransCore under contract) |
| Other Local Partners |
TxDOT for interagency agreement to operate on freeway and for routine and long-term pavement and structure maintenance |
| Implementation Costs |
For tolling and traffic control devices only—-prior reversible lane construction occurred in phases between 1984 and 1998 |
| Capital Construction Cost (est.) |
|
| Technology Costs (est.) |
|
| Total Capital Cost (est.) |
|
| Project Cost with Financing |
NA |
| Other Complementary Investments |
NA |
| Utilization |
|
| ADT Un-tolled (est.) |
|
| ADT Tolled (est.) |
|
| Total ADT (est.) |
|
| Hourly Operational Capacity |
About 1500 vph |
Peaking Characteristics (est.)
Peak hour:
Peak period: |
|
| Financial Information |
|
| Type of Financing |
NA |
| Revenue Source |
NA |
| Sources of Capital Funding |
|
| Federal Grants and Credit Enhancements |
|
| Financial Status |
Funded |
| Annual Operating Costs (est.) |
|
| Annual Revenue Generation (est.) |
NA |
| Use of Revenues |
Policy is to pay O&M cost first from revenues. Any excess revenue is split 50/50 between Houston METRO and TxDOT. |
| Other Subsidies |
NA |
| Operational Policies |
|
| Occupancy Requirements |
2+ use lane for free |
| Type of Pricing |
Variable |
| Maximum Price |
Authorized to $10, rarely will exceed $4.50 |
| Minimum Price |
$1.00 |
| Hours of Operation |
5-11am inbound, 2-8pm outbound |
| Toll Exempted Vehicles |
police, EMS, HOVs/motorcycles |
| Technology and Enforcement |
|
| Toll Collection Technology |
ETC |
| Type of Transponder |
Read only, RF sticker |
| Existing Regional Toll Operator |
Yes, HCTRA, but METRO operates tolling for these projects |
| Complementary Operations Systems |
Will include new reversible gates and traffic monitoring capability |
| Operation Center |
New gates and roadway monitoring is capable of being controlled from the regional traffic operation center |
| Video Enforcement Authority |
Yes |
| Occupancy Enforcement Procedures |
Declaration lanes for free users at entrances |
| Fine Levels |
$75-$250 |
| Violation Rates |
Not open at this time, no violation data available |
| Transit Services |
|
| New Transit Services |
no |
| New Transit Facilities |
no |
| Daily Transit Utilization |
Number of bus trips daily: |
| Project Contact |
|
| |
Nader Mirjamali, Houston Metro
713-652-4375
nader.mirjamali@ridemetro.org
http://www.ridemetro.org/Services/HOTLanes.aspx |
Katy Managed Lanes
Houston, Texas
| Basic Description: |
|
| Description |
The Katy Managed Lanes are a 12-mile HOT facility providing two travel lanes in each direction in the median of I-10 between SH6 and SH 610. The new lanes replaced an existing single-lane reversible-flow HOT lane. It is separated from the general-purpose lanes by pylons. |
| Location |
Houston/Harris County, Texas |
| Project Sponsor |
Texas Department of Transportation |
| Project Delivery Method |
Design-Bid-Build |
| Status |
Operational |
| Number of Lanes |
(2) Two Travel Lanes in Each Direction |
| Length |
12 Miles |
| Opening Date |
October 2008; Began Tolling April 2009 |
| New Construction or Conversion |
New Construction |
| Environmental Approvals |
Final Environmental Impact Statement (FEIS) |
| Separation Treatment |
Flexible delineators (candlesticks) between main lanes |
| Number of Points of Access / Egress |
East Bound - 5 Access Points/ 6 Egress Points; West Bound - 6 Access Points/ 4 Egress Points |
| Moveable or Reversible Lanes |
NONE |
| Transit / Park-and-Ride Facilities |
Addicks Park-and-Ride (West End) and Northwest Transit Center (East End) |
| Other Innovations |
Dynamic Message Signs, Violation Enforcement |
| Stakeholders |
|
| Project Sponsor |
Texas Department of Transportation |
| Private Development Partner |
none |
| Transit Partners |
METRO |
| Enforcement Agency |
Harris County |
| Back-Office Operator |
Harris County Toll Road Authority (HCTRA) |
| Other Local Partners |
Transtar |
| Implementation Costs |
|
| Capital Construction Cost |
$255.4 M (HCTRA’s Contribution to Managed Lanes) |
| Technology Costs |
$10.6 M |
| Total Capital Cost |
$266 M |
| Project Cost with Financing |
NA |
| Other Complementary Investments |
NA |
| Utilization |
|
| ADT Un-tolled |
5,201 vpd |
| ADT Tolled |
8,307 vpd |
| Total ADT |
13,508 vpd |
| Hourly Operational Capacity |
2,200 vehicles per hour per lane |
| Peaking Characteristics |
Weekday Morning Peak Hours (6 am – 8 am) and Weekday Evening Peak Hours (4 pm – 6 pm) |
| Financial Information |
|
| Type of Financing |
Senior Lien Revenue Bonds |
| Revenue Source |
Tolls |
| Sources of Capital Funding |
Senior Lien Revenue Bonds |
| Federal Grants and Credit Enhancements |
NA |
| Financial Status |
Good Standing |
| Annual Operating Costs |
$2.37 M |
| Annual Revenue Generation (est.) |
$8.0 M |
| Use of Revenues |
Operations/Maintenance/Debt Services |
| Other Subsidies |
NA |
| Operational Policies |
|
| Occupancy Requirements |
SOVs and two-person high-occupancy vehicles (HOV 2+) |
| Type of Pricing |
Value Pricing |
| Maximum Price |
$21.00 for 3+ axles and $4.00 for 2-axle vehicles for entire trip (3 tolling points during peak hours.) |
| Minimum Price |
$7.00 for 3+ axles and $1.00 for 2-axle vehicles (3 tolling points during off-peak hours.) |
| Hours of Operation |
24 hours, HOV hours 5 am -11 am and 2 pm -8 pm. |
| Toll Exempted Vehicles |
HOV 2+, METRO Buses, and Motorcycles during HOV hours, Monday through Friday,
5 am – 11 am and 2 pm – 8 pm |
| Technology and Enforcement |
|
| Toll Collection Technology |
Electronic Toll Collection |
| Type of Transponder |
American Trucking Association Dedicated Short Range Communications (DSRC) |
| Existing Regional Toll Operator |
HCTRA |
| Complementary Operations Systems |
None |
| Operation Center |
HCTRA |
| Video Enforcement Authority |
HCTRA |
| Occupancy Enforcement Procedures |
Observation Booths |
| Fine Levels |
Posted Toll Rate + 25% + Administration Fee |
| Violation Rates |
<1% for tolls |
| Transit Services |
|
| New Transit Services |
Existing Only |
| New Transit Facilities |
Existing Only |
| Daily Transit Utilization |
211 Buses Per Day |
| Project Contact |
|
| |
Anil Mirmira, P.E.
Tolling Systems Engineer
P: 713-587-7868
E: anil.mirmira@hctra.org
https://www.hctra.org/katymanagedlanes/ |
US 59 North (Eastex Freeway)
Houston, Texas
| Basic Description: |
|
| Description |
The US 59 North is a 20-mile, single-lane, reversible-flow HOT lane with 9 access points slated to open in November 2012. |
| Location |
Houston, TX |
| Project Sponsor |
Metropolitan Transit Authority of Harris County (METRO) |
| Project Delivery Method |
Design-Build |
| Status |
Under construction |
| Number of Lanes |
One (reversible) expandable to two-way in the future |
| Length |
20 miles |
| Opening Date |
November 2012 estimated |
| New Construction or Conversion |
Conversion |
| Environmental Approvals |
Environmental assessment, Category X |
| Separation Treatment |
Barriers (required due to reversible operation) |
| Number of Points of Access / Egress |
9 including termini |
| Moveable or Reversible Lanes |
Reversible |
| Transit / Park-and-Ride Facilities |
Yes, park-and-ride lots and transit centers |
| Other Innovations |
Direct-access ramps with some transit facilities |
| Stakeholders |
|
| Project Sponsor |
Houston METRO |
| Private Development Partner |
none |
| Transit Partners |
None (METRO is the transit agency) |
| Enforcement Agency |
Houston METRO police |
| Back-Office Operator |
Houston METRO (TransCore under contract) |
| Other Local Partners |
TxDOT for interagency agreement to operate on freeway and for routine and long-term pavement and structure maintenance |
| Implementation Costs |
For tolling system only. Prior construction occurred between 1995 and 2002. |
| Capital Construction Cost |
|
| Technology Costs |
|
| Total Capital Cost |
|
| Project Cost with Financing |
NA |
| Other Complementary Investments |
NA |
| Utilization |
|
| ADT Un-tolled (est.) |
|
| ADT Tolled (est.) |
|
| Total ADT (est.) |
|
| Hourly Operational Capacity |
About 1500 vph |
Peaking Characteristics (est.)
Peak hour:
Peak period: |
|
| Financial Information |
|
| Type of Financing |
NA |
| Revenue Source |
NA |
| Sources of Capital Funding |
|
| Federal Grants and Credit Enhancements |
|
| Financial Status |
Under construction |
| Annual Operating Costs (est.) |
|
| Annual Revenue Generation (est.) |
|
| Use of Revenues |
Policy is to pay O&M first. Any excess revenue is split 50/50 between Houston Metro and TxDOT |
| Other Subsidies |
None |
| Operational Policies |
|
| Occupancy Requirements |
2+ use express lane for free |
| Type of Pricing |
Variable |
| Maximum Price |
Authorized to $10, rarely will exceed $4.50 |
| Minimum Price |
$1.00 |
| Hours of Operation |
5-11am inbound, 2-8pm outbound |
| Toll Exempted Vehicles |
police, EMS, HOVs/motorcycles |
| Technology and Enforcement |
|
| Toll Collection Technology |
ETC |
| Type of Transponder |
Read only, RF sticker |
| Existing Regional Toll Operator |
Yes, HCTRA, but Metro operates tolling for these projects |
| Complementary Operations Systems |
New gates and roadway monitoring capable of being controlled from the regional traffic operation center |
| Operation Center |
Reversible gates will be controlled from Houston TranStar regional traffic operation center |
| Video Enforcement Authority |
Yes |
| Occupancy Enforcement Procedures |
Declaration lanes at entrances |
| Fine Levels |
$75 to $250 |
| Violation Rates |
Not open for tolling at this time, so no violation data available |
| Transit Services |
|
| New Transit Services |
No |
| New Transit Facilities |
No |
| Daily Transit Utilization |
Number of bus trips daily: |
| Project Contact |
|
| |
Nader Mirjamali
Houston Metro
713-652-4375
nader.mirjamali@ridemetro.org
http://www.ridemetro.org/Services/HOTLanes.aspx |
US 59 South (Southwest Freeway)
Houston, Texas
| Basic Description: |
|
| Description |
US 59 South is a 23.3 mile HOT lane facility. It includes a single reversible lane for 15.3 miles and one concurrent lane in each direction for 8 miles. It opened to service in July 2012 and involved the conversion of an existing HOV facility. |
| Location |
Houston, TX |
| Project Sponsor |
Metropolitan Transit Authority of Harris County (METRO) |
| Project Delivery Method |
Design-Build |
| Status |
Under construction |
| Number of Lanes |
One (reversible) for 15.3 miles, concurrent for 8 miles |
| Length |
23.3 miles |
| Opening Date |
July 2012 |
| New Construction or Conversion |
Conversion |
| Environmental Approvals |
Environmental assessment, Category X |
| Separation Treatment |
Barriers (required due to reversible operation) |
| Number of Points of Access / Egress |
13 including termini |
| Moveable or Reversible Lanes |
Mostly reversible, with a segment of concurrent lane design on the outer end |
| Transit / Park-and-Ride Facilities |
Yes, park-and-ride lots and transit centers |
| Other Innovations |
Direct-access ramps with some transit facilities |
| Stakeholders |
|
| Project Sponsor |
Houston METRO |
| Private Development Partner |
none |
| Transit Partners |
none |
| Enforcement Agency |
Houston METRO police |
| Back-Office Operator |
Houston METRO (TransCore under contract) |
| Other Local Partners |
TxDOT for interagency agreement to operate on freeway and for routine and long-term pavement and structure maintenance |
| Implementation Costs |
Does not include initial lane construction which occurred in phases from 1986 through 2010. |
| Capital Construction Cost |
|
| Technology Costs |
|
| Total Capital Cost |
|
| Project Cost with Financing |
NA |
| Other Complementary Investments |
NA |
| Utilization |
|
| ADT Un-tolled (est.) |
|
| ADT Tolled (est.) |
|
| Total ADT (est.) |
|
| Hourly Operational Capacity |
About 1500 vph |
Peaking Characteristics
Peak hour:
Peak period: |
|
| Financial Information |
|
| Type of Financing |
NA |
| Revenue Source |
NA |
| Sources of Capital Funding |
|
| Federal Grants and Credit Enhancements |
|
| Financial Status |
Funded |
| Annual Operating Costs (est.) |
|
| Annual Revenue Generation (est.) |
|
| Use of Revenues |
Policy is to pay O&M first. Any excess revenue is split 50/50 between Houston METRO and TxDOT. |
| Other Subsidies |
None |
| Operational Policies |
|
| Occupancy Requirements |
2+ use lane for free |
| Type of Pricing |
Variable |
| Maximum Price |
Authorized up to $10, rarely will exceed $4.50 |
| Minimum Price |
$1.00 |
| Hours of Operation |
5-11am inbound, 2-8pm outbound |
| Toll Exempted Vehicles |
police, EMS, HOVs/motorcycles |
| Technology and Enforcement |
|
| Toll Collection Technology |
ETC |
| Type of Transponder |
Read only, RF sticker |
| Existing Regional Toll Operator |
Yes, HCTRA, but Metro operates tolling for these projects |
| Complementary Operations Systems |
New reversible gates and traffic monitoring capable of being controlled from the regional traffic operation center |
| Operation Center |
Reversible gates will be controlled from Houston TranStar regional traffic operation center |
| Video Enforcement Authority |
Yes |
| Occupancy Enforcement Procedures |
Declaration lanes for free users at entrances |
| Fine Levels |
$75 to $250 |
| Violation Rates |
Not open for tolling at this time, so no violation data available |
| Transit Services |
|
| New Transit Services |
No |
| New Transit Facilities |
No |
| Daily Transit Utilization |
Number of bus trips daily: |
| Project Contact |
|
| |
Nader Mirjamali
Houston Metro
713-652-4375
nader.mirjamali@ridemetro.org
http://www.ridemetro.org/Services/HOTLanes/59SouthHOT.aspx |
US 290 (Northwest Freeway)
Houston, Texas
Surveyed April 2012
Note: Tolling is not operable at the time of this survey. Some information represents estimates.
| Basic Description: |
|
| Description |
The US 290 HOT lane is a 14-mile, single lane, reversible-flow facility scheduled to open in the fall of 2012. |
| Location |
Houston, TX |
| Project Sponsor |
Metropolitan Transit Authority of Harris County (METRO) |
| Project Delivery Method |
Conventional: Design-Bid-Build |
| Status |
Under construction* |
| Number of Lanes |
One (reversible) |
| Length |
14 miles |
| Opening Date |
October 2012 |
| New Construction or Conversion |
Conversion |
| Environmental Approvals |
Environmental Assessment (EA), Cat X |
| Separation Treatment |
Barriers (required due to reversible operation) |
| Number of Points of Access / Egress |
7 including termini |
| Moveable or Reversible Lanes |
Reversible |
| Transit / Park-and-Ride Facilities |
Yes, at interchanges and further out corridor: park-and-ride lots and transit centers |
| Other Innovations |
Direct-access ramps with some transit facilities |
| Stakeholders |
|
| Project Sponsor |
Houston METRO |
| Private Development Partner |
none |
| Transit Partners |
none |
| Enforcement Agency |
Houston METRO police |
| Back-Office Operator |
Houston METRO (TransCore under contract) |
| Other Local Partners |
TxDOT for interagency agreement to operate on freeway and for routine and long-term pavement and structure maintenance |
| Implementation Costs |
For tolling and traffic control devices only—-prior reversible lane construction occurred between 1980 and 1986 |
| Capital Construction Cost |
|
| Technology Costs |
|
| Total Capital Cost |
|
| Project Cost with Financing |
NA |
| Other Complementary Investments |
NA |
| Utilization |
|
| ADT Un-tolled (est.) |
|
| ADT Tolled (est.) |
|
| Total ADT (est.) |
|
| Hourly Operational Capacity |
About 1500 vph |
Peaking Characteristics (est.)
Peak hour:
Peak period: |
|
| Financial Information |
|
| Type of Financing |
NA |
| Revenue Source |
NA |
| Sources of Capital Funding |
|
| Federal Grants and Credit Enhancements |
|
| Financial Status |
Funded |
| Annual Operating Costs (est.) |
|
| Annual Revenue Generation (est.) |
|
| Use of Revenues |
Policy is to cover O&M first. Any excess revenue is split 50/50 between Houston METRO and TxDOT |
| Other Subsidies |
None |
| Operational Policies |
|
| Occupancy Requirements |
2+ except 645-800am inbound when requirement is 3+ |
| Type of Pricing |
Variable |
| Maximum Price |
$10.00 authorized but typically $4.50 |
| Minimum Price |
$1.00 |
| Hours of Operation |
5-11 am inbound, 2-8pm outbound |
| Toll Exempted Vehicles |
Police, EMS, HOVs/motorcycles |
| Technology and Enforcement |
|
| Toll Collection Technology |
ETC |
| Type of Transponder |
Read only, RF sticker |
| Existing Regional Toll Operator |
Yes, HCTRA, but Metro operates tolling for these projects |
| Complementary Operations Systems |
New reversible gates and traffic monitoring controlled from a regional traffic operation center |
| Operation Center |
Reversible gates will be controlled from Houston TranStar regional traffic operation center |
| Video Enforcement Authority |
Yes |
| Occupancy Enforcement Procedures |
Declaration lanes at entrances |
| Fine Levels |
$75 to $250 |
| Violation Rates |
Not open for tolling at this time, so no violation data available |
| Transit Services |
|
| New Transit Services |
No |
| New Transit Facilities |
No |
| Daily Transit Utilization |
Number of bus trips daily: |
| Project Contact |
|
| |
Nader Mirjamali, Houston Metro
713-652-4375
nader.mirjamali@ridemetro.org
http://www.ridemetro.org/Services/HOTLanes.aspx |
* Tolling is currently being added to an existing HOV operation. Accordingly, demand and revenue information is estimated and not based on actual performance.
I-15 Express Lanes Utah
Davis, Salt Land and Utah Counties, Utah
| Basic Description: |
|
| Description |
The I-15 Express Lanes provide one HOT lane in each direction across a 40 mile segment of I-15 between Lehi Main Street to 2300 North in Salt Lake City and Parrish Lane in Centerville to Layton Parkway. It will be extended by an additional 44 miles in December 2012. |
| Location |
I-15, Davis, Salt Lake and Utah Counties, Utah, United States |
| Project Sponsor |
Utah Department of Transportation (UDOT) |
| Project Delivery Method |
Design-Build-Maintain |
| Status |
80 lane miles operational; 44 new lane-miles coming on by December 2012 |
| Number of Lanes |
One lane each direction |
| Length |
40 miles |
| Opening Date |
August 23, 2010 |
| New Construction or Conversion |
Conversion of HOV lanes |
| Environmental Approvals |
Cat-EX |
| Separation Treatment |
Two-foot buffer |
| Number of Points of Access / Egress |
41 |
| Moveable or Reversible Lanes |
No |
| Transit / Park-and-Ride Facilities |
None |
| Other Innovations |
Dynamic Pricing; zone pricing (four existing zones both directions: North Davis, Salt Lake, South Valley and North Utah County Zones) |
| Stakeholders |
|
| Project Sponsor |
Utah Department of Transportation |
| Private Development Partner |
N/A |
| Transit Partners |
N/A |
| Enforcement Agency |
Utah Highway Patrol |
| Back-Office Operator |
TransCore and Electronic Transaction Consultants Corp. |
| Other Local Partners |
|
| Implementation Costs |
|
| Capital Construction Cost |
Federal highway funds helped finance the introduction of HOV lanes as part of the I-15 reconstruction project and other large projects currently in process (Lehi to Spanish Fork and Layton to Ogden). However, lane-widening costs have been financed mostly with state funds. The state paid $42 million to extend lanes from the Utah County line to Orem and $69 million for lanes from Farmington to Layton. Salt Lake County paid $33 million to widen lanes from 10600 South to the Utah County line. |
| Technology Costs |
The cost to install fiber and traffic monitoring stations (TMS) is incidental to the Express Lanes as fiber and TMS were planned regardless of our venture into electronically collecting tolls and converting the HOV lanes to Express Lanes. |
| Total Capital Cost |
Unknown but at least $150+M |
| Project Cost with Financing |
$16.4M |
| Other Complementary Investments |
The installation of overhead Variable Message signs was also incidental to the Express Lanes but we do utilize them for Express Lane messaging (e.g., Minutes to 10600 South, Express 9, Mainline 11) |
| Utilization |
|
| ADT Un-tolled |
173,400 |
| ADT Tolled |
13,000 |
| Total ADT |
186,400 |
| Hourly Operational Capacity |
1675 vehicles per hour |
| Peaking Characteristics |
See attached graph/monthly report. |
| Financial Information |
|
| Type of Financing |
Federal |
| Revenue Source |
Equity Bonus |
| Sources of Capital Funding |
Toll Revenue |
| Federal Grants and Credit Enhancements |
None |
| Financial Status |
Good standing |
| Annual Operating Costs (est.) |
$600,000 |
| Annual Revenue Generation (est.) |
$500,000 |
| Use of Revenues |
By state law, the toll revenue is used to operate and maintain the lanes. |
| Other Subsidies |
Toll revenue banked during temporarily authorized monthly sticker program – $50/month for unlimited use of Express Lane (September 2006 to August 2010) |
| Operational Policies |
|
| Occupancy Requirements |
Two or more |
| Type of Pricing |
Dynamic |
| Maximum Price |
$4.00 each direction |
| Minimum Price |
$0.25 |
| Hours of Operation |
24 hours a day, 7 days a week |
| Toll Exempted Vehicles |
Motorcycles, Buses, Clean Fuel Stickered vehicles (UDOT performs the qualification for each clean fuel stickered vehicle.) |
| Technology and Enforcement |
|
| Toll Collection Technology |
ISO 18000 6C |
| Type of Transponder |
Switchable on/off (not battery powered) |
| Existing Regional Toll Operator |
UDOT |
| Complementary Operations Systems |
Performance Measurement System (PeMS) |
| Operation Center |
UDOT Traffic Operation Center |
| Video Enforcement Authority |
N/A |
| Occupancy Enforcement Procedures |
Visual |
| Fine Levels |
$92 |
| Violation Rates |
17% during peak hour |
| Transit Services |
|
| New Transit Services |
Unknown |
| New Transit Facilities |
Unknown |
| Daily Transit Utilization |
Unknown |
| Project Contact |
|
| |
John Haigwood
jhaigwood@utah.gov
(801) 887-3738
http://www.udot.utah.gov/expresslanes/ |
I-495 Express Lanes
Fairfax County, Virginia
| Basic Description: |
|
| Description |
The I-495 Express Lanes is a $2.1 billion public-private partnership sponsored by the Virginia Department of Transportation (VDOT) to widen an 11-mile segment of the Capital Beltway in Northern Virginia between the I-95 / I-395 Springfield Interchange and Old Dominion Drive, north of the Dulles Toll Road, providing two new managed lanes in each direction. |
| Location |
Northern Virginia |
| Project Sponsor |
Virginia Department of Transportation |
| Project Delivery Method |
Public Private Partnerships |
| Status |
Under Construction (Scheduled to Open in December 2012) |
| Number of Lanes |
4 (2 in each direction) |
| Length |
14 miles |
| Opening Date |
December 2012 |
| New Construction or Conversion |
Improvements/Conversion |
| Environmental Approvals |
FONSI issued by FHWA |
| Separation Treatment |
Bollards/Barrier |
| Number of Points of Access / Egress |
16 |
| Moveable or Reversible Lanes |
Moveable (2 in each direction) |
| Transit / Park-and-Ride Facilities |
None |
| Other Innovations |
Dynamic tolling |
| Stakeholders |
|
| Project Sponsor |
Virginia Department of Transportation |
| Private Development Partner |
Fluor Transurban (Capital Beltway Express) |
| Transit Partners |
MWAA, WMATA |
| Enforcement Agency |
Virginia Department of Transportation / FHWA |
| Back-Office Operator |
Transurban |
| Other Local Partners |
Local regulatory agencies, Jurisdictions |
| Implementation Costs |
|
| Capital Construction Cost |
$1508 million |
| Technology Costs |
|
| Total Capital Cost |
$1508 million |
| Project Cost with Financing |
$2006 million |
| Other Complementary Investments |
|
| Utilization |
|
| ADT Un-tolled |
Not currently under operations phase |
| ADT Tolled |
Not currently under operations phase |
| Total ADT |
Not currently under operations phase |
| Hourly Operational Capacity |
Min. Avg. Operating Speed Limit of 45mph for 90% of time over 180 Consecutive days during morning and/or evening weekday peak hours needs to be maintained |
| Peaking Characteristics |
— |
| Financial Information |
|
| Type of Financing |
TIFIA, PABs, Private equity, VDOT Contribution |
| Revenue Source |
Toll Revenue from the users |
| Sources of Capital Funding |
TIFIA, PABs, Private equity, VDOT Contribution |
| Federal Grants and Credit Enhancements |
TIFIA |
| Financial Status |
90% of DB cost |
| Annual Operating Costs (est.) |
Not currently under operations phase |
| Annual Revenue Generation (est.) |
Not currently under operations phase |
| Use of Revenues |
O&M, Major Maintenance, distribution to holders of Equity |
| Other Subsidies |
VDOT Contribution of $409M |
| Operational Policies |
|
| Occupancy Requirements |
Min. Avg. Operating Speed Limit of 45mph for 90% of time over 180 Consecutive days during morning and /or evening weekday peak hours |
| Type of Pricing |
Dynamic Pricing based on Congestion Levels |
| Maximum Price |
Not applicable to dynamic pricing regime |
| Minimum Price |
Not applicable to dynamic pricing regime |
| Hours of Operation |
24x7 |
| Toll Exempted Vehicles |
HOV 3+, Emergency Vehicles, Buses and Motorcycles |
| Technology and Enforcement |
|
| Toll Collection Technology |
Electronic Tolling |
| Type of Transponder |
E Flex RFID |
| Existing Regional Toll Operator |
— |
| Complementary Operations Systems |
— |
| Operation Center |
Concessionaire will have a separate TOC to monitor the Traffic with In Service Availability of at least 99.995% |
| Video Enforcement Authority |
License Plate Enforcement Allowed for Toll Violations |
| Occupancy Enforcement Procedures |
Officer in Person |
| Fine Levels |
HOV fines Starts from $500 - $2000 |
| Violation Rates |
Not currently under operations phase |
| Transit Services |
|
| New Transit Services |
MWAA, WMATA and other local transit agencies |
| New Transit Facilities |
None as a part of the project |
| Daily Transit Utilization |
— |
| Project Contact |
|
| |
Larry Cloyed, Project Manager 495 Express Lanes
Virginia Department of Transportation
6363 Walker Lane, Alexandria, VA 22310
571-722-6014
http://www.495expresslanes.com |
SR 167 HOT Lanes
Auburn to Renton, Washington State
| Basic Description: |
|
| Description |
The SR 167 HOT lanes provide one HOT lane in each direction of SR 167 between Renton and Auburn in southern Kings County. The northbound lane, approximately 11 miles in length, begins at 15th Street SW in Auburn and terminates at I-405 in Renton, while the southbound lane, nine miles in length, begins at I-405 and terminates at 15th Street NW. The two general-purpose lanes in each direction remain toll-free and open to all vehicles. |
| Location |
SR 167 (Auburn to Renton, Washington State) |
| Project Sponsor |
Washington State Department of Transportation (WSDOT) |
| Project Delivery Method |
Design-Bid-Build for civil infrastructure (signing, striping etc) and design-build for toll equipment. |
| Status |
Operational |
| Number of Lanes |
Single lane; one northbound and one southbound |
| Length |
Approximately 9 miles |
| Opening Date |
May 3rd, 2008 |
| New Construction or Conversion |
Conversion of existing HOV lanes |
| Environmental Approvals |
Documented CE |
| Separation Treatment |
Striped 2 foot buffer |
| Number of Points of Access / Egress |
10 |
| Moveable or Reversible Lanes |
NA |
| Transit / Park-and-Ride Facilities |
Off corridor park & ride lots for transit and heavy rail |
| Other Innovations |
|
| Stakeholders |
|
| Project Sponsor |
WSDOT |
| Private Development Partner |
NA |
| Transit Partners |
King County Metro and Sound Transit |
| Enforcement Agency |
Washington State Patrol |
| Back-Office Operator |
Currently ETCC; Previously TransCore |
| Other Local Partners |
Cities of Auburn, Kent, & Renton |
| Implementation Costs |
|
| Capital Construction Cost |
$10.2 M |
| Technology Costs |
$ 4.5 M |
| Total Capital Cost |
$18.0 M |
| Project Cost with Financing |
N/A |
| Other Complementary Investments |
|
| Utilization |
|
| ADT Un-tolled |
8,000 (Tue – Thu, March 2012) |
| ADT Tolled |
3,519 trips (Tue – Thu, March 2012) |
| Total ADT |
121,000 (Tue – Thu) |
| Hourly Operational Capacity |
|
| Peaking Characteristics |
Northbound 7 – 8 AM, Southbound 4 – 5 PM |
| Financial Information |
|
| Type of Financing |
N/A |
| Revenue Source |
State and Federally funded |
| Sources of Capital Funding |
Gas Tax & Federal dollars |
| Federal Grants and Credit Enhancements |
VPPP w/Toll credits |
| Financial Status |
Revenue covering operations and maintenance costs in 2012 |
| Annual Operating Costs (est.) |
$843,000 (FY2011) |
| Annual Revenue Generation (est.) |
$743,000 (FY2011) |
| Use of Revenues |
Operations and Maintenance |
| Other Subsidies |
|
| Operational Policies |
|
| Occupancy Requirements |
2+ |
| Type of Pricing |
Dynamic |
| Maximum Price |
$9.00 |
| Minimum Price |
$0.50 |
| Hours of Operation |
5 AM to 7 PM everyday |
| Toll Exempted Vehicles |
Transit, Agency Vanpools, motorcycles and 2+ carpools |
| Technology and Enforcement |
|
| Toll Collection Technology |
RFID, ORT |
| Type of Transponder |
SeGo, 6C |
| Existing Regional Toll Operator |
WSDOT |
| Complementary Operations Systems |
SR 520 Floating Bridge, Tacoma Narrows Bridge |
| Operation Center |
Customer Service Center |
| Video Enforcement Authority |
N/A |
| Occupancy Enforcement Procedures |
WSP and HERO Program |
| Fine Levels |
$124.00 |
| Violation Rates |
Negligible |
| Transit Services |
|
| New Transit Services |
N/A |
| New Transit Facilities |
N/A |
| Daily Transit Utilization |
Average of 10,000 (Sound Transit) |
| Project Contact |
|
| |
Tyler Patterson (WSDOT)
PatterT@WSDOT.WA.GOV <PatterT@wsdot.wa.gov>
206-716-1134
http://www.wsdot.wa.gov/Tolling/SR167HotLanes/default.htm |
|