Office of Operations
21st Century Operations Using 21st Century Technologies

ATDM Program Brief: Active Traffic Management

Contact Information: Operations Feedback at OperationsFeedback@dot.gov.

Download the Printable Version (PDF, 2.5MB)
PDF files can be viewed with the Acrobat® Reader®.

What is Active Transportation and Demand Management (ATDM)?

Graphic.  ATDM cycle: Assess System Performance, Evaluate and Recommend Dynamic Actions, Implement Dynamic Actions, Monitor System, and repeat cycle.

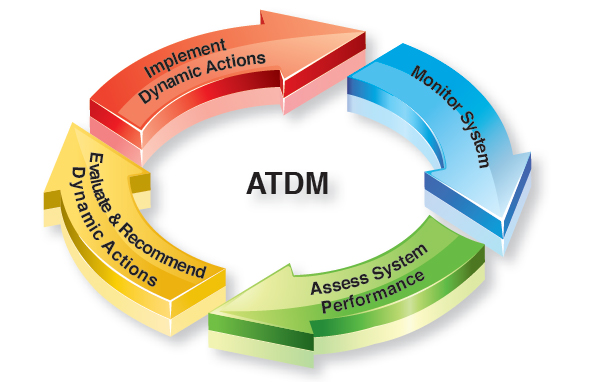
ATDM is the dynamic management, control, and influence of travel demand, traffic demand, and traffic flow of transportation facilities. Through the use of available tools and assets, traffic flow is managed and traveler behavior is influenced in real-time to achieve operational objectives, such as preventing or delaying breakdown conditions, improving safety, promoting sustainable travel modes, reducing emissions, or maximizing system efficiency. Under an ATDM approach, the transportation system is continuously monitored. Using archived data and or/predictive methods, actions are performed in real-time to achieve or maintain system performance. This brief focuses on the active traffic management component of ATDM.

Active management of transportation and demand can include multiple approaches spanning demand management, traffic management, parking management, and efficient utilization of other transportation modes and assets. Some example approaches are included in the table. Those highlighted in yellow are the focus of this brief.
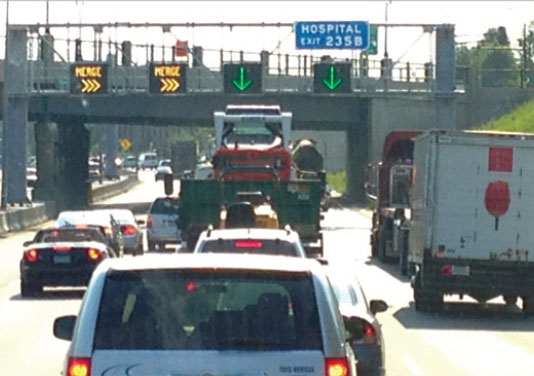
Active Demand Management Active Traffic Management Active Parking Management
Dynamic Ridesharing Dynamic Lane Use/Shoulder Control Dynamically Priced Parking
On-Demand Transit Dynamic Speed Limits Dynamic Parking Reservation
Dynamic Pricing Queue Warning Dynamic Way-Finding
Predictive Traveler Information Adaptive Ramp Metering Dynamic Parking Capacity

What is Active Traffic Management?

Active traffic management (ATM) is the ability to dynamically manage recurrent and non-recurrent congestion based on prevailing and predicted traffic conditions. Focusing on trip reliability, it maximizes the effectiveness and efficiency of the facility. ATM approaches seek to increase throughput and safety through the use of integrated systems with new technology, including the automation of dynamic deployment to optimize performance quickly and without delay that occurs when operators must deploy operational strategies manually. In addition to the approaches listed in the table, ATM includes dynamic routing, dynamic junction control, adaptive signal control, and transit signal priority. These approaches can be described thus:
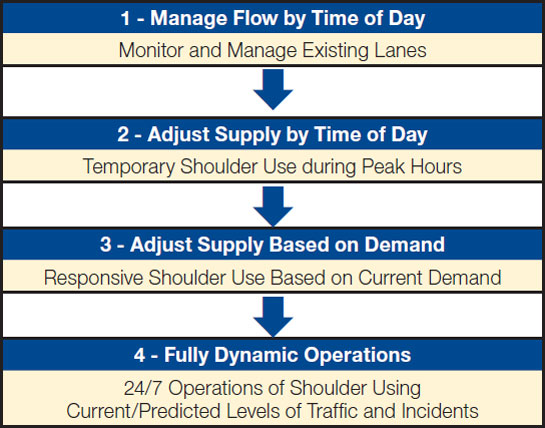
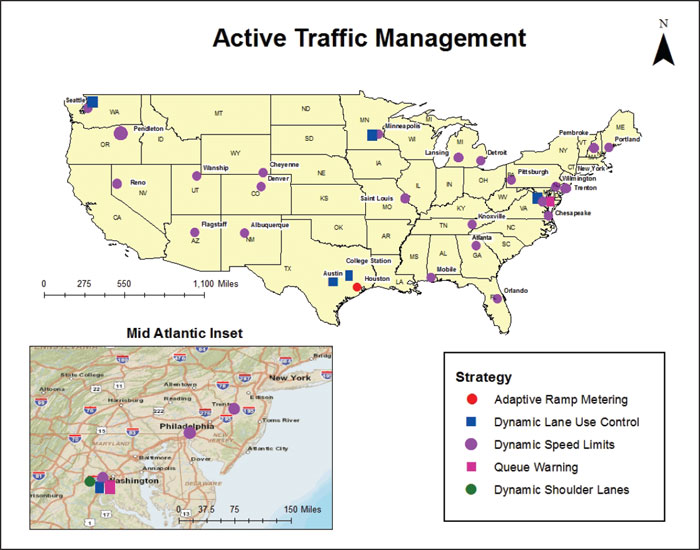
Figure 1. Photo of I-94 Westbound Active Traffic Management.
Figure 1. Minneapolis I-94 Westbound Active Traffic Management –
Source: Texas A&M Transportation Institute.
  • Dynamic lane use/shoulder control: the dynamic opening of a shoulder lane to traffic or dynamic closure of travel lanes on a temporary basis in response to increasing congestion or incidents.
  • Dynamic speed limits: the dynamic change in speed limits based on road, traffic, and weather conditions.
  • Queue warning: the dynamic display of warning signs to alert drivers that congestion and queues are ahead.
  • Adaptive ramp metering: the dynamic adjustment of traffic signals at ramp entrances to proactively manage vehicle flow from local-access roads.
  • Dynamic rerouting: the dynamic provision of alternate route information in response to increasing congestion at bottlenecks/incidents.
  • Dynamic junction control: the provision of lane access based on highway traffic present and merging/diverging traffic to give priority to the facility higher volume to minimize the impact of the merging/diverging movement.
  • Adaptive traffic signal control: the optimization of signal timing plans based on prevailing conditions to increase throughput along an arterial.

What are the key concepts of ATM?

Figure 2. Diagram showing the Active Management Continuum.  1 - Manage Flow by Time of Day = Monitor and Manage Existing Lanes; 2 - Adjust Supply by Time of Day = Temporary Shoulder Use during Peak Hours; 3 - Adjust Supply Based on Demand = Responsive Shoulder Use Based on Current Demand; 4 - Fully Dynamic Operations = 24/7 Operations of Shoulder Using, Current/Predicted Levels of Traffic and Incidents.
Figure 2. Active Management Continuum.

Fundamental concepts of ATM are active management of the capacity and the direct interaction with the driver to encourage them to make tactical decisions in vehicle or driver performance (e.g., stopping, slowing down, changing lanes). The idea is not to simply react to changing conditions but to anticipate them and actively manage the system prior to their occurrence. All agencies and entities operating transportation systems can advance towards a more active management philosophy by making changes that move operations along the active management continuum. An example of temporary shoulder use being applied along the active management continuum shown in Figure 1.

At the lowest level in the continuum, agencies are mostly engaged in monitoring their existing lanes and infrastructure with the shoulders not being used as travel lanes. As agencies move up in the continuum, they could adjust supply on the facility by using shoulders as lanes during peak hours. This level can include such strategies as hard shoulder running, lane control, and improved ramp metering. Further along the active continuum, agencies can open or close shoulder lanes based on demand and can include strategies such as local adaptive ramp metering, responsive lane control, and shoulder use due to an incident or planned special event. The final level in the active management continuum includes 24/7 shoulder operations using current and predictive levels of traffic and incidents. To reach the highest level of active management, an agency needs a combination of technologies, resources, policies, procedures, and public acceptance. Furthermore, an agency may need to work through several iterations along the continuum before reaching the highest level. A similar continuum can be mapped for each of the strategies under ATM. Furthermore, ATM strategies are often complementary and can be more effective when combined to meet multiple objectives at the same time.

Figure 3. Photo of Priced Dynamic Shoulder Lane (PDSL) on the Minnesota interstate.
Figure 3. Priced Dynamic Shoulder Lane (PDSL) on the Minnesota interstate –
Source: Texas A&M Transportation Institute.
Figure 4. Graphic of current ATM deployments in the United States. This map shows where the following active traffic management (ATM) strategies are being deployed across the U.S.: adaptive ramp metering; adaptive traffic signal control; dynamic lane use control; dynamic speed limits; queue warning; and dynamic shoulder lanes.  The most common ATM strategy deployed is dynamic speed limits.
Figure 4. Sample of Current ATM Deployments in the United States.

U.S. Examples of ATM

Figure 4 shows some of the locations across the United States which have implemented some form of ATM on their transportation system. The table on the following page highlights some key ATM projects either in operation or under development. As shown, the various approaches to ATM have been implemented to dynamically manage lane use, speed limits, and ramp access.

Agencies can realize numerous benefits with active traffic management. General operational benefits include:

  • A decrease in primary incidents by alerting drivers to congested conditions and promoting more uniform speeds;
  • A decrease in secondary incidents by alerting drivers to the presence of queues or incidents and proactively managing traffic in and around incidents;
  • Increased throughput by reducing the delay associated with the number of primary and secondary incidents reducing speed differential in traffic flow, and reducing the shockwave effects of excessive breaking;
  • Increased overall capacity by adding shoulder use during congested periods when it is needed most;
  • Overall improvement in speed uniformity during congested periods; and
  • Increased trip reliability by increasing capacity and throughput and reducing incident delay and improving vehicle throughput.
Figure 5. Photo of Seattle I-5 Northbound Active Traffic Management.
Figure 5. Seattle I-5 Northbound Active Traffic Management (termed Smarter Highways by WSDOT) –
Source: Texas A&M Transportation Institute.

Specific identifiers that may indicate whether or not ATM strategies should be implemented and produce desirable benefits include:

  • High traffic volumes;
  • Changes in prevailing conditions;
  • A high prevalence of crashes;
  • Capacity bottlenecks;
  • Adverse weather;
  • Adverse environmental impacts;
  • Variability in trip reliability;
  • Construction impacts;
  • Financial constraints and priorities; and,
  • Limitation in capacity expansion.
Location(s) ATM Strategy(ies) Active Technologies
Mobile County, AL / Flagstaff, AZ / Portland, ME / Truckee River, NV / Pittsburgh, PA / Knoxville, TN / Cheyenne, WY weather-driven dynamic speed limits traffic management center (TMC) control, variable speed limit signs, atmospheric sensors, visibility sensors, pavement conditions sensors, dynamic message signs
Los Angeles, CA / Minneapolis, MN / Portland, OR / Houston, TX adaptive ramp metering roadway sensors, ramp meter signals, TMC algorithms, TMC control
Minneapolis, MN dynamic lane use control, dynamic speed limits, queue warning, adaptive ramp metering roadway sensors, lane control/dynamic speed limit signals, dynamic message signs, TMC algorithms and control
Seattle, WA dynamic lane use control, dynamic speed limits, queue warning, adaptive ramp metering roadway sensors, lane control/dynamic speed limit signals, dynamic message signs, TMC algorithms and control
Northern Virginia dynamic lane use control, dynamic speed limits, queue warning, dynamic shoulder lanes roadway sensors, lane control signs, dynamic speed limit signals, dynamic message signs, TMC algorithms and control
Various adaptive traffic signal control microwave sensors, CCTV, tag readers, central control
Los Angeles dynamic junction control dynamic lane assignment signs, illuminated pavement markers

ATDM Project Informational Briefs

This informational brief is one of the ATDM briefs in the Program category of the FHWA ATDM Briefs Series. ATDM briefs are or will be available in the categories of:

  • ATDM Program Yellow
  • ATDM Planning Purple
  • ATDM Analysis Orange
  • ATDM Design Green
  • ATDM Operations Red

For more information:

U.S. Department of Transportation - Federal Highway Administration

Publication #: FHWA-HOP-13-003

October 2012

Office of Operations