Measuring Border Delay and Crossing Times at the US–Mexico Border
Final Report
Automated Crossing and Wait Time Measurement
CHAPTER 1: BACKGROUND AND OVERVIEW
Background
This project is the culmination of years of planning, assessing, testing, and preparing for implementation of an automated travel time measurement technology system. In 2001, FHWA conducted the task Assessment of Automated Data Collection Technologies for Calculation of Commercial Motor Vehicle Border Crossing Travel Time Delay. That task involved manual wait time measurements on commercial vehicles transiting four northern and three southern border crossings.
Included in that effort was an assessment published in 2002 of vehicle detection technologies that were evaluated as candidates to automate the collection of border delay and crossing time data. There were 22 vehicle-sensing technologies that were initially screened against factors such as availability of appropriate software, volume count flexibility, minimization of privacy invasiveness, ruggedness/all-weather operation, low infrastructure cost, and positive identification capability. To be a candidate for the short list of that study’s trade-off study, a sensing technology had to be able to:
Make positive identification of both inbound and outbound trucks at a matched pair of two points (upstream and downstream in the traffic flow) that corresponded to where data collectors were stationed for manual readings.
Time-stamp each vehicle that was positively identified at its detected location so as to enable travel time calculations.
Operate in all weather conditions found at a (land) border crossing.
Subsequently, 11 of the 22 screened candidate sensing technologies met those three basic criteria and were assessed against the criteria of: geo-location/travel time accuracy, percent of vehicles recorded, requirement for cross-border installation, maturity of technology for application, infrastructure cost, and ability to count every vehicle crossing. A trade-off comparison involving advantages and disadvantages of each and commentary also was included.
Part I – Technology Identification and Selection
FHWA has undertaken several freight performance initiatives aimed at measuring travel times on freight-significant corridors and crossing and delay times at major US land border crossings. For the US–Mexico border, FHWA sought to identify appropriate Intelligent Transportation Systems (ITS) or other commercial technologies that enable border crossing times to be easily and precisely measured. In 2006, FHWA initiated Part I of Measuring Border Delay and Crossing Times at the US–Mexico Border. This project was among the first steps in the current process to automate measurement of crossing times. The objective of the work detailed in the Part I report was to examine technologies that could be used to support automated measurement of border crossing and delay times for US-bound commercial motor vehicles at US–Mexico land Ports of Entry (POEs. (The term POE is used interchangeably with border crossing in this document.) Delay time for commercial motor vehicles at US–Mexico POEs is a key indicator of transportation and international supply-chain performance.
Technology advancements had been developed and adopted by the market over the five years since the 2001 study and the Part I study. For example, Global Positioning System (GPS)-based locating and geo-fencing systems experienced rapid proliferation among motor carriers during that period. Technology candidates were screened for their applicability to automate the crossing time measurement process. In order to measure travel time and the associated delay, the chosen technology needed to be flexible enough to cover the complete trip and be applicable at all POEs. Technologies identified as meeting these criteria were: automated vehicle identification (AVI), automatic license plate recognition (ALPR), vehicle matching, automatic vehicle location (AVL, including GPS), mobile phone location, and inductive loop detectors. The advantages/disadvantages of these technologies were also assessed.
Of these, the three technologies considered the best candidates for the POE application were AVI, GPS, and ALPR. There were six technology variations of AVI identified and discussed. The one considered most appropriate for the intended purpose among the six AVI variations was passive RFID technology, which requires a reader and transponders. Passive RFID was already being used at some southern border crossings. For example, passive RFID was being used at the Bridge of the Americas POE by the U.S. Customs and Border Protection (CBP) for lanes dedicated to trucks participating in CBP’s Free and Secure Trade (FAST) Program and also by the Texas’ Border Safety Inspection Facility (BSIF). FAST expedites processing of cargo through CBP Primary inspection for commercial carriers that have completed background checks and fulfill certain other eligibility requirements. Upon further consideration, the Part I effort narrowed the technology choices for pilot programs to two ‒ passive RFID and GPS. RFID was chosen as the technology for the pilot implementation in Texas. Chapter 4 covers additional details on this technology selection process. The POE chosen for the RFID pilot was the Bridge of the Americas in El Paso, Texas/Juarez, Mexico.
A demonstration of passive RFID transponder (i.e., “tag”) reading was conducted using a portable setup in Austin, Texas. This bench test-level demonstration was conducted to evaluate the functional effectiveness of the system’s tag detection and matching and travel time measurement capabilities prior to implementation in a real-world setting. Within the preceding years, several toll facilities became operational in the Austin area, which put a reasonable population of RFID toll tags (i.e., “TxTags”) on the area roadways. To prove the design concept, RFID antennas were mounted on overpasses. The RFID system successfully read and time-stamped identification (ID) numbers of tags in cars with TxTags under their windshields, passing at freeway speeds, and matched the transponder ID numbers read at the upstream and downstream locations. More details of this testing are found in the Chapter 4 Part I Technology Identification under “Bench Test of RFID Technologies.”
Discussion of Border Wait Times and Crossing Times
While the collective term “travel time” is often used, it is useful to distinguish between the two main types of travel time provided in the prototype web tool. Wait time is defined as “the time it takes, in minutes, for a vehicle to reach the CBP’s primary inspection booth after arriving at the end of the queue.(1)” This queue length is variable and depends on traffic volumes and processing times at each of the inspection facilities throughout the border crossing process. Crossing time has the same beginning point in the flow as wait time, but its terminus is the departure point from the last compound that a vehicle transits in the border crossing process. Typically, that last compound in the crossing process on the US–Mexico border is the State safety inspection facility, past which trucks exit onto the roadway system.
Border wait time is a segment of border crossing time, and such segmentation can be advantageous in determining the locations where delays are originating. As a metric, wait time is of greater significance than crossing time to CBP operations, whereas crossing time is of greater interest to FHWA and private sector stakeholders such as shippers and carriers.
Regarding definition of delay, the following is an excerpt from the Part I Final Report:
“The delay associated with the border crossing…can…be described in different ways. In 2002… a study (was conducted) for the Office of Freight Management and Operations of FHWA titled Evaluation of Travel Time Methods to Support Mobility Performance Monitoring. In that project, border delay was defined as the difference between actual crossing time and low-traffic-volume crossing time. With this definition, the processing time that the inspection agencies need to accomplish their mission was removed from the description of delay. Moreover, the authors mention that the use of free-flow conditions is a standard that is not relevant at border crossings. The following graph describes the differences between the free flow travel time, the optimal crossing time, and the high volume crossing time.”
Figure 1 illustrates these definitions.
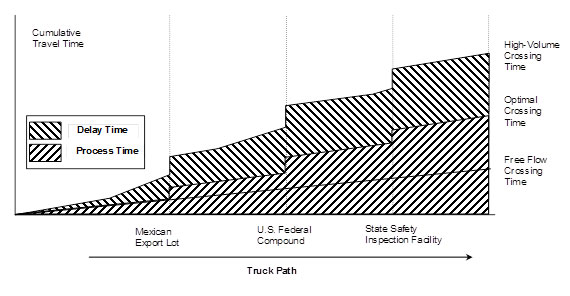
As shown on the graph, the free-flow crossing time would be that where the truck would not have to stop at any time during the border crossing trip. Obviously, this scenario is not realistic and therefore should not be set as a reference. The optimal crossing time is set as the base time, since it represents the case where there are no queues at any of the stops. This optimal crossing time is achieved under very low traffic volume conditions and takes into account the processing time at all inspection facilities. Finally, the high-volume crossing time accounts for all delays caused by high traffic volume that cause lower traffic speeds and queues.
Taking these factors into consideration, it can be concluded that the border crossing associated delay is determined by the difference between the observed crossing time and the optimal crossing time.
In order to have a better estimate of the status of the border crossing time, a similar concept as the travel time index (Tindx) can be used. The Tindx is defined in figure 2:
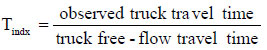
For commercial border crossings, as previously discussed, instead of using free-flow travel time, the crossing time under optimal conditions will be used to define the Border Crossing Time Index.
A very important fact that has to be taken in consideration is that not all trucks go through the same number of inspections. In most cases, a first inspection is enough to check the status of the shipment, the truck, and the driver. In some other instances, extra attention has to be given to a truck, its contents, or the driver. Moreover, most of the largest commercial border crossings have dedicated FAST lanes, where crossing time might be significantly shorter” since FAST expedites processing for commercial carriers who have completed background checks and fulfill certain eligibility requirements.
Therefore the truck population has to be divided into three categories:
- FAST shipments.
- Shipments that go through primary inspection only.
- Shipments that go through secondary inspection.
Border crossing delay and Border Crossing Time Index will have to be estimated for each one of these three categories since all of them have different optimal crossing times. Depending on the technology, a different number of readers will be needed to identify these three types of trips.
In practice, the algorithms developed for crossing time measurement in this project did not measure delay but rather total crossing time (and later, also wait time). FAST lanes were included in the calculation for all lanes, as the more complete segmentation discussed in the following section was not implemented except later for the wait time component.
Part II - Pilot Implementation at BOTA and Pharr-Reynosa
In 2007, FHWA began Part II of Measuring Border Delay and Crossing Times at the US–Mexico Border. For this part of the process toward an optimal solution, FHWA initiated two projects, one of which became the deployment of RFID at the BOTA land border crossing at El Paso and Ciudad Juárez. FHWA’s measure of success for this part of the work was to conduct it in a manner that would lead to adoption at the end of the process. A key element of achieving this goal was to utilize a consultative process. To this end, the project initiation included two stakeholder sessions. El Paso and Ciudad Juárez-area stakeholders participated in discussions that led to confirmation of the specific land border crossing and associated technology system (RFID at BOTA) that would be implemented as a pilot demonstration. An overview of the stakeholder sessions including the process and planned actions is described in this report.
This project initially implemented two RFID reader stations with an algorithm designed to measure crossing time only. However, border wait times and delays are an important concern for travelers and those involved with, or affected by, international trade. FHWA, sharing a common goal with CBP of facilitating the legitimate flow of travelers and trade across land border crossings, began working closely with CBP to determine whether existing RFID crossing time measurement implementations could be enhanced to measure border wait time in addition to border crossing time. CBP gave approval of RFID installations at the primary inspection facility locations at two Texas land border crossings: BOTA and the Pharr-Reynosa International Bridge (Pharr-Reynosa). FHWA subsequently allocated resources and initiated actions to install RFID equipment at BOTA and Pharr-Reynosa that enabled the measurement of border wait time and complemented the border crossing time measurement already in progress at those POEs.
In addition to incorporating the two additional RFID reader stations at BOTA and Pharr-Reynosa, the actions included (among other tasking) development of:
- A guidebook for analysis and dissemination of border crossing time and wait time data.
- Step-by-step guidelines for implementing RFID to measure border wait and crossing times.
- A prototype web tool with design documentation and specifications and supporting user guidance and demonstration.
On May 6, 2010, FHWA held initial discussions on working with CBP and other stakeholders (e.g., U.S. General Services Administration, or GSA) on installing RFID readers at CBP primary inspection to enable automatic measurement of border wait times. At the initial discussion, CBP and FHWA/TxDOT agreed that a field test be conducted to demonstrate that installation of RFID equipment for border wait time measurement would not interfere with CBP equipment and operations. Based on this agreement, FHWA conducted a compatibility test at the Pharr primary inspection facility on August 17, 2010. The test concluded that RFID reader equipment can be installed on the exit side of each primary inspection lane in a manner that causes no interference with CBP operations and equipment. Because border wait times derived from this configuration would include the increment of time experienced in primary processing, the report also detailed a mitigation strategy for extracting that time if deemed necessary.
This final report is not meant to serve as a comprehensive document outlining each task conducted as part of this project, though pertinent extracts of prior project deliverables are included. Rather, it is meant to highlight the most important steps in implementing an automated border crossing and wait time measurement system as experienced with the BOTA and Pharr-Reynosa RFID implementations. These steps include lessons learned as well as observations and analysis of the border crossing Times at BOTA and wait times both at BOTA and at the Pharr-Reynosa International Bridge. Prior deliverables for this project are engineering records that can be found by contacting FHWA at FreightFeedback@dot.gov. Those other written deliverables for this project include the following documents:
- Prototype Web Tool Design Document.
- Prototype Web Tool User Guide.
- Slides: Webinar to Discuss Design and Specification for a Prototype Web Tool.
- Test and Evaluation Reports for BOTA and Pharr-Reynosa CBP Primary RFID Installations.
- BOTA and Pharr-Reynosa Installation After-Action Reports.
- Test and Evaluation Plan for BOTA and Pharr-Reynosa CBP Primary RFID Installations.
- Test and Evaluation Report for BOTA Crossing Time.
- Test and Evaluation Plan for BOTA Crossing Time.
- Implementation Plan (Post-installation Update).
- Approved GSA Installation Permit Applications for BOTA and Pharr-Reynosa CBP Primary RFID Installations.
- Implementation Plan for BOTA and Pharr-Reynosa CBP Primary RFID Installations.
- Report on RFID Compatibility Testing at Pharr-Reynosa.
- Design Document with Architecture Appendix.
- Plan for Collecting Baseline Data.
- Technology Assessment.
- Current State Analysis.
- El Paso Stakeholder Meetings –Agendas, Slides, Notes, and Minutes.
1 Border Wait Time Working Group presentation, April 2009, http://www.thetbwg.org/meetings/200904/1_-_border%20wait%20times%20update.ppt ↑