Active Transportation and Demand Management
ATDM Analysis Brief: Highway Capacity Manual (HCM)-ATDM Project Overview
Project Purpose
The Federal Highway Administration (FHWA) Office of Operations is sponsoring a research project to develop new and/or updated methodologies, data sets, and content for the Highway Capacity Manual (HCM) that will better reflect the demand and traffic flow behavior that results from the application of active transportation and demand management strategies.
Although the developed methodology is currently limited in its ability to model dynamic operations, the method allows for the analysis of operational strategies under varying demand and capacity conditions, which serves as an important foundation for analyzing Active Transportation and Demand Management. FHWA will continue to support research to further refine these base methodologies.
What is ATDM?

Source: Minnesota Department of Transportation
ATDM is the dynamic management, control, and influence of travel demand, traffic demand, and traffic flow of transportation facilities. Through the use of available tools and assets, traffic flow is managed and traveler behavior is influenced in real-time to achieve operational objectives, such as preventing or delaying breakdown conditions, improving safety, reducing emissions, or maximizing system efficiency.
Under an ATDM approach the transportation system is continuously monitored. Using archived data and/or predictive methods, actions are performed in real-time to achieve or maintain system performance.
Active management of transportation and demand can include multiple approaches spanning demand management, traffic management, parking management, and efficient utilization of other transportation modes and assets. Some example approaches include:
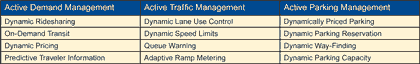
Source: Cambridge Systematics, Inc.
Why is there a need for an ATDM Chapter in the HCM?
The HCM provides a comprehensive set of methodologies for predicting the capacity and the performance of a given highway facility design. However, except for signal timing, these methodologies are not sensitive to advanced traffic operations and demand management techniques. Moreover, real world daily variations in weather and incident conditions and travel demand typically do not enter into HCM computations. As a result, transportation engineers cannot use resource efficient HCM methods to assess the benefits of advanced management techniques that reduce the adverse impacts of these factors on highway capacity and performance.
The 2010 edition of the HCM contains Chapter 35 dedicated to Active Traffic Management (ATM) strategies. However, this chapter is mostly introductory in nature, defining ATM, describing typical ATM strategies, and citing some research on ATM strategies. This FHWA project is intended to develop procedures for predicting how ATDM strategies can affect facility demand, and improve travel time reliability and facility performance. The research will provide content to support a new permanent chapter on ATDM integrated into subsequent editions of
the HCM.

Source: FHWA, Ramp Management and Control, A Primer

Source: Minnesota Department of Transportation
HCM-ATDM Analysis Framework
Source: Cambridge Systematics, Inc.
The methodologies developed in this research should be viewed as an initial, foundational set of methodologies primarily focused on traffic management applications. The methodologies provide practitioners with an approach to represent the varied demand and capacity conditions that facilities may be expected to operate under and suggest a realistic set of transportation management actions to respond to those conditions, thereby representing in a macroscopic sense, the dynamic aspects of ATDM. Although the methods are intended to support ATDM analysis and provide content for Chapter 35 (Active Traffic Management) of the HCM, several aspects of the methodology can be applied to analyzing non-operations or non-ATDM type alternatives.
Overview of the HCM-ATDM Analysis Framework
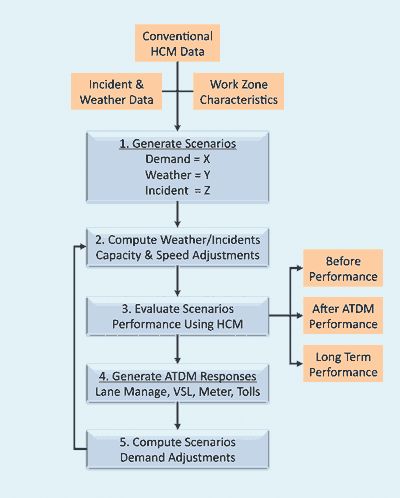
The HCM-ATDM analysis framework uses traditional Highway Capacity Manual input data, the operational analysis methodologies contained in the HCM, and data on incident and weather frequencies to predict the impacts of various levels of ATDM strategies on whole-year facility performance, specifically: mean travel time, travel time reliability, and facility demand.
The methodological framework is designed to assist the analyst in answering the following questions:
- How much can I improve facility performance by implementing aggressive operations strategies?
- How much additional vehicle and person throughput can I achieve for a given facility through the application of aggressive operations strategies?
- Which combination of ATDM strategies and at what levels produce a target quality of performance for a facility?
The work flow of the analysis framework proceeds as follows. First, the analyst inputs the demand and facility data typically required for a conventional HCM analysis. The conventional HCM data is supplemented with local historic data on incidents and weather. Work zones may be input as well. Then the following analysis steps are performed.
- The weather, work zone and incident data are used to generate a set of scenarios representative of the range of conditions that may be present on the facility over the course of a year.
- The effects of weather, work zones and incidents on capacity and speed are computed for each scenario.
- The adjustments are applied using standard HCM operational analysis methodologies to compute
performance for each scenario.
- The ATDM response generator is used by the analyst to identify the VSL, managed lanes, tolls, travel information, and other measures that would be activated in response to each scenario.
- The effect of ATDM on demand is computed and fed back to the capacity and speed adjustment module.
- New capacity and speed adjustments are computed based on the selected ATDM response (repeat of Step 2).
- Standard HCM methods are then applied to compute the performance with ATDM in effect (repeat of Step 3).
The core of the method is the development of "scenarios:" which are combinations of demand, weather, and incident characteristics that reflect the actual conditions that travelers experience over time. Each scenario is input to the HCM analysis module to produce performance statistics for that scenario. All of the scenario results are then combined to produce a composite performance picture, including reliability.
The output of this process is: "Before ATDM performance," "After ATDM performance," and if demand response is to be taken into account, "Long Term/After ATDM performance."
The impact of ATDM strategies is analyzed by changing the procedure's inputs and internal relationships. For this reason, a set of linkages between ATDM strategies and their effect on the how the procedure operates is being prepared. For example, work zone management strategies will affect such things as duration of lane closures and reducing demand due to
traveler information.
ATDM Response for Work Zone Management
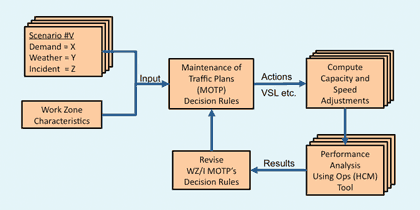
Source: Cambridge Systematics, Inc.
It is expected that the research and methodologies developed for this project will provide a foundation for not only estimating and analyzing the performance of ATDM strategies, but for improving the application of Highway Capacity Manual methods in general.
Among enhancements to the state of the practice that could follow from the groundbreaking work in this HCM/ATDM project include:
- Considering non-ideal (i.e., incident) conditions and variable traffic demand when evaluating system performance,
- Developing procedures and guide-lines for scenario (incident/demand combination) generation and analysis,
- Calibrating HCM predicted performance against field conditions,
- Estimating reliability impacts; such as the 80th percentile travel times,
- Estimating induced travel due to facility improvements.
Even with these enhanced analysis capabilities, it should be noted, that some limitations inherent in HCM analyses will still exist. The analysis remains facility based and thus system level impacts are not reflected. Highly dynamic responses below the 15 minute threshold of the HCM must be modeled approximately. In addition, demand effects due to off facility strategies (such as through regional ridesharing programs) would need to be computed externally and real time dynamic parameters would not be emulated; i.e., the analyst needs to provide the control for a given analysis time slice. Finally, due to project resource constraints, HCM calibration and validation will be performed on a limited set of ATDM strategies.
Example Demand/Capacity Scenarios Used in the Method
| Scenario |
Capacity Reduction |
5th Percentile Demand |
20th Percentile Demand |
50th Percentile Demand |
80th Percentile Demand |
95th Percentile Demand |
| No incidents, Good Weather |
0.00% |
X |
X |
X |
X |
X |
| Single Lane Closure, Good Weather |
35.00% |
X |
X |
X |
X |
X |
| Dual+ Lane Closure, Good Weather |
60.00% |
X |
X |
X |
X |
X |
| No Incidents, Bad Weather |
4.90% |
X |
X |
X |
X |
X |
| Single Lane Closure, Bad Weather |
38.19% |
X |
X |
X |
X |
X |
| Dual+ Lane Closure, Bad Weather |
61.96% |
X |
X |
X |
X |
X |
Effects of Ramp Metering on Whole Year Facility Speed
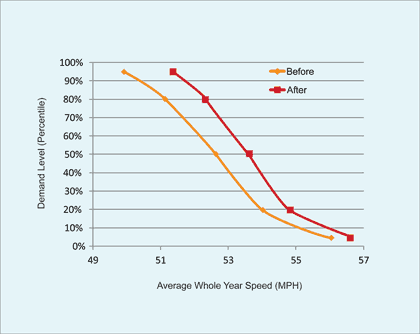
Source: Cambridge Systematics, Inc.
An example application of the procedure demonstrated the positive effect on average speeds produced by implementing ramp metering. The results highlight one of the hallmarks of the method – instead of using a single demand level, several levels are modeled. The levels of demand are indicated by the percentiles taken from the demand distribution, shown on the vertical axis. This realistically represents conditions encountered by travelers – some days have higher traffic volumes than others.
Project Status
An initial draft guidebook laying out the framework has been developed. A preliminary research analysis tool was developed and an initial set of workshops were held to demonstrate methodology/operational strategies and to solicit suggestions and feedback from experts in the field for further improvements.
Analysis methodologies for work zone and incident management are being added and additional workshops that will showcase an improved research analysis tool are available from FHWA.
In addition, SHRP 2 Research Project L08, Incorporation of Travel Time Reliability into the Highway Capacity Manual, is extending the concepts developed by this project to provide a more comprehensive model for reliability prediction and evaluating reliability improvement strategies.
German Junction Control Schematic
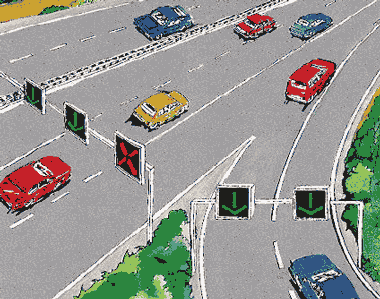
Source: F. Bolte. "Transport Policy Objectives: Traffic Management as a Suitable Tool," Federal Highway Research Institute (Bundesanstalt für Straßenwesen), Bergisch-Gladbach, Germany, Presentation to Planning for Congestion Management Scan Team, June 2006.
ATDM Project Informational Briefs
This informational brief is one of the ATDM briefs in the Analysis category of the FHWA ATDM Brief Series. ATDM briefs are or will be available in the categories of:
- ATDM Program: Yellow
- ATDM Planning: Purple
- ATDM Analysis: Orange
- ATDM Design: Green
- ATDM Operations: Red
In addition to this overview brief of the ATDM/HCM Analysis method, FHWA is releasing additional project briefs to provide high-level descriptions of the various components of the ATDM/HCM methodology and its application.
FHWA ATDM Program
The United States Department of Transportation (U.S. DOT) is advancing the development of guidance, planning, case studies, and research in the application and design of active transportation and demand management approaches. In addition, the ATDM program will provide lessons learned, standards, and best practices on key underlying ATDM planning, evaluation, analysis techniques and design elements that serve as a foundation for ATDM implementation.
For more information on this project or the FHWA ATDM program efforts, please contact:
Jim Hunt
Jim.Hunt@dot.gov
Bob Sheehan
Robert.Sheehan@dot.gov
James Colyar
James.Colyar@dot.gov
Greg Jones
GregM.Jones@dot.gov