9. Tools and Techniques for Evaluation TDM
There are two critical types of evaluation important to the planning process: a priori forecasting of estimated impacts and ex post facto measurement of actual results so as to measure progress against stated objectives. Forecasting is a well established part of the transportation planning process, and this chapter provides some guidance on tools for use in predicting the potential impact of TDM. However, the need for monitoring and evaluation, after the fact, is growing in importance within the objectives-driven, performance-based planning process. FHWA guidance on the objectives-driven, performance-based planning process for operations cites the following benefits of monitoring and evaluation to help transportation planners and other stakeholders:
The ability to accurately monitor and evaluate TDM strategies will also allow for more knowledge on TDM effectiveness, as will be discussed in the next chapter. The careful measurement of impacts of TDM strategies will create a more informed knowledge base from which to develop more effective future plans. The remainder of this chapter provides guidance and resources on three topics related to TDM evaluation: modeling of TDM impacts, evaluation of actual results, and the role of cost effectiveness analysis. 9.1 Forecasting Potential TDM ImpactsAs TDM becomes more recognized by planners and policy-makers for its growing importance as a meaningful set of solution strategies, the need to rigorously and carefully forecast impacts becomes greater. Once objectives are set for transportation system performance and related elements, strategies need to be selected that will address and work to fulfill these objectives. Assessing the potential impact of TDM strategies in reducing travel demand is as important as assessing the impact of capacity enhancements in accommodating unmet demand. A clear distinction needs to be made at the outset - there might be significant differences in approach, rigor and methods, and resource requirements to evaluate the short-term impacts of a single, site-specific TDM measure (e.g., for funding selection) versus the long-term forecasting of a set of TDM strategies applied to a whole region. There are two general practiced approaches to estimating the potential impacts of TDM strategies: sketch planning and modeling. Sketch planning involves the use of simple factors – elasticities, comparative case study findings, and more qualitative approaches to assess the potential impacts of TDM – for a package of TDM strategies or individual strategies. One example of sketch planning involves the meta-analysis of how land use influences travel. This comparison provides weighted average travel elasticities of VMT, transit use, and walking with respect to the built environment variables (although none is greater than 0.39 and most are less – meaning that a 10 percent shift in land use characteristics will be expected to lead to a 4 percent reduction in VMT and alternative mode use).152 These variables include: density (population, employment, commercial FAR); diversity [land use mix (Entropy Index), jobs-housing balance]; design [street connectivity indexes (e.g. intersection densities, % of 4-way intersections, link/node ratios, etc.)]; destination accessibility (access by mode); and distance to transit, shopping, CBD. The effects of these simple factors are cumulative. While the effect of any one on VMT reduction and mode shift is small/moderate, the combined effects from improving upon several of these can be substantial. This may be a very appropriate approach for screening TDM measures and for comparing the relative impact of TDM to other solutions. For example, sketch planning might be used to represent the general benefits of emphasizing TDM within a regional transportation plan for screening purposes. However, caution should be taken when using single case studies or "rules of thumb" when evaluating TDM strategies, especially packages of strategies and longer-term planning horizons. Pointing to a single case example and transferring the results to another city and application is not a sound means to estimate the potential impact of a given TDM strategy. Likewise, using generalized rules of thumb, such as assuming that TDM can reduce vehicle trips by 10 to 15 percent, can lead to unrealistic expectations especially if policies and funding are insufficient to support that change. While some very focused, site-specific TDM programs, by aggressively using financial incentives, disincentives, and parking management, can reduce trips by much more than 15 percent, the ability to realize this impact over a larger base of travelers, trip generators, and geographic areas is doubtful without substantial changes in policies, resources, and background conditions. Many transportation planning processes use some form of modeling to predict future outcomes of alternative plan elements. The four-step transportation modeling process: trip generation, trip distribution, mode choice, and trip assignment is a common approach that has been used for many years. Unfortunately, it is not well-suited to evaluate many TDM strategies. Common transportation models boil strategy attributes down to cost and time variables. In general, many TDM strategies cannot be adequately described in those terms (see discussion of TRIMMS model below). Also, in the mode choice step, the primary modes considered are car driver, car passenger, and transit rider. The ability to assess strategies to increase car occupancy and strategies that promote active transportation (bike and walk) and alternative work arrangements (telecommuting, compressed work weeks) is severely limited with traditional travel demand models. One common means for evaluating TDM strategies is to assume a reduction in overall "off the top" travel demand through the collective effectiveness of TDM measures and reducing trip generation by some percentage. While such an approach might be viable and adequate for representing the general benefits of TDM in a transportation plan, especially at regional levels, this approach is not suitable to evaluate specific TDM strategies and their interaction with smart capacity enhancements. For such applications, several "off-model" tools have been developed to systematically evaluate the effectiveness of TDM strategies with resulting outputs (vehicle trip, VMT, mode shift) results fed back into travel models in order to adjust each step in the process, especially mode choice and trip assignment. While some focus on TDM measures, others deal with related issues, such as the impact of land use or growth management measures to reduce VMT, as in the case of the scenario-based model developed by Bartholomew and Ewing153 and related tools such as the Southern California Association of Governments Sustainability Tool.154 Four TDM-specific models have been developed and used in various parts of the U.S.:
These models have been developed for two purposes: to predict the impact of TDM measures on commuters and other travelers based on 1) employer-provided TDM measures and 2) government-provided incentives for alternative mode usage. While the models have been developed for the commuter target group, they have also been used for other target groups, such as schools, tourists, or any group where a set of baseline mode shares are available. They have been developed for use at the site-specific level, but have also been used to evaluate corridor and regional plans. Each is briefly discussed below. COMMUTER Model – The EPA COMMUTER Model is the oldest and most widely used model for planners to forecast the impact of various TDM programs, implemented by employers or by government entities in the form of incentives (public transport service improvements) or disincentives (parking charges). The COMMUTER Model v.2.0 evolved from the FHWA TEEM. As such, the model is over 20 years old and has been used extensively by all levels of government and private employers in the U.S. The logit component of the model provides a pivot point tool to predict mode shift changes resulting from measures that change the time and/or cost of travel for a given mode choice. This feature also allows considering interactive effects. This means that TDM strategies do not just shift travelers from driving alone, but they can draw travelers from other alternative modes as is the case in the real world. The employer support program component is based on the professional judgment of the model developers, and is in the form of average modal share changes from supportive activities for those modes (such as guaranteed ride home services for those who ride public transport). A reliance on professional judgment is a distinct weakness of the COMMUTER Model.155 TDM Effectiveness Evaluation Model - TEEM is a post-processor spreadsheet-based model, which includes price and service point elasticities of demand to estimate potential changes in vehicle trips from these measures. TEEM was developed for WSDOT for use in predicting the impact of TDM measures and land use policies applied to activity centers in a corridor of planned highway reconstruction. TEEM also provides some guidance on how to assemble and evaluate packages of measures, to assure that counterproductive measures are not evaluated equally and that the net impact of these packages is not necessarily additive. An elasticity-based spreadsheet model is a simple and user-friendly tool, but can mask real complexities of some strategy interactions and does require specification of the starting conditions. Elasticity-based models estimate the impact of various measures and sum the impacts. Multimodal logit-based models (such as that in the COMMUTER Model) can account for some interactions between measures. For example, some measures will draw travelers from other sustainable modes, not just driving alone. A new bicycle program might draw people off of public transport as well as out of their cars. Interactive predictive models shift travelers from all modes based on newly introduced TDM measures.156 Worksite Trip Reduction Model - the WTRM, released in 2004, was developed for the Florida Department of Transportation and U.S. DOT under the National Center for Transit Research (NCTR) at the University of South Florida. This model has the greatest articulation of separate measures for consideration in predicting the impact of various packages of TDM measures. It includes over 100 individual measures with some logical groupings for some of the analyses and reporting functions. The WTRM is based on a very large database of thousands of worksite travel plans, from Southern California, Tucson (AZ), and Seattle. Using a neural network formulation, WTRM analyzes time series data from required worksite reports to develop average changes in the vehicle trip rate (cars per 100 employees). The model is wholly experiential and based on conditions with low public transport shares (0-10%), modest carpool shares (10-20%), and high drive alone shares (70-90%), perhaps appropriate for areas with high starting drive alone shares.157 Merging datasets improved the model. For example, the neural network model built with equally sampled data from the three areas performed better for Los Angeles than the model built with only data from Los Angeles. Trip Reduction Impacts of Mobility Management Strategies, or TRIMMS, first released in 2007 with version 3.0 released in 2012, was developed under NCTR and builds upon previous model development experience to create a hybrid model that combines the features of both the WTRM and TEEM models. The TRIMMS model documentation includes a comparison with the EPA COMMUTER Model and WTRM, building upon their strengths. TRIMMS uses constant elasticity of substitution trip demand functions to evaluate "harder" measures (that can be expressed in cost or time) and the cross-sectional benchmarking results of the WTRM for "softer" support and informational measures. TRIMMS was developed for a single worksite or a subarea with a predefined travel market. The newer version of the model (TRIMMS II) focuses on municipal and regional decision-making and allows estimating the impact of land use controls on transit ridership levels. These strategies include land use policy changes affecting gross population density and retail establishment density levels, transit station accessibility improvements, and transit-oriented development initiatives. One unique function of the TRIMMS model is the ability to evaluate a full range of societal benefits (beyond VMT and emissions) against program costs. As such, the effectiveness and costs of various measures and packages of measures can be evaluated. The outputs from the TRIMMS Model are more extensive than those of the other models, including: change in mode shares, change in social externalities (i.e., the impact of car use on the environment, congestion, safety, etc.), program benefit/cost ratio, and detailed emission impacts by pollutant.158 In comparing the four predictive models, as shown in the Table 9.1 below, the TRIMMS model may have the greatest applicability for use in the transportation planning process and the range of TDM strategies to be tested. As stated above, TRIMMS combines the power of demand elasticities to predict the impacts of "harder" measures with the experiential richness of a cross-sectional analysis of actual TDM implementation results. TRIMMS has the added feature of a cost effectiveness and benefit/cost estimation module. The model inputs are not too onerous, but do provide an adequate baseline for predictive purposes. The TRIMMS 3.0 Model estimates a wide range of emission pollutants and incorporates a new module that evaluates the impact of land use strategies on transit patronage. TRIMMS uses the emission inventory of the Environmental Protection Agency Motor Vehicle Emission Simulator (MOVES2010a).159 This model enables users to conduct cost-benefit assessments for many strategies aimed at reducing emissions without the cost and expertise required by more sophisticated models. It also benefits from improved user-friendliness, unlike the COMMUTER Model, which can be rather cumbersome to use.
Note – Dark circles in the table are better than light circles. 9.2 Measuring Actual TDM ImpactsWhy evaluate TDM strategies after they are implemented? Of course, funders and program managers want to know how their programs and projects are doing. Evaluation is a sound management practice. In some cases, contracts require monitoring for performance-based provisions of the funding agreements. But evaluation should also be seen as an integral part of the planning process. As stated earlier, it is important that TDM strategies within transportation plans be geared to address specific policy objectives, as enumerated in Chapter 3. With each objective, specific performance measures should be developed, monitored, assessed, and reported in order to determine the level of fulfillment achieved. This is at the heart of the objectives-driven, performance-based planning for operations process. Developing a well-conceived, balanced set of multiple performance measures for assessing the ability of TDM to fulfill specific policy objectives and to assess the comparative contribution of TDM to meeting transportation plan goals is very important. Monitoring and evaluation need to be built into the planning process as a concrete feedback loop to inform the overall effectiveness of TDM (and other measures) in addressing plan objectives. Therefore, developing and tracking pertinent performance measures is a key to an enlightened planning process. A range of performance measures can be enumerated when considering TDM in light of the broader definition used in this report. For example, the following set of mobility-related performance measures was developed for a statewide TDM planning process for the Utah DOT160 (Table 9.2).
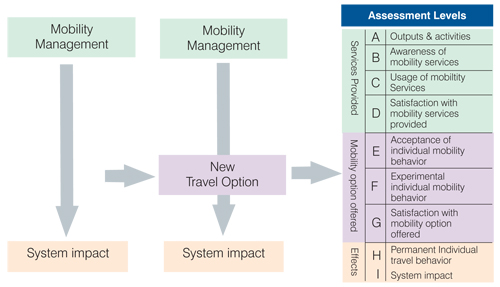
The specification and use of TDM-related performance measures, such as those enumerated in the table above, can inform broader performance measures, including those not directly related to the transportation system, such as: livability; economic development or gross regional product; other economic benefits such as household transportation spending; per capita income; health measures, such as obesity and asthma rates; and safety measures, such as crashes and injuries. TDM performance could also impact the performance of other parts of the transportation system, such as transit ridership and auto ownership. Measures specific to more traditional TDM can be found within the FHWA guidance report "The Building Blocks of a Model Transportation Plan Incorporating Operations." That report provides sample performance objectives for: employer trip reduction programs, commuter shuttle service, carpool/vanpool programs, walking/bicycling initiatives, parking management, and marketing. It also provides excerpts from a model transportation plan that incorporates operations, including TDM.161 Once performance measures are selected, the focus shifts on how to monitor and measure fulfillment. Monitoring TDM performance is often rather different from highway or even transit operations, where the primary data collection method is direct observation. Counting cars and transit riders along spatial and temporal dimensions is a key focus of performance monitoring for these strategies. However, TDM is all about choices and, therefore, the need exists to monitor the acceptance and use of travel choices and to measure a shift in behavior to a more sustainable mode. This often requires user surveys to assess not only how travelers are behaving, but whether this amounts to a shift from another travel pattern and even why the shift was made (what was the impetus or incentive). Finally, evaluation should be objective, often suggesting that a third party conduct the evaluation given the somewhat more interpretive nature of TDM behavioral data. A standardized methodology for evaluating TDM strategies does not yet exist in the U.S. However, Canadian and European transportation interests have developed common methods and approaches and these can help inform planners and other transportation professionals in planning for evaluation. The Transport Canada-funded Canadian Guidelines for the Measurement of TDM Initiatives162 and the European Commission-funded Max-SUMO guidelines163 are based on a similar approach and set of assessment levels. The Max-SUMO process, developed as part of the MAX project,164 offers a structured approach to evaluating TDM strategies from user awareness and acceptance, through mode shift, through to calculated system impacts. These assessment levels are illustrated in Figure 9.1. The approach is focused on implementation of a new TDM program or service or incentive to a given target travel market. The Max-SUMO reference also provides guidance on setting objectives and on data collection and monitoring.
Figure 9.1: Max-SUMO Assessment Levels Finally, once evaluation results are compiled, the findings should be presented in terms that both policy-makers and other transportation professionals can understand. Each transportation discipline has its own language, terminology, and abbreviations, and TDM is no exception. For example, policy-makers and even transportation engineers do not necessarily understand the concept of vehicle trip reduction because it is rather abstract. It is better to convey TDM findings in terms to which other transportation planners can relate, for example reporting vehicle trip reduction as the number of cars removed from a particular road or corridor or the equivalent reduction in delay or increase in person throughput. In fact, TDM is the only transportation solution set that focuses on the "trip not taken" rather than on the accommodation of vehicles. As such, TDM cost effectiveness can compare the cost of removing vehicles from the road as compared to accommodating travel via transit, rail, paratransit, and road capacity improvements. 9.3 Cost EffectivenessGiven that the transportation planning process is often fiscally constrained and the analysis of strategies ultimately involves an assessment of costs and funding opportunities, it is important to evaluate the cost effectiveness of TDM strategies. The analysis can take three forms: cost effectiveness, comparative cost effectiveness, and benefit/cost analysis. Cost effectiveness is fairly straightforward and involves dividing total program or project costs by total impacts or outcomes, for example, the cost per mile of travel reduced or cost per ton of emissions reduced. A recent evaluation of three "Sustainable Travel Towns" in the U.K. assessed total VMT reduction as a result of the various TDM programs implemented in all the cities and assessed these total findings against the total public investment in TDM.165 This provides an indication of the cost of an intended program outcome. The resulting cost effectiveness measure was that the sustainable transportation efforts resulted in reducing the cost for a mile of travel by about 4 pence (US$0.06). This provides an indication of the cost effectiveness of the program, which resulted in overall decreases in per capita car use and shifts to bike, walk, and public transit. The evaluation also revealed that the per capita cost of the program was about US$15 per resident, a measure of program inputs rather than program outcome. Comparative cost effectiveness takes this analysis to the next level to help policy-makers and planners understand the relative value of TDM strategies versus other solution strategies. For example, one evaluation of the ridesharing program in Los Angeles County166 concluded that the program maintained a commuter in a ridesharing mode, or the equivalent, removed a car from the regional highway system, for about $1 per day. When compared to other mobility and congestion relief strategies implemented by the agency, TDM was seen to be comparatively cost effective. For example, the cost effectiveness analysis concluded that the operation and maintenance of a new light rail line in LA was going to cost about $2.50 per new daily rider. Therefore, TDM was viewed as a more cost effective means to remove cars from the highway system than the new light rail system. These findings were used in planning and programming decisions by the agency. Ultimately, comparative cost effectiveness can be a powerful tool to show the cost of removing a car through demand management versus the cost of accommodating that car with capacity improvements or expansion. Another example of basing program decisions on comparative cost effectiveness is provided by the State of Washington's Trip Reduction Performance Program (TRPP).167 The legislature created TRPP in 2003 as a way for the state to fund organizations that implement sustainable, cost-effective projects that increase the capacity of the transportation system by reducing the number of drive-alone trips and VMT for commute purposes. TRPP funds are awarded on a competitive basis to entrepreneurs, private employers, public agencies, nonprofit organizations, developers, and property managers who provide financial incentives to commuters for using alternatives to driving alone. The purpose of the program is to create a trip reduction "market" in which WSDOT takes "bids" from organizations to reduce commute trips. WSDOT sets a cap on the price it is willing to pay per trip reduced over the course of a year. The program is different from a standard grant program in that the final award for a contractor is dependent on the performance of a project. Contractors are eligible for financial bonuses (up to a cap) if their projects exceed their goals. Finally, transportation projects are often justified with Benefit/Cost Analysis (BCA). This analysis monetizes the potential benefits of a project or program and compares them to program costs. A B/C ratio greater than 1.0 reveals that the benefits outweigh the costs. The difficulty in this analysis is monetizing costs and benefits. On the cost side, like any transportation project, TDM often involves many types of costs: some are capital, but many TDM costs are staffing, incentives, marketing, and other operational costs. However, many TDM programs/services are not fully allocating the costs by project or activity, which can distort results. Also, many TDM costs are borne by the private sector, such as employer and developer efforts. But as with any BCA, the difficulty comes in trying to monetize societal benefits, such as congestion relief (often expressed as time savings), safety improvements (expressed as crash reduction and injury cost savings), environmental improvement (also expressed as health cost savings), etc. However, with all the drawbacks of accurately estimating costs, BCA is a powerful and well recognized tool that is available to the TDM community. In fact, given the relatively modest costs in relation to benefits, TDM programs often have a very good B/C ratio. BCA has already been incorporated into the TRIMMS Model (v. 3. 0). TRIMMS includes monetized benefits, by region of the U.S., for the following: congestion, air and noise pollution, climate change, fuel consumption, and health and safety. The TRIMMS model, using TDM cost data and derived impact estimates from the model, can generate B/C ratios for TDM packages of TDM strategies and uses Monte Carlo simulation to reflect the uncertainty in various inputs.
151 FHWA, Advanced Metropolitan Planning for Operations: An Objectives-driven, Performance -based Approach - A Guidebook , SAIC, FHWA-HOP-10-026, 2010, https://ops.fhwa.dot.gov/publications/fhwahop10026/index.htm PDF files can be viewed with the Acrobat® Reader®. | |||||||||||||||||||||||||||||||||||||||||||||||||||||||||||||||||||||||||||||||||||||||||||||||||
|
United States Department of Transportation - Federal Highway Administration |
||
 A major thrust of this desk reference is the need to better integrate TDM into the transportation planning process and, as discussed in Chapter 2, this involves the adoption of a new way of thinking about TDM as more than ridesharing. It also requires the consideration of TDM throughout the planning process. However, once TDM is appropriately positioned within the planning process, the technical work remains to select the most effective strategies for addressing specific policy objectives. Evaluation is the process of assessing and selecting strategies for inclusion in the plan and ultimately for implementation.