2011 Urban Congestion Trends
Improving Travel Reliability with Operations
Download the Printable Version (PDF, 6 MB)
You will need the Adobe Acrobat Reader to view this PDF.
For More Information: https://ops.fhwa.dot.gov/perf_measurement/index.htm
Contact Information: Operations Feedback at OperationsFeedback@dot.gov.
U.S. Department of Transportation
Federal Highway Administration
Congestion levels remained relatively unchanged over the past year in 19 urban areas in the United States.
According to the FHWA Traffic Volume Trends report, there was slightly less travel on roads in 2011 compared to 2010. This slight decrease in traffic can ease congestion levels. Congestion levels are still generally below the levels experienced in 2007 prior to the economic downturn.
While congestion levels remained relatively unchanged (or decreased slightly) from 2010 to 2011, as the economy improves, the use of operational strategies will become more important to manage increased traffic and congestion. This unique timing makes the implementation of time-saving traffic operations strategies all the more important.
The benefits of successfully implemented operational strategies can include less travel time, more reliable travel times, less fuel consumed, fewer emissions, and increased safety, to name a few. These improvements benefit the movement of people and goods on the highway system. There are a number of success stories documented in this report that illustrate how some States and communities are more effectively implementing traffic operations strategies, and monitoring impacts.
Congestion Facts
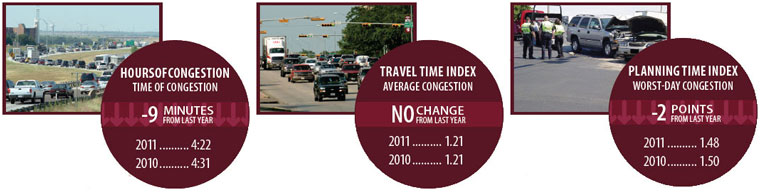
- All three congestion measures—daily hours of congestion, time penalty for each trip, and worst-trip time penalty—have decreased or remained the same.
- Congestion has decreased in all but 6 of the monitored regions to some degree.
- The time penalty for a trip on an average day decreased for 12 of the 19 monitored regions.
- Travel time on the worst day per month decreased (or remained unchanged) for 10 of the 19 monitored regions.
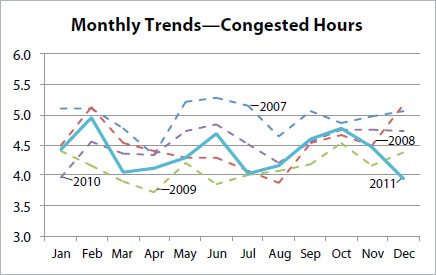
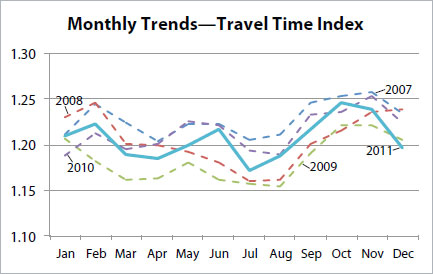
- Congestion is generally lowest during the summer vacation season as evidenced by trip times.
Congestion Measures
- Hours of congestion—amount of time when freeways operate below 50 mph.
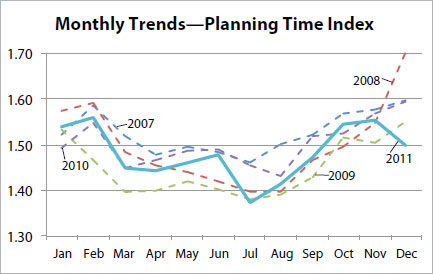
- Travel Time Index (TTI)—time penalty for a trip on an average day. A TTI of 1.30 indicates a 20-minute free-flow trip takes 26 minutes in the rush hours.
- Planning Time Index (PTI)—time penalty for a trip to be on time for 95 percent of trips (i.e., late for work on one day per month). A PTI of 1.60 indicates a 20-minute free-flow trip takes 32 minutes (20 × 1.60) to be late for work only one day per month.
Hours of Congestion Each Day

Time Penalty Each Trip

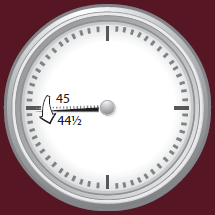
Worst-Trip Time Penalty
The clock hands show the time wasted in 2010 (dashed) and 2011 (solid).
Congested time decreased 9 minutes from 2010 to 2011, from 4:31 to 4:22.
The time to make a trip during rush hours that takes 30 minutes in free-flow conditions remained the same from 2010 to 2011 at 36.5 minutes.
Travel time on the worst day of the month (for a 30-minute trip) decreased from 45 minutes in 2010 to 44.5 minutes in 2011.
Data from traffic operations centers and private-public partnerships were provided to the Federal Highway Administration from the following regions: Boston, MA; Chicago, IL; Detroit, MI; Houston, TX; Los Angeles, CA; Minneapolis-St. Paul, MN; Oklahoma City, OK; Orange County, CA; Philadelphia, PA; Pittsburgh, PA; Portland, OR; Providence, RI; Riverside-San Bernardino, CA; Sacramento, CA; St. Louis, MO; Salt Lake City, UT; San Diego, CA; San Francisco, CA; and Tampa, FL.
Improving Reliability with Effective Operations
What Is Reliability?
We’ve all made important trips. For trips that are urgent, you have an expectation of how long it will take you to get there. For example, on your daily commute trips, this is the average time it takes you based on your past experiences. For more urgent trips, travelers add to their average trip times to ensure an on-time arrival. That extra time “buffer” is what reliability performance measures are designed to help us understand. The more reliable the trip, the less extra “buffer” time you need to add to your trip.
How Can Effective Operations Improve Reliability?
Trips can become unreliable when there is any cause for disruption in the traffic flow. This could be from a crash, stalled vehicle, snowstorm, construction, or special event. Effective operation of the transportation system can mitigate the impact these situations have on traffic flow.
Some typical ways that effective operations can improve reliability include:
- Quickly identifying, responding to, and clearing incidents and/or stalled vehicles.
- Performing construction activities in ways that minimize impacts during peak traffic.
- Keeping roadways cleared during snowstorms.
- Providing traveler information to motorists during incident conditions.
Reliability Reporting—The Next Step
A common saying is “what gets measured, gets done!” This saying applies to travel time reliability as well. Using day-to-day traffic data, transportation agencies can better understand when and where the transportation system becomes unreliable by monitoring and reporting reliability performance measures.
A rich dataset of transportation system reliability trends allows for bettter planning for operations by transportation professionals. Better understanding when and where reliability performance changes will allow operations personnel to be responsive to unreliable traffic conditions. An example of planning for operations and reporting reliability at a metropolitan planning organization (MPO) is shown on the next page.
For More Information:
https://ops.fhwa.dot.gov/publications/tt_reliability/brochure/
Planning for Operations and Reporting Reliability: National Capital Region Transportation Planning Board
The National Capital Region Transportation Planning Board (NCRTPB) at the Metropolitan Washington Council of Governments (MWCOG) provides a successful example of planning for operations and reporting reliability. NCRTPB, which is the metropolitan planning organization for the Washington, D.C. area, is in the process of developing a Regional Transportation Priorities Plan (RTPP) that includes the Planning Time Index as a reliability measure. NCRTPB has also developed a Congestion Dashboard as part of the National Capital Region Congestion Report. The dashboard is driven by sensor and private-company probe data. The dashboard includes travel reliability measures (the Planning Time Index) using the more user-friendly name of Extra Time for On-Time Arrival (see graphic at right).
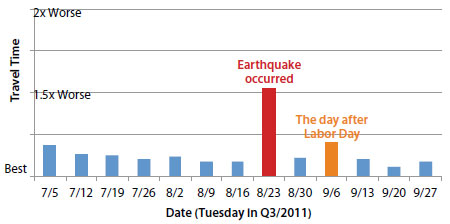
NCRTPB is also associated with the Metropolitan Area Transportation Operations Coordination (MATOC) Program, which is a partnership between transportation agencies in Washington, D.C., Maryland and Virginia with the goal of improving safety and mobility in the region through information sharing, planning and coordination. Reporting reliability information such as the Planning Time Index requires collecting day-to-day traffic statistics to identify unreliable travel days. One such unreliable day is the traffic impact of the August 23, 2011, earthquake in comparison to other Tuesdays (see graphic at bottom). The day-to-day operations information allowed transportation professionals the opportunity to conduct after-action reviews and draw lessons for future improvements.
Reliability on Freeways
Extra Time for On-Time Arrival* in Q4/2011
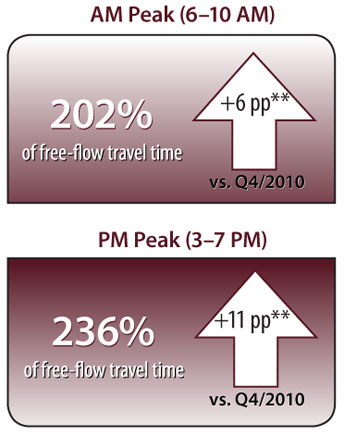
*This is compared to free-flow travel time. For example, if free-flow travel time is 30 minutes, then one has to budget 3×189%=57 minutes to ensure on-time arrival in the AM peak (this measure essentially is the Planning Time Index). ↑
**pp: percentage points
Traffic between 3:00 PM and 4:00 PM on all Tuesdays in Q3/2011
For More Information:
http://www.mwcog.org/congestion
http://www.matoc.org
Success Stories in Operational Improvements
The following success stories highlight innovative ways states and communities throughout the United States have reduced congestion through effective operations. These case studies focus on evaluation of operational strategies.
Minneapolis, MN: High-Occupancy/Toll Lane I-35W Express Lanes
High-Occupancy Vehicle/Toll Lanes
Using a designated lane to provide travel time savings to bus riders, carpoolers or toll-paying customers.
(Benefits: faster, more reliable trips)
The Investment
Through the United States Department of Transportation’s Urban Partnership Agreement (UPA), the Minnesota Department of Transportation combined $133 million in Federal funds with $50 million in State funds to fund 24 different projects and initiatives along I-35W. One of the I-35W UPA project goals was to provide a MnPASS express lane throughout the 16-mile length from the south suburbs starting in Burnsville to downtown Minneapolis. The existing high-occupany vehicle (HOV) lane was extended and converted to a high-occupany toll (HOT) lane in phases with the final section opening in fall 2010.
The Return
The I-35W Express Lanes are providing benefits to travelers in the corridor including:
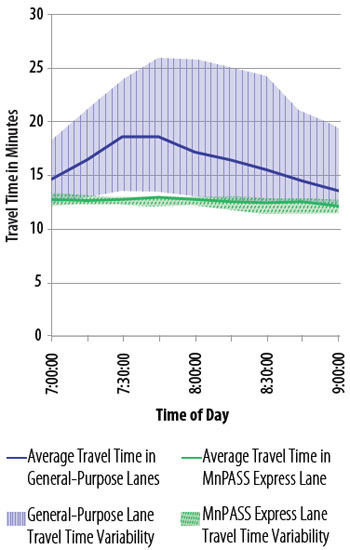
- Average travel time savings of 6 to 7 minutes compared to the general-purpose lanes (see graphic).
- Improved reliability of travel times compared to the general-purpose lanes (see variability in graphic).
Travel Time Reliability: Northbound I-35W AM Peak
In addition, transit improvements including double contraflow bus lanes on Marquette and 2nd Avenues, called the MARQ2 project, have provided an 18 percent increase in ridership and substantial time savings (5-10 minutes).
For More Information:
http://www.dot.state.mn.us/upa
http://www.mnpass.org
Kansas City, MO: Improved Information Coordination Cross-Town Improvement Project (C-TIP)
Freight Management
Traffic sensor data are combined with information about truck and rail cargo deliveries to improve freight mobility.
(Benefits: quick, reliable travel and fewer truck trips)
The Investment
A government and industry collaboration was formed to share information about freight loads that need to be moved. Trucks that would otherwise “return home empty” are now reloaded and given routes that avoid congestion.
The Return
Several tests were performed to evaluate elements of the C-TIP in Kansas City. The test identified benefits including increased productivity and emissions reductions. The results are highlighted in the table.
| Test |
Real-Time Traffic Monitoring |
Real-Time Traffic Monitoring |
| Length |
5 Months |
5 Months |
| Description |
Deployment of RTTM/ DRG-Enabled iPhones |
Deployment of RTTM/ DRG-Enabled iPhones |
| Modules Deployed |
IMEX, RTTM, WDU, DRG |
IMEX, RTTM |
| Productivity Results |
21% Travel Time Improvement
 |
19% Travel Time Improvement
|
| Emissions Reduction |
10%
|
6%
|
DRG = Dynamic Route Guidance
RTTM = Real Time Traffic Monitoring
IMEX = Intermodal Exchange
WDU = Wireless Drayage Update
For More Information:
https://ops.fhwa.dot.gov/freight/technology/best_practice/index.htm
Utah: Accelerated Bridge Construction of 4500 South Bridge over I-215 in Salt Lake City
Accelerated Bridge Construction
Using various methods during project planning, design, contracting and construction to significantly reduce the time to construct/replace a bridge compared to traditional methods.
(Benefits: reduced motorist delay, reduced environmental impact, and improved safety)
The Investment
With $1 million of funding support from the Federal Highway Administration (FHWA) Highways for LIFE Program, the Utah Department of Transportation (UDOT) used accelerated bridge construction (ABC) techniques to replace the 4500 South bridge over the I-215 East Loop in 2007. The bridge was constructed offsite over a period of 4 months and moved into place using self-propelled modular transporters (SPMTs).
The Return
Using traditional bridge construction methods, traffic would have been impacted for approximately 120 days. With ABC, traffic was impacted along I-215 for only a weekend, and the 4500 South bridge was affected for 10 days. While traditional construction methods would have cost $800,000 less than the ABC methods, the project saved $4 million in user delay. UDOT has subsequently performed numerous ABC projects using SPMTs.
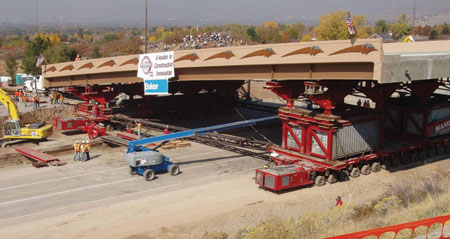 Moving the superstructure using SPMTs.
For More Information:
https://www.fhwa.dot.gov/hfl/summary/ut0409/ut_final.pdf
https://www.fhwa.dot.gov/publications/focus/07dec/01.cfm
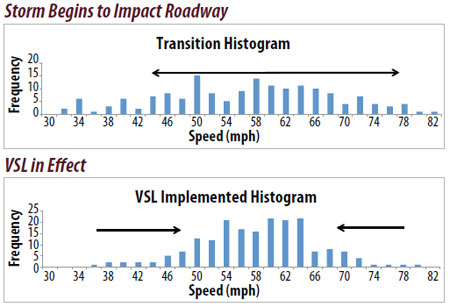
Wyoming: Enforceable Variable Speed Limit System on I-80 between Laramie and Rawlins, WY
Enforceable Variable Speed Limit Systems
These systems provide enforcement reductions in speed for motorists during severe weather conditions.
(Benefits: reduced speed during inclement weather, and improved safety)
The Investment
Operational improvements can also provide benefit in rural areas. The Wyoming Department of Transportation (WYDOT) recently deployed an enforceable variable speed limit (VSL) system on I-80 between Laramie and Rawlings, WY. This corridor experiences severe weather events, and the system provides recommended reductions in speed to motorists along the 52-mile project corridor.
The Return
The following initial evaluation results were found after one year of system operation:
- Vehicle speeds were impacted by the system when the system posted reduced speeds during severe weather. There was an observed reduction in speed of 5.9 to 8.6 mph for every 10 mph of posted speed limit reduction.
- Statistical differences were not generally found in speed variability between normal conditions and storm events when the system was operating. As shown in the graphic below, one location (MP256.25) did however show a favorable impact on speed variability when the system was operating.
- Crash rates during the first year of system operation were the lowest in the past decade.
Favorable Impact on Speed Variability
For More Information:
http://ntl.bts.gov/lib/42000/42900/42965/wrtm_final_report_06302011.pdf
http://www.dot.state.wy.us/files/content/sites/wydot/files/shared/Planning/Research/WYDOT_ElkMtnVSL_FinalReport.pdf
Performance Management and Operations
Performance Management—Use of Benefit/Cost Analysis
The FHWA Office of Operations continues to lead numerous activities to advance the implementation and practice of performance management at the Federal, State, and local level. The FHWA Office of Operations developed the Benefit/Cost Analysis for Operations Planning Desk Reference to provide practitioners with practical guidance, tools, and information for conducting benefit/cost analysis for a wide range of Transportation System Management and Operations (TSM&O) strategies. With continually shrinking resources, transportation organizations at all levels of government are continually being asked to justify their programs and expenditures. TSM&O programs are often asked to rank their projects against traditional projects. The FHWA Office of Operations recognized the practitioner’s need for relevant and practical guidance in how to effectively conduct benefit/cost analysis on a wide spectrum of transportation strategies. The Desk Reference will be available in June 2012.
Real-Time System Management Information Program (Section 1201)
As of November 2010, the FHWA Office of Operations has issued a Final Rule on Section 1201 of the Safe, Accountable, Flexible, Efficient Transportation Equity Act: A Legacy for Users (SAFETEA-LU). The purpose of the program outlined in Section 1201 is to provide the capability to monitor, in real-time, the traffic and travel conditions of the major highways of the United States and to share that information to improve surface transportation system security, address congestion, improve response to weather events and surface transportation incidents, and facilitate national and regional highway traveler information.
The program is to be established on all interstate routes within 4 years (by November 8, 2014) and on the other significant roadways as identified by the States and local agencies within 6 years (November 8, 2016). The Final Rule provides minimum requirements for traffic and travel conditions related to construction activities, roadway- or lane-blocking incidents, roadway weather observations, travel time information, information accuracy, and information availability.
When archived and integrated into management databases, the widespread availability of travel time information (and other traffic disruptions) as required through Section 1201 will provide a strong foundation for performance monitoring and management in the coming decade. For more information, see https://ops.fhwa.dot.gov/1201/.
Contact Information
For more information on this report, contact Rich Taylor (Rich.Taylor@dot.gov).
Visit the Urban Congestion Report web site for quarterly congestion trend updates: www.ops.fhwa.dot.gov/perf_measurement/ucr/index.htm.