Traffic Analysis Toolbox Volume XII:
Work Zone Traffic Analysis – Applications and Decision Framework
3.0 Selecting the Appropriate Type of Traffic Analysis Tool
For the purpose of assessing work zone impacts, different transportation agencies have used a variety of transportation analysis tools. Each tool is unique and has its own set of capabilities and limitations. After an overview of the various categories of traffic analysis tools, this chapter discusses the key factors, challenges, strengths, and limitations to consider before selecting a suitable analysis tool to determine the impacts of a work zone. The following presents these considerations through a step by step approach that is adapted from the tool selection procedures described in the Traffic Analysis Toolbox Volume IX: Work Zone Modeling and Simulation – A Guide for Analysts (Hardy, M., and K. Wunderlich. Traffic Analysis Toolbox Volume IX: Work Zone Modeling and Simulation – A Guide for Analysts. Publication FHWA-HOP-09-001, Federal Highway Administration, U.S. Department of Transportation, Washington, D.C., March 2009.) and Traffic Analysis Toolbox Volume II: Decision Support Methodology for Selecting Traffic Analysis Tools. (Jeannotte, K., A. Chandra, V. Alexiadis, A. Skabardonis. Traffic Analysis Toolbox Volume II: Decision Support Methodology for Selecting Traffic Analysis Tools. Publication FHWA-HRT-04-039, Federal Highway Administration, U.S. Department of Transportation, Washington, D.C., June 2004.)
3.1 Analysis Tool Categories
This section provides an overview of the various categories of traffic analysis tools in order to provide guidance to users in selecting the appropriate analysis tool for their project. The section below will describe the typical features of each tool category as well as each tool class’s strengths and limitations. Guidance on what inputs to consider adjusting and how to make tools function better for work zone traffic analysis projects are provided in Chapter 4.
As outlined in the Traffic Analysis Toolbox Volume I: Traffic Analysis Tools Primer and Volume VIII: Work Zone Modeling and Simulation – A Guide for Decision-Makers, numerous traffic analysis methodologies and tools have been developed by public agencies, vendors, research organizations, and consultants. (Hardy, M., and K. Wunderlich. Traffic Analysis Toolbox Volume VIII: Work Zone Modeling and Simulation – A Guide for Decision-Makers. Publication FHWA-HOP-08-029, Federal Highway Administration, U.S. Department of Transportation, Washington, D.C., August 2008. Alexiadis, V., K. Jeannotte, and A. Chandra. Traffic Analysis Toolbox Volume I: Traffic Analysis Tools Primer. Publication FHWA-HRT-04-038, Federal Highway Administration, U.S. Department of Transportation, Washington, D.C., June 2004.) These traffic analysis tools can be categorized into seven types, in order of increasing complexity:
- Sketch-planning tools;
- Analytical/deterministic tools (HCM-based);
- Travel demand models;
- Traffic signal optimization tools;
- Macroscopic simulation models;
- Mesoscopic simulation models; and
- Microscopic simulation models.
For the purpose of the guidance following this chapter, sketch-planning and analytical/deterministic tools will be combined into a single category referred to as sketch-planning and analytical/deterministic tools.
There are many factors that go into determining which tool is right for the job, and there is no “one-size-fits-all” approach. More than one tool might be needed to address the analysis needs, particularly as the project progresses from planning to design to construction. As shown in Figure 5, the higher the level of detail needed from the analysis, the higher the level of resources are required to make successful use of a particular tool. (Hardy, M., and K. Wunderlich. Traffic Analysis Toolbox Volume IX: Work Zone Modeling and Simulation – A Guide for Analysts. Publication FHWA-HOP-09-001, Federal Highway Administration, U.S. Department of Transportation, Washington, D.C., March 2009.)
Figure 5. Analytical Work Zone Decision Framework – Modeling Approaches
(Source: Hardy and Wunderlich, 2009.)
Sketch-Planning Tools
Sketch-planning methodologies and tools produce general order-of-magnitude estimates of travel demand and traffic operations in response to transportation changes. Often, sketch-planning tools are based upon simple queuing techniques or volume-to-capacity relationships from the Highway Capacity Manual (HCM). Sketch-planning tools perform some or all of the functions of other analytical tool types, using simplified analyses techniques and highly aggregated data. They typically are the simplest and least costly of the traffic analysis tools.
The strength of sketch-planning tools rests upon their relative ease of use and ability to facilitate a rapid analysis. Typically, a sketch-planning tool requires fewer resources and less staff training to deploy than a mesoscopic or microscopic simulation model, since they are simpler in terms of data requirements, calibration, and interpretation of the results. Regarding work zones, an analysis using a sketch-planning tool is normally quite rapid, including both the input of the data and the model run time. This is important in cases where a decision needs to be made quickly; or the agency desires a less resource-intensive analysis (e.g., for a project with a modest level of expected work zone impacts).
The weaknesses of sketch-planning tools are their limited network complexity and inability to generate potential network impacts, inability to consider vehicle interactions, and high-level analysis. For example, QUEWZ-98 only allows simple “pipeline” analysis without the ability to model cross-streets and detour routes. However, some of the more complex sketch-planning tools (e.g., QuickZone) do include the ability to model a detour route. In the end, the results from any sketch-planning tool will be relatively high-level (e.g., average or maximum queue).
Table 1 lists some general pros and cons of using sketch-planning tools for work zone traffic analysis.
Table 1. Pros and Cons of Sketch-Planning Tools for WZTA
| Pros |
Cons |
- Easy to use
- Low cost
- Quick results
- Low complexity
- Less data intensive
- Reduced technical skill set
- Easy interpretation of results
|
- Order-of-magnitude output
- Limited network complexity
- Limited presentation capabilities
- Low-analytical robustness
- Traffic diversion typically not modeled explicitly
|
A list of sketch-planning tools can be found in the Traffic Analysis Toolbox Volume I: Traffic Analysis Tools Primer. (Alexiadis, V., K. Jeannotte, and A. Chandra. Traffic Analysis Toolbox Volume I: Traffic Analysis Tools Primer. Publication FHWA-HRT-04-038, Federal Highway Administration, U.S. Department of Transportation, Washington, D.C., June 2004.)
Sketch Planning in Work Zone Traffic Analysis – QuickZone
Maryland/Virginia Woodrow Wilson Bridge: I-95 (Mitretek Systems. QuickZone Case Studies: The Application of QuickZone in Eight Common Construction Projects. Publication FHWA-HOP-09-054, Federal Highway Administration, U.S. Department of Transportation, Washington, D.C., October 2004.)
(Source: Mitretek Systems, 2004.)
The Woodrow Wilson Bridge Project involved the replacement of the existing six-lane bridge with a dual-span bridge that increases the number of traffic lanes. The original construction staging plan included lane closures during overnight hours (12:00 a.m.-4:00 a.m.) and two temporary openings in the median barrier to divert traffic around the construction area. This work zone plan would result in a construction duration of four to six months. However, the contractor noted that this original closure duration was insufficient. The contractors requested a larger construction time window for set-up, as well as production time. Therefore, alternative staging plans were evaluated.
QuickZone was used to analyze various construction staging scenarios to choose an optimal alternative that could take place without causing severe mobility impacts. QuickZone was chosen because: 1) it could analyze multiple scenarios quickly; 2) MD SHA already had their own customized version of the tool; and 3) it generates the exact performance measures the agency needed for the analysis. The results of the analysis showed that time for lane closures can be extended to hours between 9:00 p.m. and 5:00 a.m. without significant impacts to motorists.
Woodrow Wilson Bridge QuickZone Network

(Source: Mitretek Systems, 2004.)
Analytical/Deterministic Tools (HCM-Based)
HCM procedures are capable of analyzing facility performance (capacity, density, speed, delay, and queuing) as a function of demand, geometry, and traffic controls. These methods and tools usually provide quick results. They are reliable for predicting whether a facility will be operating above or below capacity and they have been well tested through significant field-validation efforts. HCM procedures are generally limited in their ability to evaluate system effects and vehicle interactions. Most of the HCM methods and models assume that the operation of one intersection or road segment is not adversely affected by conditions on the adjacent roadway. Therefore, HCM procedures are of limited value in analyzing the effects of queuing.
Table 2 lists some general pros and cons of using analytical/deterministic tools for work zone traffic analysis.
Table 2. Pros and Cons of Analytical/Deterministic Tools for WZTA
| Pros |
Cons |
- Widely used and trusted
- Typically can be performed by in-house staff
- Quick analysis time
- Reduced technical skill set
- Reduced analysis costs
|
- Cannot assess systemwide impacts
- Not well suited for high levels of congestion
- Unable to reflect atypical roadway geometries
- Unable to analyze transitions in operations between one system state and another (e.g., unable to analyze transition from noncongested to congested conditions)
|
Analytical/Deterministic Tools in Work Zone Traffic Analysis – FREEVAL
I-40, Wake County, North Carolina (Schroeder, B.J., and N. Rouphail. Estimating the Operational Impacts of Freeway Work Zones on Extended Facilities. In Transportation Research Record: Journal of the Transportation Research Board, No. 2169, Transportation Research Board of the National Academies, Washington, D.C., 2010, pages 70-80.)
FREEVAL was the selected tool used in the I-40 project in Wake County, North Carolina. This project evaluated the impacts of a work zone where a lane was added in each direction along four miles of the Interstate between State Road 1728 and the interchange with I-440/U.S. I-64. In planning for this project, two work zone configurations were considered: 1) a two-lane pattern representing day-time operations during the work zone construction where work will be completed behind barriers while maintaining all travel lanes open for traffic; and 2) an off-peak lane closure with nighttime construction that would require full closure of several travel lanes, leaving only one lane open to traffic. A total of six scenarios were modeled using these two work zone configurations in conjunction with other strategies.
FREEVAL was used to evaluate the mobility impacts of the scenarios. FREEVAL was chosen due to its ability to measure the impacts of freeway ramps and weaving segments, ease of use and accessibility, and its ability to generate performance measures, as well as graphical outputs helpful for analysis. The analysis measures reported were average travel time, mainline travel speed, total system delay, maximum queue length, and number of un-served vehicles left on the facility after the analysis time period. The FREEVAL analysis showed the impacts of work zone speed reductions, barriers, and nighttime lane closures on speeds, travel times, and vehicle queues.
FREEVAL (HCM 2000) Network
(Source: Schroeder and Rouphail, 2010.)
A list of HCM methodologies can be found in the Traffic Analysis Toolbox Volume I: Traffic Analysis Tools Primer. (Alexiadis, V., K. Jeannotte, and A. Chandra. Traffic Analysis Toolbox Volume I: Traffic Analysis Tools Primer. Publication FHWA-HRT-04-038, Federal Highway Administration, U.S. Department of Transportation, Washington, D.C., June 2004.)
Travel Demand Models
Travel demand models have specific analytical capabilities, such as the prediction of travel demand and the consideration of destination choice, mode choice, time-of-day travel choice, and route choice. These are mathematical models that forecast future travel demand based on current conditions, and future projections of household and employment characteristics. Traditionally, they are large regional planning models used by metropolitan planning organizations (MPO) and were originally developed to determine the benefits and impacts of major highway improvements in metropolitan areas. A distinguishing feature of travel demand models is their geographic coverage, which generally includes an entire metropolitan area: a city, its suburbs, and the adjacent counties.
For work zone analysis, a strength offered by travel demand models is their ability to predict areawide traffic redistribution. For example, if an agency is considering closing an important urban, freeway-to-freeway interchange for several months while it is rebuilt, a travel demand model could help evaluate the overall changes in total daily traffic volumes on various roadways throughout the region. Another important consideration is that most major metropolitan areas already have an established travel demand model, which could be used either as the sole analysis tool, or as a foundation for developing a transportation network for another model type.
However, travel demand models have limited capabilities to estimate accurate changes in operational characteristics (such as speed, delay, and queuing), resulting from the implementation of operational strategies and changes (including the effects associated with roadwork construction). Because these models are prepared at a broad regional scale, they lack detail that may be critical to the analysis objective. For example, they may model only one or two time periods (such as the AM peak hour or the daily average), which may not be sufficient for analyzing time-specific work zone traffic management strategies.
Table 3 lists some general pros and cons of using travel demand models for work zone traffic analysis.
Table 3. Pros and Cons of Travel Demand Models for WZTA
| Pros |
Cons |
- Low cost (assuming readily available regional model)
- Able to predict areawide traffic redistribution
- Able to predict mode choice, destination choice, time-of-day travel choice, route choice, trip generation
- Useful for large-scale, long-term projects
|
- Only accounts for recurring congestion conditions
- Unable to accurately evaluate operational strategies such as ITS
- Less useful for small-scale, short-term work zones
- Limited accuracy for intersection turning movements
- Not suitable for time-specific work zone analysis
- High-technical skill set
- Assumes network is operating in equilibrium
|
Travel Demand Modeling in Work Zone Traffic Analysis – TRANPLAN
Cleveland Innerbelt Project
The Cleveland Innerbelt Project was a rehabilitation and reconstruction project of the Innerbelt Freeway system, which includes Interstates 71 and 90. A maintenance of traffic alternatives analysis was conducted in order to evaluate traffic detour routes and a full closure work zone configuration during the rehabilitation/reconstruction effort. Several alternatives were analyzed such as reduction in the capacity of travel lanes along various segments of the Innerbelt, as well as the full closure of the Central Viaduct Bridge.
TRANPLAN, the regional travel demand model was used to simulate and measure the impacts of the traffic assignments and diversion that would take place as a result of the various work zone alternatives considered. TRANPLAN was used for a variety of reasons including its ease of use, accessibility (the model was already developed) and ability to generate the required performance measures needed for the analysis.
Portion of Cleveland Innerbelt TRANPLAN Network
A list of travel demand models can be found in the Traffic Analysis Toolbox Volume I: Traffic Analysis Tools Primer. (Alexiadis, V., K. Jeannotte, and A. Chandra. Traffic Analysis Toolbox Volume I: Traffic Analysis Tools Primer. Publication FHWA-HRT-04-038, Federal Highway Administration, U.S. Department of Transportation, Washington, D.C., June 2004.)
Traffic Signal Optimization Tools
Traffic signal optimization tools are primarily designed to develop optimal signal phasing and timing plans for signalized intersections, arterial streets, or signal networks. This may include capacity calculations; cycle length; splits optimization, including left turns; and coordination/offset plans. With respect to work zones, traffic signal optimization tools are useful when developing a signal plan for a temporary traffic signal, or analyzing signal plans when a detour route directs traffic to an existing signalized arterial roadway.
The primary limitation of traffic signal optimization tools is their single focus. Traffic signal optimization tools are typically used to provide supplementary analysis when analyzing the overall mobility impacts of a work zone.
Table 4 lists some general pros and cons of using traffic signal optimization tools for work zone traffic analysis.
Table 4. Pros and Cons of Traffic Signal Optimization Tools for WZTA
| Pros |
Cons |
- Useful for temporary and permanent traffic signal design
- Relatively quick analysis
- Widely used and trusted
- Capable of signal optimization
|
- Requires detailed traffic signal design expertise
- Not well suited for freeway operations
- Not well suited to analyze oversaturated conditions
|
Traffic Signal Optimization Tools in Work Zone Traffic Analysis – Synchro/SimTraffic
Eastern Avenue Bridge Reconstruction over Kenilworth Avenue (Bhajandas, A, J. Mallela, and P. Littleton. Reconstruction of Eastern Avenue Bridge Over Kenilworth Avenue in Washington, D.C. Federal Highway Administration, U.S. Department of Transportation, August 2011. Accessed January 11, 2012.)
Synchro/SimTraffic was used to evaluate various detour options for the reconstruction of the Eastern Avenue Bridge over Kenilworth Avenue, N.E. in Washington, D.C. The bridge needed to be rebuilt in order to provide additional clearance height for trucks and to provide a safer travel route for all vehicles.
Initially, the Maryland State Highway Administration’s Lane Closure Analysis Program (LCAP) was used to evaluate the queues of the lane closures along Kenilworth Avenue. However, the tool could not capture the impacts of diversions/detours to other routes. Therefore, Synchro/SimTraffic was used in order to incorporate the potential for diversion when assessing the mobility impacts of the work zone. The preferred alternative in this project was to detour one of the three Kenilworth Avenue mainline lanes in each direction onto the service road and keep two shifted lanes in each direction. This alternative required closing the bridge. The bridge closures required detours via the “local” lanes of the service roads via Nannie Helen Burroughs Avenue and via the U.S. 50 interchange. A U-turn lane and special signal timing schemes were evaluated for the Nannie Helen Burroughs Avenue interchange using Synchro and SimTraffic. Using the results from the analysis, each alternative was compared economically for construction and user costs.
Diversion Routes on Kenilworth Avenue
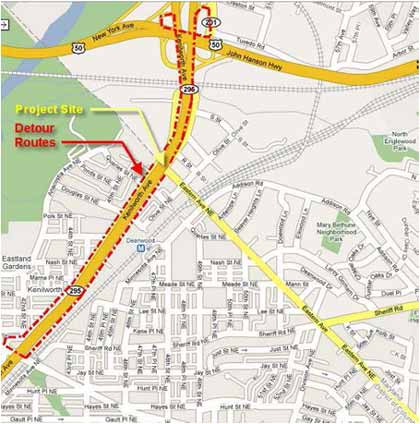
(Source: Bhajandas, Mallela, and Littleton, 2011.)
A list of traffic signal optimization tools can be found in the Traffic Analysis Toolbox Volume I: Traffic Analysis Tools Primer. (Alexiadis, V., K. Jeannotte, and A. Chandra. Traffic Analysis Toolbox Volume I: Traffic Analysis Tools Primer. Publication FHWA-HRT-04-038, Federal Highway Administration, U.S. Department of Transportation, Washington, D.C., June 2004.)
Macroscopic Simulation Models
Macroscopic simulation models are based on the deterministic relationships of the flow, speed, and density of the traffic stream. The simulation in a macroscopic model takes place on a section-by-section basis, meaning they treat traffic flows as an aggregated quantity; they do not model the movement of individual vehicles on a network.
Similar to travel demand models, macroscopic models have the ability to model a large geographic area. This is particularly useful when the work zone impacts may affect a larger corridor or region, such as in the case of a full closure. They also can be set up and run fairly quickly due to the fact that they simulate aggregate flows. The primary limitation of macroscopic models is their simple representation of traffic movement, which limits the fidelity of the results.
Table 5 lists some general pros and cons of using macroscopic simulation models for work zone traffic analysis.
Table 5. Pros and Cons of Macroscopic Simulation Models for WZTA
| Pros |
Cons |
- Able to model large geographic areas
- Short simulation runtime
- Easier to calibrate than mesoscopic and microscopic models
- Medium technical skill set
|
- Simple representation of traffic movement
- Limited network complexity
- Traffic diversion not modeled explicitly
- Unable to accurately evaluate operational strategies like ITS
|
Macroscopic Simulation in Work Zone Traffic Analysis – NetZone
SR 41 Fresno Corridor Construction Work Zone Traffic Impact Study (Zhang, M. Managing Construction Work Zone Traffic with NetZone. Caltrans Research Connection Presentation, April 2007. Accessed January 11, 2012.)
NetZone was used on a case study along SR 41 in Fresno, California. This project involved weekend, daytime construction where two of the three lanes along the highway and one on-ramp upstream of the work zone would be closed to traffic. The work zone length was about four miles and the construction duration would last from 3:35 to 4:35 p.m. when construction efforts were active. The impacts of three scenarios were evaluated. The first scenario was the precondition or base case scenario. The second assessed the mobility impacts of the work zone if there were no traffic management plans. The third scenario assessed the impacts when pre-trip information and a media campaign were implemented as part of the work zone.
NetZone was used to evaluate measures such as travel time, delay, queues, and traffic diversion. The advantages of NetZone includes its user-friendliness, versatility to account for various factors and strategies (including demand changes, route diversions, ITS strategies, and traveler information), and detailed statistics. Because it is a macroscopic simulation tool, it requires less computation time and resources than more complex tools such as microsimulation, while still providing a dynamic modeling option to capture peak spreading and queuing within the network.
SR 41 Network
(Source: Zhang, 2007.)
A list of macroscopic simulation models can be found in the Traffic Analysis Toolbox Volume I: Traffic Analysis Tools Primer. (Alexiadis, V., K. Jeannotte, and A. Chandra. Traffic Analysis Toolbox Volume I: Traffic Analysis Tools Primer. Publication FHWA-HRT-04-038, Federal Highway Administration, U.S. Department of Transportation, Washington, D.C., June 2004.)
Mesoscopic Simulation Models
Mesoscopic simulation models combine the properties of both microscopic and macroscopic simulation models. As in microscopic models, the mesoscopic models’ unit of traffic flow is the individual vehicle. Their movement, however, follows the approach of the macroscopic models and is typically governed by the average speed on the travel link. Mesoscopic model travel simulation takes place on an aggregate level and does not consider dynamic speed/volume relationships. As such, mesoscopic models provide less fidelity than the microsimulation tools, but are superior to the typical planning analysis techniques. The primary strength of mesoscopic simulation models, when analyzing work zones, includes the ability to model both large geographic areas and corridors. In addition, they are capable of dynamic traffic assignment (DTA) and can readily be used to predict route diversions, temporal demand shifts, and even modal shifts in some cases.
Mesoscopic simulation models do have a number of weaknesses. One is their limited ability to model detailed operational strategies, such as complex signal control. Thus, if a work zone includes a number of signalized intersections, a different type of model (such as a microscopic simulation model or traffic signal optimization tool) may be a better choice. Another drawback is the overall model complexity and data requirements necessary for accurate results. Mesoscopic models are an order of magnitude more complex than the most sophisticated sketch-planning tools; require similar amounts of data (albeit at a more granular level) as regional planning models; and similar resources (time, money, and knowledge) as travel demand models and microscopic simulation models.
Table 6 lists some general pros and cons of using mesoscopic simulation analysis for work zone traffic analysis.
Table 6. Pros and Cons of Mesoscopic Simulation Models for WZTA
| Pros |
Cons |
- Capable of measuring corridor or areawide impacts
- Capable of dynamic routing
- Detailed temporal analysis
- Captures nonrecurring and operational strategies
- Less intensive than micro, and more refined than macro
|
- Resource intensive (data, cost, expertise, analysis time)
- Typically link, not lane-based impacts
- Not all are capable of reflecting detailed traffic signal parameters
- High-technical skill set
|
Mesoscopic Simulation in Work Zone Traffic Analysis – DynusT
Dynamic Traffic Assignment Application: I-10 Corridor Study, Tucson Arizona (Zou, N., K. Nguyen, and J. Schoen. DTA Application: I-10 Corridor Study. Tucson, Arizona, June 2010.)
The I-10 Corridor Project provides freeway and interchange improvement along a five-mile segment of I-10. Improvements associated with the project include road widening and reconstruction of four interchanges along I-10, converting them from overpasses to underpasses. During the planning stages of the project, DTA modeling was used in order to develop a design concept and preliminary plans for the project. Using mesoscopic simulation software, DynusT, DTA modeling was performed for three phases of the project development process – capacity analysis, construction sequencing, and evaluation of work zone traffic control. It will also be used to evaluate work zone strategies during the final design in 2012.
The DynusT model was created using a regional TransCAD travel demand model. Signal data and intersection geometry were imported into the DynusT model from a regional Synchro model. These two steps were automated with conversion tools. Manual fine-tuning was also conducted to correct signal phasing/timing, geometry, posted speed limit, etc. as necessary. The measures of effectiveness (MOE) used in ranking alternatives included travel time, volume-to-capacity (v/c) ratio, and average speed.
DynusT was chosen for the following reasons:
- A preliminary model was already available from local agency;
- DTA modeling in DynusT allows for greater accuracy, more realistic results, and capabilities for analysis at the corridor and regional level; and
- Capabilities for evaluating various work zone alternatives.
DynusT Network of I-10 Project
(Source: Zou, Nguyen, and Schoen, 2010.)
A list of mesoscopic simulation models can be found in the Traffic Analysis Toolbox Volume I: Traffic Analysis Tools Primer. (Alexiadis, V., K. Jeannotte, and A. Chandra. Traffic Analysis Toolbox Volume I: Traffic Analysis Tools Primer. Publication FHWA-HRT-04-038, Federal Highway Administration, U.S. Department of Transportation, Washington, D.C., June 2004.)
Microscopic Simulation Models
Microscopic models simulate the movement of individual vehicles based on car-following and lane-changing theories. Typically, vehicles enter a transportation network using a statistical distribution of arrivals (a stochastic process) and are tracked through the network over small time intervals (e.g., one second or a fraction of a second). Typically, upon entry, each vehicle is assigned a destination, a vehicle type, and a driver type. Computer time and storage requirements for microscopic models are large, usually limiting the network size and the number of simulation runs that can be completed.
Microscopic simulation models were developed to represent transportation systems accurately at the individual vehicle level. They simulate the movement of individual vehicles based on car-following and lane-changing theories and other parameters. Microscopic simulation models update the positions and intentions of individual vehicles every second (or fraction of a second) as they move through a network. To account for the diversity of vehicles and driving styles that are encountered in real-world traffic, each vehicle is assigned a set of characteristics that influence the way it responds to the presence of other vehicles and to traffic control devices. Many transportation agencies currently use microscopic models, in conjunction with travel demand models, to better understand the impact of roadway geometry modifications on LOS and carrying capacity.
Microscopic simulation models are effective in evaluating a wide range of scenarios, including heavily congested conditions, complex geometric configurations, and system-level impacts of proposed transportation improvements that are beyond the limitations of other model types. While practical considerations may limit the geographic coverage of a microscopic simulation model, these models are useful in analyzing key bottlenecks on roadway segments and corridors, where the movement of each individual vehicle needs to be represented to better understand the impact on roadway conditions.
The primary limitation of microscopic simulation models is the substantial amount of roadway geometry, traffic control, and traffic pattern data they require. Specialized training for staff is needed and the model development time is often lengthy, particularly when performing calibration of oversaturated conditions. In addition, microsimulation models do not directly calculate LOS and delay consistent with the HCM control delay definition, which can be difficult for decision-makers who have relied on this information in the past.
Table 7 lists some general pros and cons of using microscopic simulation analysis for work zone traffic analysis.
Table 7. Pros and Cons of Microscopic Simulation Models for WZTA
| Pros |
Cons |
- Detailed design level
- Complex geometric configurations
- Operational impacts
- Static or dynamic
- Able to model oversaturated conditions
- Able to model key bottlenecks
- Good visualization capability (for both technical and lay persons)
- Wide range of performance measures
- Local and systemwide impacts
|
- Resource intensive (data, cost, expertise, analysis time)
- Restricted to corridor or smaller study areas
- Unfamiliar to decision-makers (produces different performance measures different from traditional HCM-based tools)
- Requires “tricks” to mimic work zone conditions
- High-technical skill set
|
Microscopic Simulation in Work Zone Traffic Analysis – CORSIM
I-80 Reconstruction Project, Iowa County, Iowa (Schrock, D., and T. Maze. Evaluation of Rural Interstate Work Zone Traffic Management Plans in Iowa Using Simulation. Proceedings of the Mid-Continent Transportation Symposium, Iowa State University, Ames, 2000.)
The Interstate 80 project in Iowa County, Iowa included a six-mile pavement reconstruction of four traffic lanes along I-80. The construction lasted from May 31, 1997 until September 13, 1997, where the Interstate was modified into a two-lane, two-way operation configuration. Using CORSIM, the impacts of four work zone alternatives were analyzed:
- Do-nothing alternative;
- Non-stop work alternative (chosen alternative);
- Four traffic lanes throughout the work zone; and
- Diversion route alternative.
Microscopic simulation was used to determine the amount of motorist delay associated with each alternative. Microscopic simulation Traffic Software Integrated System (TSIS-CORSIM) was chosen for the analysis because of its ability to simulate a work environment and provide the measures of effectiveness needed to effectively compare alternative traffic management plans. It also provided data required for benefit/cost analyses that would be difficult to obtain from other sources. Monetary values of delays were used to evaluate and compare alternatives.
I-80 Work Zone Location and Diversion Routes
(Source: Schrock and Maze, 2000.)
A list of microscopic simulation models can be found in the Traffic Analysis Toolbox Volume I: Traffic Analysis Tools Primer. (Alexiadis, V., K. Jeannotte, and A. Chandra. Traffic Analysis Toolbox Volume I: Traffic Analysis Tools Primer. Publication FHWA-HRT-04-038, Federal Highway Administration, U.S. Department of Transportation, Washington, D.C., June 2004.)
3.2 Key Factors for Selecting the Analysis Tool(s)
Work zone impacts analysis may involve a high-level, qualitative review for some projects; or a detailed, quantitative analysis using modeling and/or simulation tools for other projects. Tool selection is critical in ensuring the most appropriate analysis results for decision-makers to make an informed judgment. The key to successful work zone analysis does not depend only on selecting the suitable transportation modeling approach, but also on successful integration of data and tools to provide a meaningful assessment of work zone impacts relevant to one or more key project decisions. One of the first and most critical steps in selecting a work zone traffic analysis tool is to identify the objectives of the analysis and the desired outcome(s). In order to achieve those objectives and make an informed decision, it is critical for a work zone analyst to consider a number of key factors before selecting a traffic analysis tool. As described in both Traffic Analysis Toolbox Volume IX: Work Zone Modeling and Simulation – A Guide for Analysts (Hardy, M., and K. Wunderlich. Traffic Analysis Toolbox Volume IX: Work Zone Modeling and Simulation – A Guide for Analysts. Publication FHWA-HOP-09-001, Federal Highway Administration, U.S. Department of Transportation, Washington, D.C., March 2009.) and Traffic Analysis Toolbox Volume II: Decision Support Methodology for Selecting Traffic Analysis Tools, (Jeannotte, K., A. Chandra, V. Alexiadis, A. Skabardonis. Traffic Analysis Toolbox Volume II: Decision Support Methodology for Selecting Traffic Analysis Tools. Publication FHWA-HRT-04-039, Federal Highway Administration, U.S. Department of Transportation, Washington, D.C., June 2004.) the key factors in determining the appropriate tool can be broadly categorized into seven major areas: 1) project stages; 2) facility types; 3) tool features; 4) agency resources; 5) work zone characteristics; 6) transportation management plan; and 7) performance measures.
Within each of the key factors are important questions that the analyst should consider when identifying the appropriate tool for the project. A scoping work sheet such as the one featured in Traffic Analysis Toolbox Volume IX (Hardy, M., and K. Wunderlich. Traffic Analysis Toolbox Volume IX: Work Zone Modeling and Simulation – A Guide for Analysts. Publication FHWA-HOP-09-001, Federal Highway Administration, U.S. Department of Transportation, Washington, D.C., March 2009.) and Figure 6, organizes these key questions and considerations by each key factor.
A similar work sheet can be developed with the recommended key factors aforementioned to use as a tool for documenting the various components of a work zone project that needs to be analyzed using a transportation analysis tool. These work sheets are intended to be used as a supplemental guide for tool selection. They should be used in conjunction with other important considerations that may be specific to the agency or the project when choosing a specific modeling approach(es)/tool(s).
This chapter discusses the strategic framework to identify an appropriate transportation modeling approach and analysis tool(s). The chapter provides step-by-step guidance to assist the analyst in determining the suitable tool(s) to perform work zone analysis. A hypothetical case study also is provided in order to demonstrate the application of each step. Figure 7 illustrates the steps involved to assist the analyst identify the most appropriate modeling approaches. In total, seven criteria are necessary to help identify the analytical tools that are most appropriate for a particular project. Depending on the analytical context and the project’s goals and objectives, the relevance of each criterion may differ. The criteria include:
- Project Stages – Ability to perform analysis under the specific project stage, including planning, preliminary engineering/design (PE/Design), and construction stages.
- Facility Types – Capability of modeling various facility types, such as freeways, ramps, arterials, intersections, high-occupancy vehicle (HOV) lanes, toll plazas, etc.
- Tool Features – Ability to provide features such as mode split estimation and animation. Other features include ease of use and whether the tool is popular and well trusted.
- Agency Resources – Ability to meet agency resources that are required for analysis, including technical skills, tool capital cost, schedule/time, hardware, and data requirements.
- Work Zone Characteristics – Ability to analyze the appropriate work zone type, work zone network configuration, work zone size, and work zone analysis area (study area).
- Transportation Management Plan (TMP) –Ability to analyze various traffic management strategies and applications, such as temporary traffic control, motorist information, corridor management, and incident management.
- Performance Measures – Ability to produce and output performance measures, such as travel time, delay, queue length, speed, volume, level of service (LOS), vehicle hours of travel (VHT), emissions, and fuel consumption.
The tool relevance to each of the seven criteria presented in this section is for the general tool type, not individual tools. Certain tools within a tool type may have advanced features or capabilities that majority of the others within the same tool type do not have. The analyst may revise the tool relevance when justified.
Figure 6. Work Zone Analysis Scoping Work Sheet
(Source: Hardy and Wunderlich, 2009.)
Figure 7. Framework for Identifying Appropriate Modeling Approach for Work Zones
Project Stages
One of the initial steps in selecting a transportation analysis tool and modeling approach will be to identify the key decisions that need to be supported during the analysis. These key decisions should include scheduling decisions (time of day, time of year, duration, etc.); application decisions; and transportation management plan decisions. Additionally, the analyst also should consider how these key decisions would differ based upon the project stage (planning, design, or construction) of the project or decision-making process. The three stages of the decision-making process are shown in Figure 8. Further information about these three stages in the decision-making process is provided in the FHWA’s Traffic Analysis Toolbox Volume VIII: Work Zone Modeling and Simulation – A Guide for Decision-Makers. (Work Zone Safety and Mobility. Maryland State Highway Administration (MD SHA), Maryland. Accessed January 11, 2012.) The decision-making process evolves over time, and the decisions made in the initial stage will have a direct impact on forthcoming stages. For example, while making decisions at the planning stage, careful considerations should be made taking into account the preliminary engineering/design (PE/Design) and construction stages. Because these may change depending on where the project is in the process, certain tool classes may be better suited for certain key decisions involved in a particular stage than others. Table 8 presents the relevance of each tool class to the different project stages.
Figure 8. Work Zone Decision-Making Process
(Source: Hardy and Wunderlich, 2008.)
Table 8. Project Stages
| Factors – Project Stages |
Transportation Modeling Approach |
| Sketch-Planning and HCM |
Travel Demand Models |
Traffic Signal Optimization |
Macroscopic Simulation |
Mesoscopic Simulation |
Microscopic Simulation |
| Planning |
Specific context is generally addressed by tools in this category |
Specific context is generally addressed by tools in this category |
Tools within this category do not generally address the specific context |
Some of tools in this category address the specific context but some do not |
Some of tools in this category address the specific context but some do not |
Tools within this category do not generally address the specific context |
| PE/Design |
Some of tools in this category address the specific context but some do not |
Some of tools in this category address the specific context but some do not |
Specific context is generally addressed by tools in this category |
Specific context is generally addressed by tools in this category |
Specific context is generally addressed by tools in this category |
Specific context is generally addressed by tools in this category |
| Operations/Construction |
Some of tools in this category address the specific context but some do not |
Tools within this category do not generally address the specific context |
Specific context is generally addressed by tools in this category |
Specific context is generally addressed by tools in this category |
Specific context is generally addressed by tools in this category |
Specific context is generally addressed by tools in this category |
Facility Types
This factor includes the various facility types that will be included in the analysis area. An analysis can include a multitude of facility types such as freeways, arterials, ramps, and auxiliary lanes, among others. A full list and description of each facility type is provided in Table 9.
Tool Features
This factor includes various tool features such as mode split estimation and animation. Certain tool classes may offer additional capabilities or features that would allow the agency to optimize their modeling process. Some of these tool features that may be considered include:
- Mode Split – It evaluates whether the tool provides estimation on percentage of travelers using each travel mode (SOV, HOV, transit, bicycle, pedestrian, etc.).
- Ease of Use – It evaluates whether the tool is generally user-friendly.
- Popular/Well Trusted – It evaluates whether the tool is popular and well regarded by current users.
- Animation/Presentation – This factor evaluates whether the tool has animation/presentation features such as colorful three-dimensional views and simulation video clips.
Table 10 provides a summary of these tool features for each specific modeling approach.
Table 9. Facility Types
| Factors – Facility Types |
Summary |
Transportation Modeling Approach |
| Sketch-Planning and HCM |
Travel Demand Models |
Traffic Signal Optimization |
Macroscopic Simulation |
Mesoscopic Simulation |
Microscopic Simulation |
| Isolated Intersection |
Single crossing point between two or more roadway facilities. |
Some of tools in this category address the specific context but some do not |
Some of tools in this category address the specific context but some do not |
Specific context is generally addressed by tools in this category |
Some of tools in this category address the specific context but some do not |
Specific context is generally addressed by tools in this category |
Specific context is generally addressed by tools in this category |
| Roundabout |
Unsignalized intersection with a circulatory roadway with entering vehicles yielding to traffic. |
Some of tools in this category address the specific context but some do not |
Tools within this category do not generally address the specific context |
Tools within this category do not generally address the specific context |
Some of tools in this category address the specific context but some do not |
Some of tools in this category address the specific context but some do not |
Specific context is generally addressed by tools in this category |
| Arterial |
Signalized street that may serve through traffic and/or provide access to abutting properties. |
Some of tools in this category address the specific context but some do not |
Specific context is generally addressed by tools in this category |
Specific context is generally addressed by tools in this category |
Specific context is generally addressed by tools in this category |
Specific context is generally addressed by tools in this category |
Specific context is generally addressed by tools in this category |
| Highway |
High-speed roadway connecting major areas or arterials, with little to no traffic signal operations. |
Specific context is generally addressed by tools in this category |
Specific context is generally addressed by tools in this category |
Some of tools in this category address the specific context but some do not |
Specific context is generally addressed by tools in this category |
Specific context is generally addressed by tools in this category |
Specific context is generally addressed by tools in this category |
| Freeway |
Multilane, divided highway with a minimum of two lanes in each direction, no traffic signal interruption. |
Specific context is generally addressed by tools in this category |
Specific context is generally addressed by tools in this category |
Some of tools in this category address the specific context but some do not |
Specific context is generally addressed by tools in this category |
Specific context is generally addressed by tools in this category |
Specific context is generally addressed by tools in this category |
| HOV Lane |
Exclusive lane for vehicles with a defined minimum number of occupants (more than one), including buses, taxis, or carpools. |
Some of tools in this category address the specific context but some do not |
Specific context is generally addressed by tools in this category |
Tools within this category do not generally address the specific context |
Specific context is generally addressed by tools in this category |
Specific context is generally addressed by tools in this category |
Specific context is generally addressed by tools in this category |
| Ramp |
Segment of roadway connecting two roadway facilities. |
Some of tools in this category address the specific context but some do not |
Specific context is generally addressed by tools in this category |
Some of tools in this category address the specific context but some do not |
Specific context is generally addressed by tools in this category |
Specific context is generally addressed by tools in this category |
Specific context is generally addressed by tools in this category |
| Auxiliary Lane |
Additional lane on a freeway connecting an on-ramp and an off-ramp. |
Some of tools in this category address the specific context but some do not |
Tools within this category do not generally address the specific context |
Some of tools in this category address the specific context but some do not |
Some of tools in this category address the specific context but some do not |
Specific context is generally addressed by tools in this category |
Specific context is generally addressed by tools in this category |
| Truck Lane |
Designated lane for commercial vehicles, but not for public transit vehicles. |
Some of tools in this category address the specific context but some do not |
Specific context is generally addressed by tools in this category |
Some of tools in this category address the specific context but some do not |
Some of tools in this category address the specific context but some do not |
Specific context is generally addressed by tools in this category |
Specific context is generally addressed by tools in this category |
| Bus Lane |
Designated lane for buses during specified periods. |
Tools within this category do not generally address the specific context |
Specific context is generally addressed by tools in this category |
Tools within this category do not generally address the specific context |
Some of tools in this category address the specific context but some do not |
Some of tools in this category address the specific context but some do not |
Specific context is generally addressed by tools in this category |
| Toll Plaza |
Facility where a payment transaction for certain use of the roadway is required. |
Some of tools in this category address the specific context but some do not |
Some of tools in this category address the specific context but some do not |
Tools within this category do not generally address the specific context |
Tools within this category do not generally address the specific context |
Some of tools in this category address the specific context but some do not |
Specific context is generally addressed by tools in this category |
Table 10. Tool Features
| Factors – Tool Features |
Summary |
Transportation Modeling Approach |
| Sketch-Planning and HCM |
Travel Demand Models |
Traffic Signal Optimization |
Macroscopic Simulation |
Mesoscopic Simulation |
Microscopic Simulation |
| Mode Split |
This factor evaluates whether the tool provides percentage of travelers using each travel mode (SOV, HOV, transit, bicycle, pedestrian, etc.). |
Some of tools in this category address the specific context but some do not |
Specific context is generally addressed by tools in this category |
Some of tools in this category address the specific context but some do not |
Some of tools in this category address the specific context but some do not |
Some of tools in this category address the specific context but some do not |
Some of tools in this category address the specific context but some do not |
| Easy to Use |
This factor evaluates whether the tool is generally user-friendly. |
Specific context is generally addressed by tools in this category |
Tools within this category do not generally address the specific context |
Some of tools in this category address the specific context but some do not |
Some of tools in this category address the specific context but some do not |
Tools within this category do not generally address the specific context |
Tools within this category do not generally address the specific context |
| Popular/Well Trusted |
This factor evaluates whether the tool is popular and well regarded by current users. |
Specific context is generally addressed by tools in this category |
Some of tools in this category address the specific context but some do not |
Specific context is generally addressed by tools in this category |
Tools within this category do not generally address the specific context |
Some of tools in this category address the specific context but some do not |
Specific context is generally addressed by tools in this category |
| Animation/Presentation |
This factor describes whether the tool provides capabilities for animation and/or other presentation features. |
Tools within this category do not generally address the specific context |
Some of tools in this category address the specific context but some do not |
Tools within this category do not generally address the specific context |
Some of tools in this category address the specific context but some do not |
Some of tools in this category address the specific context but some do not |
Specific context is generally addressed by tools in this category |
Agency Resources
The extent to which the impacts of a work zone can be analyzed is strongly dependent upon availability of agency resources. It is critical for an analyst to consider the following five factors while determining the suitable analysis approach.
- Technical Skill Requirements – This factor describes the amount of technical knowledge required in order to use the tool. For instance, this factor addresses how much training may be involved in order for agency staff to utilize the tool effectively for the work zone traffic analysis.
- Tool Capital Cost – This factor evaluates the average capital cost to acquire the tool. Tools with an average cost less than $1,000 are considered inexpensive. Those tools within the $1,000-$5,000 range can be considered as mid-range and those with average costs greater than $5,000 are considered to be expensive.
- Time/Schedule Requirements for Analysis – The time or schedule requirements associated with a tool can include how much coding and/or data inputs are required in order to use the tool. It also can include how much computer run time is needed in order to obtain the necessary model output or performance measures using a particular tool.
- Hardware Requirements – The amount of computer power or processing capabilities required in order to run the analysis can influence which tool is best suited for the project.
- Data Requirements – The amount of input data required in order to perform the analysis also can influence what tool is suitable for the project. Input data typically fall under two categories: roadway characteristics and travel demand characteristics. Roadway characteristics data provides information regarding the physical design and operational characteristics of the roadway. Data inputs in this category can include intersection, lane, and road geometric characteristics, traffic control locations, and meter and traffic signal timing plans. Travel demand characteristics describes the vehicle and traffic demand of the system being analyzed and can include data inputs such as Origin-Destination trip tables, trip classifications, traffic volume counts and forecasts.
Table 11. Agency Resources Required for Analysis
| Factors – Agency Resources Required for Analysis |
Transportation Modeling Approach |
| Sketch-Planning and HCM |
Travel Demand Models |
Traffic Signal Optimization |
Macroscopic Simulation |
Mesoscopic Simulation |
Microscopic Simulation |
| Technical Skill Requirements |
Tools without extensive technical skill or extensive training requirements for the analysis |
Tools with extensive technical skill/training requirements for the analysis |
Tools with moderate amount of training and mid-range requirements for the analysis |
Tools with moderate amount of training and mid-range requirements for the analysis |
Tools with extensive technical skill/training requirements for the analysis |
Tools with extensive technical skill/training requirements for the analysis |
| Tool Capital Cost |
Inexpensive tools that do not have extensive requirements for the analysis |
Tools with average costs falling in the medium range and with mid-range requirements for the analysis |
Tools with average costs falling in the medium range and with mid-range requirements for the analysis |
Tools with average costs falling in the medium range and with mid-range requirements for the analysis |
Tools with average costs falling in the medium range and with mid-range requirements for the analysis |
Expensive tools that have extensive requirements for the analysis |
| Schedule/Time Requirements |
Tools that do not require much time for model network preparation and/or computer run time and that do not have extensive requirements for the analysis |
Tools with mid-range time requirements for the analysis |
Tools with mid-range time requirements for the analysis |
Tools with mid-range time requirements for the analysis |
Tools requiring a significant amount of resources and extensive requirements for the analysis |
Tools requiring a significant amount of resources and extensive requirements for the analysis |
| Hardware Requirements |
Tools that do not have extensive hardware (computer power and memory storage) requirements for the analysis |
Tools requiring a significant amount of resources and extensive requirements for the analysis |
Tools that do not have extensive hardware (computer power and memory storage) requirements for the analysis |
Tools with mid-range requirements for the analysis |
Tools requiring a significant amount of resources and extensive requirements for the analysis |
Tools requiring a significant amount of resources and extensive requirements for the analysis |
| Data Requirements |
Tools that do not have extensive data requirements for the analysis |
Tools with mid-range requirements for the analysis |
Tools with mid-range requirements for the analysis |
Tools with mid-range requirements for the analysis |
Tools requiring a significant amount of data inputs and resources and extensive requirements for the analysis |
Tools requiring a significant amount of data inputs and resources and extensive requirements for the analysis |
Work Zone Characteristics
This subsection discusses how the physical attributes of a work zone impacts the type of tool that should be selected for the analysis. The work zone characteristics include the type, the network configuration, size, and the analysis area dimension of the work zone analysis project included in the analysis area, as shown in Table 12. Detailed definitions of these attributes are provided in Traffic Analysis Toolbox Volume IX: Work Zone Modeling and Simulation – A Guide for Analysts (Hardy, M., and K. Wunderlich. Traffic Analysis Toolbox Volume IX: Work Zone Modeling and Simulation – A Guide for Analysts. Publication FHWA-HOP-09-001, Federal Highway Administration, U.S. Department of Transportation, Washington, D.C., March 2009.) and Traffic Analysis Toolbox Volume II. (Jeannotte, K., A. Chandra, V. Alexiadis, A. Skabardonis. Traffic Analysis Toolbox Volume II: Decision Support Methodology for Selecting Traffic Analysis Tools. Publication FHWA-HRT-04-039, Federal Highway Administration, U.S. Department of Transportation, Washington, D.C., June 2004.) Work zone characteristics used in the tool selection methodology include:
- Work Zone Type – As defined in the FHWA’s Work Zone Self Assessment Guide, Work Zone Types I, II, III and IV are indicative of the level of impact a work zone will have on travelers. Agencies may choose their own categories based on level of impact, but typically Type I is more complex and attracts greater public interest than Type II and so on.
- Network Configuration – The network configuration determines the overall complexity of the work zone that will be evaluated. It is composed of the following three general categories:
- Isolated – Single work zone with limited interaction of surrounding infrastructure;
- Pipe – Roadway segment with multiple, interacting work zones; and
- Grid – Connected, interdependent network structure with multiple access points and alternate routes.
- Work Zone Size – This factor includes the actual size of the work zone itself and the immediate area that will be impacted. Work zones are divided into three sizes:
- Small – A work zone implemented on a short segment of an individual roadway or a single intersection;
- Medium – One or more work zones on longer stretches of a single facility and/or portions of adjacent facilities; and
- Large – Interacting work zones implemented on significant elements of a larger roadway network.
- Analysis Area Dimension – Analysis area dimension determines the entire area impacted by the work zone. It is divided into three categories:
- Site – Restricted to the immediate area surrounding the work zone;
- Local – Includes surrounding area beyond the work zone to account for detour routes or other localized impacts; and
- Metropolitan – Includes multiple jurisdictions (counties, cities, etc.) or facilities.
Table 12. Work Zone Characteristics
| Factors – Work Zone Characteristics |
Summary |
Transportation Modeling Approach |
| Sketch-Planning and HCM |
Travel Demand Models |
Traffic Signal Optimization |
Macroscopic Simulation |
Mesoscopic Simulation |
Microscopic Simulation |
| Work Zone Type |
| Type I |
Affects a large number of traveler at the regional scale, with high public interest, significant user cost impacts and a long duration. |
Some of tools in this category address the specific context but some do not |
Specific context is generally addressed by tools in this category |
Some of tools in this category address the specific context but some do not |
Some of tools in this category address the specific context but some do not |
Specific context is generally addressed by tools in this category |
Tools within this category do not generally address the specific context |
| Type II |
Similar to Type I but moderate impact. |
Some of tools in this category address the specific context but some do not |
Some of tools in this category address the specific context but some do not |
Some of tools in this category address the specific context but some do not |
Some of tools in this category address the specific context but some do not |
Specific context is generally addressed by tools in this category |
Some of tools in this category address the specific context but some do not |
| Type III |
Similar to Type I but low impact. |
Specific context is generally addressed by tools in this category |
Tools within this category do not generally address the specific context |
Specific context is generally addressed by tools in this category |
Tools within this category do not generally address the specific context |
Some of tools in this category address the specific context but some do not |
Specific context is generally addressed by tools in this category |
| Type IV |
Short-duration work zone with low visibility and public interest. |
Specific context is generally addressed by tools in this category |
Tools within this category do not generally address the specific context |
Specific context is generally addressed by tools in this category |
Tools within this category do not generally address the specific context |
Tools within this category do not generally address the specific context |
Specific context is generally addressed by tools in this category |
| Work Zone Network Configuration |
| Isolated |
Single work zone with limited interaction of surrounding infrastructure. |
Specific context is generally addressed by tools in this category |
Tools within this category do not generally address the specific context |
Some of tools in this category address the specific context but some do not |
Some of tools in this category address the specific context but some do not |
Some of tools in this category address the specific context but some do not |
Some of tools in this category address the specific context but some do not |
| Pipe |
Roadway segment with multiple, interacting work zones. |
Specific context is generally addressed by tools in this category |
Tools within this category do not generally address the specific context |
Some of tools in this category address the specific context but some do not |
Some of tools in this category address the specific context but some do not |
Specific context is generally addressed by tools in this category |
Specific context is generally addressed by tools in this category |
| Grid |
Connected, interdependent network structure with multiple access points and alternate routes. |
Tools within this category do not generally address the specific context |
Some of tools in this category address the specific context but some do not |
Some of tools in this category address the specific context but some do not |
Some of tools in this category address the specific context but some do not |
Specific context is generally addressed by tools in this category |
Specific context is generally addressed by tools in this category |
| Work Zone Size |
| Small |
A work zone implemented on a short segment of an individual roadway or a single intersection. |
Specific context is generally addressed by tools in this category |
Tools within this category do not generally address the specific context |
Specific context is generally addressed by tools in this category |
Tools within this category do not generally address the specific context |
Some of tools in this category address the specific context but some do not |
Some of tools in this category address the specific context but some do not |
| Medium |
One or more work zones on longer stretches of a single facility and/or portions of adjacent facilities. |
Specific context is generally addressed by tools in this category |
Some of tools in this category address the specific context but some do not |
Some of tools in this category address the specific context but some do not |
Some of tools in this category address the specific context but some do not |
Specific context is generally addressed by tools in this category |
Specific context is generally addressed by tools in this category |
| Large |
Interacting work zones implemented on significant elements of a larger roadway network. |
Specific context is generally addressed by tools in this category |
Specific context is generally addressed by tools in this category |
Some of tools in this category address the specific context but some do not |
Specific context is generally addressed by tools in this category |
Specific context is generally addressed by tools in this category |
Specific context is generally addressed by tools in this category |
| Work Zone Analysis Area Dimension |
| Site |
Analysis area is restricted to the immediate area surrounding the work zone. |
Specific context is generally addressed by tools in this category |
Tools within this category do not generally address the specific context |
Specific context is generally addressed by tools in this category |
Tools within this category do not generally address the specific context |
Some of tools in this category address the specific context but some do not |
Some of tools in this category address the specific context but some do not |
| Local |
Analysis area includes surrounding area beyond the work zone to account for detour routes or other localized impacts. |
Specific context is generally addressed by tools in this category |
Some of tools in this category address the specific context but some do not |
Some of tools in this category address the specific context but some do not |
Some of tools in this category address the specific context but some do not |
Specific context is generally addressed by tools in this category |
Specific context is generally addressed by tools in this category |
| Metropolitan |
Analysis area includes multiple jurisdictions (counties, cities, etc.) or facilities. |
Some of tools in this category address the specific context but some do not |
Specific context is generally addressed by tools in this category |
Some of tools in this category address the specific context but some do not |
Specific context is generally addressed by tools in this category |
Specific context is generally addressed by tools in this category |
Some of tools in this category address the specific context but some do not |
(Source: Hardy and Wunderlich, 2009.)
Transportation Management Plan (TMP)
A TMP describes the management strategies that will be used to manage the impacts of a work zone. The work zone analysis tool must be capable of modeling the impacts of the type of strategy to be evaluated. As described in the FHWA’s Developing and Implementing Transportation Management Plans for Work Zones, TMP strategies are broadly grouped into the following categories:
- Temporary Traffic Control (TTC) – These strategies include conceptual decisions on possible construction approaches, traffic control and management approaches, and time of construction. These include the following:
- Control strategies;
- Traffic control devices; and
- Project innovation.
- Public Information – For projects that will have a significant impact on the traveling public, the analyst should consider, including motorist information strategies. Information dissemination to the public can be delivered a number of ways, such as general public awareness campaigns and motorist information strategies (e.g., pre-trip and en route traveler information).
- Transportation Operations – Operational strategies are wide ranging and can be classified into four major categories:
- Demand management strategies;
- Corridor/network management strategies; and
- Traffic incident management and enforcement strategies.
Table 13 presents the relevance of each tool class to the different TMP strategies.
Table 13. TMP Strategies
| Factors – TMP Strategies |
Summary |
Transportation Modeling Approach |
| Sketch-Planning and HCM |
Travel Demand Models |
Traffic Signal Optimization |
Macroscopic Simulation |
Mesoscopic Simulation |
Microscopic Simulation |
| Temporary Traffic Control |
Traffic control approaches used to accommodate road users within the work zone and adjoining corridor in an efficient and safe manner (e.g., construction phasing/staging, lane closures, ramp closures/relocation, temporary traffic signals). |
Specific context is generally addressed by tools in this category |
Some of tools in this category address the specific context but some do not |
Specific context is generally addressed by tools in this category |
Some of tools in this category address the specific context but some do not |
Specific context is generally addressed by tools in this category |
Specific context is generally addressed by tools in this category |
| Motorist Information |
Provision of current/real-time information to road users regarding the project work zone. |
Specific context is generally addressed by tools in this category |
Some of tools in this category address the specific context but some do not |
Specific context is generally addressed by tools in this category |
Some of tools in this category address the specific context but some do not |
Specific context is generally addressed by tools in this category |
Specific context is generally addressed by tools in this category |
| Demand Management |
Strategies intended to reduce the volume of traffic traveling through the work zone. Examples include diverting motorists to alternate modes of travel, shifting motorists to alternate routes, and encouraging off-peak travel trips. |
Specific context is generally addressed by tools in this category |
Specific context is generally addressed by tools in this category |
Some of tools in this category address the specific context but some do not |
Some of tools in this category address the specific context but some do not |
Specific context is generally addressed by tools in this category |
Some of tools in this category address the specific context but some do not |
| Corridor/Network Management (traffic operations) |
Strategies used to optimize traffic flow through work zone using traffic operations strategies and technologies. |
Some of tools in this category address the specific context but some do not |
Some of tools in this category address the specific context but some do not |
Some of tools in this category address the specific context but some do not |
Some of tools in this category address the specific context but some do not |
Specific context is generally addressed by tools in this category |
Specific context is generally addressed by tools in this category |
| Traffic/Incident Management and Enforcement Strategies |
Strategies to manage work zone traffic operations. |
Some of tools in this category address the specific context but some do not |
Tools within this category do not generally address the specific context |
Tools within this category do not generally address the specific context |
Some of tools in this category address the specific context but some do not |
Specific context is generally addressed by tools in this category |
Specific context is generally addressed by tools in this category |
Performance Measures
Once the agency determines the work zone traffic analysis objectives at the onset of the project, a list of the most desired and appropriate performance measures should be identified to allow for informed decision-making. Both the type of measure and the precision of the results (rough estimated or a detailed assessment) are important. A comprehensive list of performance measures are compiled in the FHWA’s Work Zone Impacts Assessment: An Approach to Assess and Manage Work Zone Safety and Mobility Impacts of Road Projects and A Primer on Work Zone Safety and Mobility Performance Measurement. (Ullman, G.L., and T.J. Lomax. A Primer on Work Zone Safety and Mobility Performance Measurement. Publication FHWA-HOP-11-033, Federal Highway Administration, U.S. Department of Transportation, Washington, D.C., September 2011. Sankar, P., K. Jeannotte, J.P. Arch, M. Romero, and J.E. Bryden. Work Zone Impacts Assessment – An Approach to Assess and Manage Work Zone Safety and Mobility Impacts of Road Projects. Publication FHWA-HOP-05-068, Federal Highway Administration, U.S. Department of Transportation, May 2006.) Some of the most common measures include:
- Travel time;
- Delay;
- Queue length;
- Speed;
- Volume;
- Density;
- LOS; and
- VMT/VHT.
The stage of the project’s life cycle often determines the overall precision of the results. For example, as the project moves from Planning to PE/Design to Construction, the level of precision needed increases. Table 14 provides a summary of the relevance of each tool class to various performance measures.
Table 14. Performance Measures
| Factors – Performance Measures |
Summary |
Transportation Modeling Approach |
| Sketch-Planning and HCM |
Travel Demand Models |
Traffic Signal Optimization |
Macroscopic Simulation |
Mesoscopic Simulation |
Microscopic Simulation |
| Travel Time |
Average time spent by vehicles traversing a facility, typically in minutes per vehicle. |
Some of tools in this category address the specific context but some do not |
Specific context is generally addressed by tools in this category |
Specific context is generally addressed by tools in this category |
Specific context is generally addressed by tools in this category |
Specific context is generally addressed by tools in this category |
Specific context is generally addressed by tools in this category |
| Delay |
Additional travel time experienced by travelers at speeds less than the free-flow speed. |
Specific context is generally addressed by tools in this category |
Specific context is generally addressed by tools in this category |
Specific context is generally addressed by tools in this category |
Specific context is generally addressed by tools in this category |
Specific context is generally addressed by tools in this category |
Specific context is generally addressed by tools in this category |
| Queue Length |
Length of queued vehicles waiting to be served by the system (expressed in distance or number of vehicles). |
Specific context is generally addressed by tools in this category |
Tools within this category do not generally address the specific context |
Specific context is generally addressed by tools in this category |
Specific context is generally addressed by tools in this category |
Specific context is generally addressed by tools in this category |
Specific context is generally addressed by tools in this category |
| Speed |
Rate of motion (expressed in distance per unit of time). |
Specific context is generally addressed by tools in this category |
Specific context is generally addressed by tools in this category |
Specific context is generally addressed by tools in this category |
Specific context is generally addressed by tools in this category |
Specific context is generally addressed by tools in this category |
Specific context is generally addressed by tools in this category |
| Volume |
Number of persons or vehicles passing a point on a roadway during some time interval. |
Specific context is generally addressed by tools in this category |
Specific context is generally addressed by tools in this category |
Specific context is generally addressed by tools in this category |
Specific context is generally addressed by tools in this category |
Specific context is generally addressed by tools in this category |
Specific context is generally addressed by tools in this category |
| V/C Ratio |
Ratio of flow rate to capacity for a transportation facility. |
Some of tools in this category address the specific context but some do not |
Specific context is generally addressed by tools in this category |
Some of tools in this category address the specific context but some do not |
Some of tools in this category address the specific context but some do not |
Some of tools in this category address the specific context but some do not |
Some of tools in this category address the specific context but some do not |
| Density |
Number of vehicles on a roadway segment averaged over space (usually expressed in vehicles per mile or vehicles per mile per lane). |
Some of tools in this category address the specific context but some do not |
Tools within this category do not generally address the specific context |
Specific context is generally addressed by tools in this category |
Specific context is generally addressed by tools in this category |
Specific context is generally addressed by tools in this category |
Specific context is generally addressed by tools in this category |
| LOS |
Qualitative measure describing operational conditions within a traffic stream, based on service measures such as speed and travel time, freedom to maneuver, traffic interruptions, comfort, and convenience. Ranges from LOS A (best) to LOS F (worst). |
Some of tools in this category address the specific context but some do not |
Some of tools in this category address the specific context but some do not |
Specific context is generally addressed by tools in this category |
Some of tools in this category address the specific context but some do not |
Some of tools in this category address the specific context but some do not |
Some of tools in this category address the specific context but some do not |
| VMT/PMT |
Total distance traveled by all vehicles or persons on a transportation facility or network during a specified time period (expressed in miles). |
Some of tools in this category address the specific context but some do not |
Specific context is generally addressed by tools in this category |
Some of tools in this category address the specific context but some do not |
Specific context is generally addressed by tools in this category |
Specific context is generally addressed by tools in this category |
Specific context is generally addressed by tools in this category |
| VHT/PHT |
Total travel time spent by all vehicles or persons on a transportation facility or network during a specified time period (expressed in hours). |
Some of tools in this category address the specific context but some do not |
Specific context is generally addressed by tools in this category |
Some of tools in this category address the specific context but some do not |
Specific context is generally addressed by tools in this category |
Specific context is generally addressed by tools in this category |
Specific context is generally addressed by tools in this category |
| Emissions |
Predicted emissions for each pollutant type on a transportation facility or network. |
Some of tools in this category address the specific context but some do not |
Tools within this category do not generally address the specific context |
Tools within this category do not generally address the specific context |
Tools within this category do not generally address the specific context |
Some of tools in this category address the specific context but some do not |
Some of tools in this category address the specific context but some do not |
| Fuel Consumption |
Fuel consumption rate associated with the use of a transportation facility or network. |
Some of tools in this category address the specific context but some do not |
Tools within this category do not generally address the specific context |
Tools within this category do not generally address the specific context |
Some of tools in this category address the specific context but some do not |
Specific context is generally addressed by tools in this category |
Specific context is generally addressed by tools in this category |
3.3 Selecting The Analysis Tool(s)
The purpose of this section is to provide users guidance regarding how to use the criteria and factors described in Section 3.2 to select the appropriate analysis tool types. This section also uses a hypothetical example in order to demonstrate the steps of this approach.
Assign Criteria Relevance Weight
In most cases, the most appropriate tool category or tool depends on the type of project and the level of detail required by each project. In this step, the criteria relevance weight is assigned to each of the criteria, depending on the type of study. The weight ranges from 0 (not relevant) to 5 (most relevant). For instance, if the project is a long-range plan, the project stage weight should be 5 for “Planning” and 0s for “PE/Design” and “Construction,” as shown in Table 15.
Table 15. Example Criteria Relevance Weight
| Factors – Project Stages |
Criteria Relevance |
| Planning |
5 |
| PE/Design |
0 |
| Construction |
0 |
Assign Tool Relevance Values
The tool relevance values are assigned as follows:
- For every transportation modeling approach classified as "Specific context is generally addressed by tools in this category," assign a value of 10.
- For every transportation modeling approach classified as "Some of tools in this category address the specific context but some do not," assign a value of 5.
- For every transportation modeling approach classified as "Tools within this category do not generally address the specific context," assign a value of 0.
Tables 16 through 22 present the tool relevance values for each of the seven criteria presented in Tables 8 through 14.
The tool relevance to each of the seven criteria presented in this section is for the general tool type, not individual tools. Certain tools within a tool type may have advanced features or capabilities that majority of the others within the same tool type do not have. The analyst may revise the tool relevance values when justified. Also, the analyst may adopt a different set of values than the ones provided herein (0-10).
Table 16. Tool Relevance Values – Project Stages
| Factors – Project Stages |
Transportation Modeling Approach |
| Sketch-Planning and HCM |
Travel Demand Models |
Traffic Signal Optimization |
Macroscopic Simulation |
Mesoscopic Simulation |
Microscopic Simulation |
| Planning |
10 |
10 |
0 |
5 |
5 |
0 |
| PE/Design |
5 |
5 |
10 |
10 |
10 |
10 |
| Operations/Construction |
5 |
0 |
10 |
10 |
10 |
10 |
Table 17. Tool Relevance Values – Facility Types
| Factors – Facility Types |
Transportation Modeling Approach |
| Sketch-Planning and HCM |
Travel Demand Models |
Traffic Signal Optimization |
Macroscopic Simulation |
Mesoscopic Simulation |
Microscopic Simulation |
| Isolated Intersection |
5 |
5 |
10 |
5 |
10 |
10 |
| Roundabout |
5 |
0 |
0 |
5 |
5 |
10 |
| Arterial |
5 |
10 |
10 |
10 |
10 |
10 |
| Highway |
10 |
10 |
5 |
10 |
10 |
10 |
| Freeway |
10 |
10 |
5 |
10 |
10 |
10 |
| HOV Lane |
5 |
10 |
0 |
10 |
10 |
10 |
| Ramp |
5 |
10 |
5 |
10 |
10 |
10 |
| Auxiliary Lane |
5 |
0 |
5 |
5 |
10 |
10 |
| Truck Lane |
5 |
10 |
5 |
5 |
10 |
10 |
| Bus Lane |
0 |
10 |
0 |
5 |
5 |
10 |
| Toll Plaza |
5 |
5 |
0 |
0 |
5 |
10 |
Table 18. Tool Relevance Values – Tool Features
| Factors – Tool Features |
Transportation Modeling Approach |
| Sketch-Planning and HCM |
Travel Demand Models |
Traffic Signal Optimization |
Macroscopic Simulation |
Mesoscopic Simulation |
Microscopic Simulation |
| Mode Split |
5 |
10 |
5 |
5 |
5 |
5 |
| Easy to Use |
10 |
0 |
5 |
5 |
0 |
0 |
| Popular/Well Trusted |
10 |
5 |
10 |
0 |
5 |
10 |
| Animation/Presentation |
0 |
5 |
0 |
5 |
5 |
10 |
Table 19. Tool Relevance Values – Agency Resources Required for Analysis
| Factors – Agency Resources Required for Analysis |
Transportation Modeling Approach |
| Sketch-Planning and HCM |
Travel Demand Models |
Traffic Signal Optimization |
Macroscopic Simulation |
Mesoscopic Simulation |
Microscopic Simulation |
| Technical Skill Requirements |
10 |
0 |
5 |
5 |
0 |
0 |
| Tool Capital Cost |
10 |
5 |
5 |
5 |
5 |
0 |
| Schedule/Time Requirements |
10 |
5 |
5 |
5 |
0 |
0 |
| Hardware Requirements |
10 |
0 |
10 |
5 |
0 |
0 |
| Data Requirements |
10 |
5 |
5 |
5 |
0 |
0 |
Table 20. Tool Relevance Values – Work Zone Characteristics
| Factors – Work Zone Characteristics |
Transportation Modeling Approach |
| Sketch-Planning and HCM |
Travel Demand Models |
Traffic Signal Optimization |
Macroscopic Simulation |
Mesoscopic Simulation |
Microscopic Simulation |
| Work Zone Type |
| Type I |
5 |
10 |
5 |
5 |
10 |
0 |
| Type II |
5 |
5 |
5 |
5 |
10 |
5 |
| Type III |
10 |
0 |
10 |
0 |
5 |
10 |
| Type IV |
10 |
0 |
10 |
0 |
0 |
10 |
| Work Zone Network Configuration |
| Isolated |
10 |
0 |
5 |
5 |
5 |
5 |
| Pipe |
10 |
0 |
5 |
5 |
10 |
10 |
| Grid |
0 |
5 |
5 |
5 |
10 |
10 |
| Work Zone Size |
| Small |
10 |
0 |
10 |
0 |
5 |
5 |
| Medium |
10 |
5 |
5 |
5 |
10 |
10 |
| Large |
10 |
10 |
5 |
10 |
10 |
10 |
| Work Zone Analysis Area Dimension |
| Site |
10 |
0 |
10 |
0 |
5 |
5 |
| Local |
10 |
5 |
5 |
5 |
10 |
10 |
| Metropolitan |
5 |
10 |
5 |
10 |
10 |
5 |
Table 21. Tool Relevance Values – TMP Strategies
| Factors – TMP Strategies |
Transportation Modeling Approach |
| Sketch-Planning and HCM |
Travel Demand Models |
Traffic Signal Optimization |
Macroscopic Simulation |
Mesoscopic Simulation |
Microscopic Simulation |
| Temporary Traffic Control |
10 |
5 |
10 |
5 |
10 |
10 |
| Motorist Information |
5 |
0 |
0 |
5 |
10 |
10 |
| Demand Management |
10 |
10 |
5 |
5 |
10 |
5 |
| Corridor/Network Management (Traffic Operations) |
5 |
5 |
5 |
5 |
10 |
10 |
| Traffic/Incident Management and Enforcement Strategies |
5 |
0 |
0 |
5 |
10 |
10 |
Table 22. Tool Relevance Values – Performance Measures
| Factors – Performance Measures |
Transportation Modeling Approach |
| Sketch-Planning and HCM |
Travel Demand Models |
Traffic Signal Optimization |
Macroscopic Simulation |
Mesoscopic Simulation |
Microscopic Simulation |
| Travel Time |
5 |
10 |
10 |
10 |
10 |
10 |
| Delay |
10 |
10 |
10 |
10 |
10 |
10 |
| Queue Length |
10 |
0 |
10 |
10 |
10 |
10 |
| Speed |
10 |
10 |
10 |
10 |
10 |
10 |
| Volume |
10 |
10 |
10 |
10 |
10 |
10 |
| V/C Ratio |
5 |
10 |
5 |
5 |
5 |
5 |
| Density |
5 |
0 |
10 |
10 |
10 |
10 |
| LOS |
5 |
5 |
10 |
5 |
5 |
5 |
| VMT/PMT |
5 |
10 |
5 |
10 |
10 |
10 |
| VHT/PHT |
5 |
10 |
5 |
10 |
10 |
10 |
| Emissions |
5 |
0 |
0 |
0 |
5 |
5 |
| Fuel Consumption |
5 |
0 |
0 |
5 |
10 |
10 |
Calculate Criteria Score
After assigning the tool relevance values and criteria relevance weights, the next step is to calculate the criteria score. The criteria score is calculated by multiplying the criteria relevance weight by the tool relevance value. For instance, if the project involves arterials, highways, freeways, ramps, and auxiliary lanes, the criteria scores can be calculated accordingly, as shown in Table 23.
Calculate Total Score
After the criteria score is calculated for each criterion, add up the scores for each tool type. The tool types with the highest totals are the most appropriate tools for the work zone project. Table 24 shows an example total score calculation for a project. For this project, the sketch-planning and HCM-based models have the highest score and they are the most appropriate tools.
The work zone analysis scoring work sheet, as shown in Table 25, can be utilized to assist in selecting the analysis tools using the methodology described above.
Table 23. Example Criteria Score Calculation
| Factors – Facility Types |
Criteria Relevance |
Sketch Plan |
TDM |
Signal Opt. |
Macro Sim |
Meso Sim |
Micro Sim |
Sketch Plan |
TDM |
Signal Opt. |
Macro Sim |
Meso Sim |
Micro Sim |
| Isolated Intersection |
0 |
5 |
5 |
10 |
5 |
10 |
10 |
0 |
0 |
0 |
0 |
0 |
0 |
| Roundabout |
0 |
5 |
0 |
0 |
5 |
5 |
10 |
0 |
0 |
0 |
0 |
0 |
0 |
| Arterial |
5 |
5 |
10 |
10 |
10 |
10 |
10 |
25 |
50 |
50 |
50 |
50 |
50 |
| Highway |
5 |
10 |
10 |
5 |
10 |
10 |
10 |
50 |
50 |
25 |
50 |
50 |
50 |
| Freeway |
5 |
10 |
10 |
5 |
10 |
10 |
10 |
50 |
50 |
25 |
50 |
50 |
50 |
| HOV Lane |
0 |
5 |
10 |
0 |
10 |
10 |
10 |
0 |
0 |
0 |
0 |
0 |
0 |
| Ramp |
5 |
5 |
10 |
5 |
10 |
10 |
10 |
25 |
50 |
25 |
50 |
50 |
50 |
| Auxiliary Lane |
5 |
5 |
0 |
5 |
5 |
10 |
10 |
25 |
0 |
25 |
25 |
50 |
50 |
| Truck Lane |
0 |
5 |
10 |
5 |
5 |
10 |
10 |
0 |
0 |
0 |
0 |
0 |
0 |
| Bus Lane |
0 |
0 |
10 |
0 |
5 |
5 |
10 |
0 |
0 |
0 |
0 |
0 |
0 |
| Toll Plaza |
0 |
5 |
5 |
0 |
0 |
5 |
10 |
0 |
0 |
0 |
0 |
0 |
0 |
| Subtotal |
175 |
200 |
150 |
225 |
250 |
250 |
Table 24. Example Total Score Calculation
| Criteria |
Sketch-Planning and HCM-Based Models |
Travel Demand Models |
Traffic Signal Optimization |
Macroscopic Simulation |
Mesoscopic Simulation |
Microscopic Simulation |
| 1. Project Stage |
50 |
50 |
0 |
25 |
25 |
0 |
| 2. Facility Types |
100 |
100 |
50 |
100 |
100 |
100 |
| 3. Tool Features |
50 |
25 |
50 |
0 |
25 |
50 |
| 4. Agency Resources |
250 |
75 |
150 |
125 |
25 |
0 |
| 5. Work Zone Characteristics |
200 |
25 |
125 |
50 |
125 |
150 |
| 6. Transportation Management Plan (TMP) Strategies |
100 |
75 |
75 |
50 |
100 |
75 |
| 7. Performance Measures |
225 |
200 |
250 |
250 |
250 |
250 |
| Total |
975 |
550 |
700 |
600 |
650 |
625 |
Table 25. Work Zone Analysis Scoring Sheet
| Factors |
Criteria Relevance |
Relevance Value |
Score |
| Sketch Plan |
TDM |
Signal Opt. |
Macro Sim |
Meso Sim |
Micro Sim |
Sketch Plan |
TDM |
Signal Opt. |
Macro Sim |
Meso Sim |
Micro Sim |
| Project Stage |
| Planning |
 |
10 |
10 |
0 |
5 |
5 |
0 |
|
|
|
|
|
|
| PE/Design |
|
5 |
5 |
10 |
10 |
10 |
10 |
|
|
|
|
|
|
| Construction |
|
5 |
0 |
10 |
10 |
10 |
10 |
|
|
|
|
|
|
| Facility Types |
| Isolated Intersection |
|
5 |
5 |
10 |
5 |
10 |
10 |
|
|
|
|
|
|
| Roundabout |
|
5 |
0 |
0 |
5 |
5 |
10 |
|
|
|
|
|
|
| Arterial |
|
5 |
10 |
10 |
10 |
10 |
10 |
|
|
|
|
|
|
| Highway |
|
10 |
10 |
5 |
10 |
10 |
10 |
|
|
|
|
|
|
| Freeway |
|
10 |
10 |
5 |
10 |
10 |
10 |
|
|
|
|
|
|
| HOV Lane |
|
5 |
10 |
0 |
10 |
10 |
10 |
|
|
|
|
|
|
| Ramp |
|
5 |
10 |
5 |
10 |
10 |
10 |
|
|
|
|
|
|
| Auxiliary Lane |
|
5 |
0 |
5 |
5 |
10 |
10 |
|
|
|
|
|
|
| Truck Lane |
|
5 |
10 |
5 |
5 |
10 |
10 |
|
|
|
|
|
|
| Bus Lane |
|
0 |
10 |
0 |
5 |
5 |
10 |
|
|
|
|
|
|
| Toll Plaza |
|
5 |
5 |
0 |
0 |
5 |
10 |
|
|
|
|
|
|
| Tool Features |
| Mode Split |
|
5 |
10 |
5 |
5 |
5 |
5 |
|
|
|
|
|
|
| Easy to Use |
|
10 |
0 |
5 |
5 |
0 |
0 |
|
|
|
|
|
|
| Popular/Well Trusted |
|
10 |
5 |
10 |
0 |
5 |
10 |
|
|
|
|
|
|
| Animation/Presentation |
|
0 |
5 |
0 |
5 |
5 |
10 |
|
|
|
|
|
|
| Agency Resources |
| Technical Skill Requirements |
|
10 |
0 |
5 |
5 |
0 |
0 |
|
|
|
|
|
|
| Tool Capital Cost |
|
10 |
5 |
5 |
5 |
5 |
0 |
|
|
|
|
|
|
| Schedule/Time Requirements |
|
10 |
5 |
5 |
5 |
0 |
0 |
|
|
|
|
|
|
| Hardware Requirements |
|
10 |
0 |
10 |
5 |
0 |
0 |
|
|
|
|
|
|
| Data Requirements |
|
10 |
5 |
5 |
5 |
0 |
0 |
|
|
|
|
|
|
| Work Zone Characteristics |
| Work Zone Type |
| Type I |
|
5 |
10 |
5 |
5 |
10 |
0 |
|
|
|
|
|
|
| Type II |
|
5 |
5 |
5 |
5 |
10 |
5 |
|
|
|
|
|
|
| Type III |
|
10 |
0 |
10 |
0 |
5 |
10 |
|
|
|
|
|
|
| Type IV |
|
10 |
0 |
10 |
0 |
0 |
10 |
|
|
|
|
|
|
| Work Zone Network Configuration |
| Isolated |
|
10 |
0 |
5 |
5 |
5 |
5 |
|
|
|
|
|
|
| Pipe |
|
10 |
0 |
5 |
5 |
10 |
10 |
|
|
|
|
|
|
| Grid |
|
0 |
5 |
5 |
5 |
10 |
10 |
|
|
|
|
|
|
| Work Zone Size |
| Small |
|
10 |
0 |
10 |
0 |
5 |
5 |
|
|
|
|
|
|
| Medium |
|
10 |
5 |
5 |
5 |
10 |
10 |
|
|
|
|
|
|
| Large |
|
10 |
10 |
5 |
10 |
10 |
10 |
|
|
|
|
|
|
| Work Zone Analysis Area |
| Site |
|
10 |
0 |
10 |
0 |
5 |
5 |
|
|
|
|
|
|
| Local |
|
10 |
5 |
5 |
5 |
10 |
10 |
|
|
|
|
|
|
| Metropolitan |
|
5 |
10 |
5 |
10 |
10 |
5 |
|
|
|
|
|
|
| Transportation Management Plan (TMP) Strategies |
| Temporary Traffic Control |
|
10 |
5 |
10 |
5 |
10 |
10 |
|
|
|
|
|
|
| Motorist Information |
|
5 |
0 |
0 |
5 |
10 |
10 |
|
|
|
|
|
|
| Demand Management |
|
10 |
10 |
5 |
5 |
10 |
5 |
|
|
|
|
|
|
| Corridor/Network Management |
|
5 |
5 |
5 |
5 |
10 |
10 |
|
|
|
|
|
|
| Traffic/Incident Management and Enforcement Strategies |
|
5 |
0 |
0 |
5 |
10 |
10 |
|
|
|
|
|
|
| Performance Measures |
| Travel Time |
|
5 |
10 |
10 |
10 |
10 |
10 |
|
|
|
|
|
|
| Delay |
|
10 |
10 |
10 |
10 |
10 |
10 |
|
|
|
|
|
|
| Queue Length |
|
10 |
0 |
10 |
10 |
10 |
10 |
|
|
|
|
|
|
| Speed |
|
10 |
10 |
10 |
10 |
10 |
10 |
|
|
|
|
|
|
| Volume |
|
10 |
10 |
10 |
10 |
10 |
10 |
|
|
|
|
|
|
| V/C Ratio |
|
5 |
10 |
5 |
5 |
5 |
5 |
|
|
|
|
|
|
| Density |
|
5 |
0 |
10 |
10 |
10 |
10 |
|
|
|
|
|
|
| LOS |
|
5 |
5 |
10 |
5 |
5 |
5 |
|
|
|
|
|
|
| VMT/PMT |
|
5 |
10 |
5 |
10 |
10 |
10 |
|
|
|
|
|
|
| VHT/PHT |
|
5 |
10 |
5 |
10 |
10 |
10 |
|
|
|
|
|
|
| Emissions |
|
5 |
0 |
0 |
0 |
5 |
5 |
|
|
|
|
|
|
| Fuel Consumption |
|
5 |
0 |
0 |
5 |
10 |
10 |
|
|
|
|
|
|
| Total Score |
|
|
|
|
|
|
|
|
|
|
|
|
|
Analysis Tool Selection Example: I-123 Corridor Reconstruction Project
The following hypothetical example serves as an example to illustrate the analysis tool selection methodology featured in this chapter using the given project background information. The information presented in this example is intended for illustrative purposes only. While the following example can be used to select or justify the use of a particular analysis tool, there may be additional questions that the analyst should consider, such as those shown on the example scoping work sheets, when determining the overall analysis approach.
Project Background
A six-mile corridor reconstruction project is in the design stage for Interstate 123 (I-123). Figure 9 depicts the location of the reconstruction project, with the work zone area highlighted in a box (in red color). As shown on the figure, I-123 is an urban freeway located within the central business district (CBD) of Coast City. The reconstruction will include freeway connectors between Interstate 123 and SR 456. Interstate 123 includes four to six lanes in each direction with an AADT of 150,000 vehicles and 12 percent truck traffic. The I-123 project will include reconstruction of three interchanges and two auxiliary lanes, pavement rehabilitation, and lane widening. The estimated duration to complete the entire project is 10 months. Because the project will require lane and ramp closures, parallel facilities, Frontage Road, Shell Avenue, Palm Boulevard, and Coastal Highway, have been identified as potential detour routes. The alternative routes are shown in blue on Figure 9.
At this design stage, the agency has identified several work zone alternatives for completing the project. Various alternatives considered include alternative construction work schedules (i.e., weekend work and night work) and various construction phasing/staging options. The agency will, therefore, need an analysis approach that applies a well-trusted tool in order to determine which of the alternatives should be implemented. For stakeholder and public meetings, the agency prefers that the selected tools have good animation and presentation features.
The agency has collected plenty of data and has enough resources to meet technical, cost, schedule, and hardware requirements of all levels of analysis tools. The work zone project will involve temporary traffic controls, motorist information, demand management, corridor management, and traffic incident management strategies. The desired performance measures from the analysis include travel time, delay, queue length, speed, volume, VMT, and VHT.
Figure 9. Analysis Tool Selection Example: I-123 Reconstruction Project
Select the Analysis Tool
The detailed steps on how to select the appropriate tool types for this hypothetical example are presented below.
Step 1: Project Stages
The analysis is in the design stage. Therefore, a criteria relevance weight of 5 is assigned to PE/Design, as shown in Table 26.
Step 2: Facility Types
This project will include reconstruction of three interchanges and two auxiliary lanes, pavement rehabilitation, and lane widening. It also will require lane and ramp closures. Major detour routes include Frontage Road, Shell Avenue, Palm Boulevard, and Coastal Highway. Therefore, the following facility types are involved in this project: arterial, highway, freeway, ramp, and auxiliary lane, as shown in Table 26.
Step 3: Tool Features
The agency wants an analysis approach that applies a well-trusted tool in order to determine which of the alternatives should be implemented. Also, the agency prefers that the selected tools have good animation and presentation features for the stakeholder and public meetings. Therefore, criteria relevance weights of 5 are assigned to both Popular/Well Trusted and Animation/Presentation, as shown in Table 26.
Step 4: Agency Resources
In order to determine the appropriate analysis methodology and tool that best fits the project, the resources that the agency can dedicate to the analysis should be considered. For the I-123 reconstruction project, the agency has collected plenty of data and has enough resources to meet technical, cost, schedule, and hardware requirements of all levels of analysis tools. In other words, there is least concern on agency resources. Therefore, criteria relevance weights of 1, for instance, are assigned to all five major key factors related to agency resources, as shown in Table 26.
Step 5: Work Zone Characteristics
The analysis area includes a six-mile segment in both directions of I-123. The analysis area also includes the diversion routes comprised of Frontage Road, Shell Avenue, Palm Boulevard, and Coastal Highway.
- Work Zone Type – The project can be classified as a Type II for the following reasons:
- The project is located on an urban freeway near the city core and also includes access to two major highway facilities; and
- Because the work zone project takes up to 10 months to build, its impacts can be classified as moderate to high.
- Work Zone Network Configuration – The six-mile work zone can be classified as a Pipe network.
- Work Zone Size – The project can be classified as Medium size as it is on a longer stretch of a single facility with impacts that extend to adjacent facilities.
- Analysis Area – As previously mentioned the analysis area dimension identifies the full area impacted by the work zone. Because the impact of this work zone project extends to the multiple facilities, this project’s analysis area can be classified as a Local.
Step 6: Transportation Management Plan (TMP) Strategies
The work zone project will involve temporary traffic controls, motorist information, demand management, corridor management, and traffic incident management strategies. Criteria relevance weights of 5 are assigned to them, as shown in Table 26.
Step 7: Performance Measures
The agency wants to collect the following performance measures from the analysis: travel time, delay, queue length, speed, volume, VMT, and VHT, as shown in Table 26.
Step 8: Criteria Score Calculation
After assigning the criteria relevance weights, the next step is to calculate the criteria score. As shown in Table 26, the criteria score is calculated by multiplying the criteria relevance weight by the tool relevance value.
Step 9: Total Score Calculation and Final Recommendation
After the criteria score is calculated for each criterion, add up the scores for each tool type. As shown in Table 26, the two analysis methods that scored the highest are mesoscopic and microscopic simulation tools. For this project, either mesoscopic or microscopic simulation tools are appropriate for the analysis. Between them, mesoscopic simulation provides better detour analysis, while microscopic simulation provides better animation features (e.g., 3-D vehicle animation).
Table 26. Example Work Zone Analysis Scoring Sheet: I-123 Corridor Reconstruction Project
| Factors |
Criteria Relevance |
Relevance Value |
Score |
| Sketch Plan |
TDM |
Signal Opt. |
Macro Sim |
Meso Sim |
Micro Sim |
Sketch Plan |
TDM |
Signal Opt. |
Macro Sim |
Meso Sim |
Micro Sim |
| Project Stage |
| Planning |
0 |
10 |
10 |
0 |
5 |
5 |
0 |
0 |
0 |
0 |
0 |
0 |
0 |
| PE/Design |
5 |
5 |
5 |
10 |
10 |
10 |
10 |
25 |
25 |
50 |
50 |
50 |
50 |
| Construction |
0 |
5 |
0 |
10 |
10 |
10 |
10 |
0 |
0 |
0 |
0 |
0 |
0 |
| Facility Types |
| Isolated Intersection |
0 |
5 |
5 |
10 |
5 |
10 |
10 |
0 |
0 |
0 |
0 |
0 |
0 |
| Roundabout |
0 |
5 |
0 |
0 |
5 |
5 |
10 |
0 |
0 |
0 |
0 |
0 |
0 |
| Arterial |
5 |
5 |
10 |
10 |
10 |
10 |
10 |
25 |
50 |
50 |
50 |
50 |
50 |
| Highway |
5 |
10 |
10 |
5 |
10 |
10 |
10 |
50 |
50 |
25 |
50 |
50 |
50 |
| Freeway |
5 |
10 |
10 |
5 |
10 |
10 |
10 |
50 |
50 |
25 |
50 |
50 |
50 |
| HOV Lane |
0 |
5 |
10 |
0 |
10 |
10 |
10 |
0 |
0 |
0 |
0 |
0 |
0 |
| Ramp |
5 |
5 |
10 |
5 |
10 |
10 |
10 |
25 |
50 |
25 |
50 |
50 |
50 |
| Auxiliary Lane |
5 |
5 |
0 |
5 |
5 |
10 |
10 |
25 |
0 |
25 |
25 |
50 |
50 |
| Truck Lane |
0 |
5 |
10 |
5 |
5 |
10 |
10 |
0 |
0 |
0 |
0 |
0 |
0 |
| Bus Lane |
0 |
0 |
10 |
0 |
5 |
5 |
10 |
0 |
0 |
0 |
0 |
0 |
0 |
| Toll Plaza |
0 |
5 |
5 |
0 |
0 |
5 |
10 |
0 |
0 |
0 |
0 |
0 |
0 |
| Tool Features |
| Mode Split |
0 |
5 |
10 |
5 |
5 |
5 |
5 |
0 |
0 |
0 |
0 |
0 |
0 |
| Easy to Use |
0 |
10 |
0 |
5 |
5 |
0 |
0 |
0 |
0 |
0 |
0 |
0 |
0 |
| Popular/Well Trusted |
5 |
10 |
5 |
10 |
0 |
5 |
10 |
50 |
25 |
50 |
0 |
25 |
50 |
| Animation/Presentation |
5 |
0 |
5 |
0 |
5 |
5 |
10 |
0 |
25 |
0 |
25 |
25 |
50 |
| Agency Resources |
| Technical Skill Requirements |
1 |
10 |
0 |
5 |
5 |
0 |
0 |
10 |
0 |
5 |
5 |
0 |
0 |
| Tool Capital Cost |
1 |
10 |
5 |
5 |
5 |
5 |
0 |
10 |
5 |
5 |
5 |
5 |
0 |
| Schedule/Time Requirements |
1 |
10 |
5 |
5 |
5 |
0 |
0 |
10 |
5 |
5 |
5 |
0 |
0 |
| Hardware Requirements |
1 |
10 |
0 |
10 |
5 |
0 |
0 |
10 |
0 |
10 |
5 |
0 |
0 |
| Data Requirements |
1 |
10 |
5 |
5 |
5 |
0 |
0 |
10 |
5 |
5 |
5 |
0 |
0 |
| Work Zone Characteristics |
| Work Zone Type |
| Type I |
0 |
5 |
10 |
5 |
5 |
10 |
0 |
0 |
0 |
0 |
0 |
0 |
0 |
| Type II |
5 |
5 |
5 |
5 |
5 |
10 |
5 |
25 |
25 |
25 |
25 |
50 |
25 |
| Type III |
0 |
10 |
0 |
10 |
0 |
5 |
10 |
0 |
0 |
0 |
0 |
0 |
0 |
| Type IV |
0 |
10 |
0 |
10 |
0 |
0 |
10 |
0 |
0 |
0 |
0 |
0 |
0 |
| Work Zone Network Configuration |
| Isolated |
0 |
10 |
0 |
5 |
5 |
5 |
5 |
0 |
0 |
0 |
0 |
0 |
0 |
| Pipe |
5 |
10 |
0 |
5 |
5 |
10 |
10 |
50 |
0 |
25 |
25 |
50 |
50 |
| Grid |
0 |
0 |
5 |
5 |
5 |
10 |
10 |
0 |
0 |
0 |
0 |
0 |
0 |
| Work Zone Size |
| Small |
0 |
10 |
0 |
10 |
0 |
5 |
5 |
0 |
0 |
0 |
0 |
0 |
0 |
| Medium |
5 |
10 |
5 |
5 |
5 |
10 |
10 |
50 |
25 |
25 |
25 |
50 |
50 |
| Large |
0 |
10 |
10 |
5 |
10 |
10 |
10 |
0 |
0 |
0 |
0 |
0 |
0 |
| Work Zone Analysis Area |
| Site |
0 |
10 |
0 |
10 |
0 |
5 |
5 |
0 |
0 |
0 |
0 |
0 |
0 |
| Local |
5 |
10 |
5 |
5 |
5 |
10 |
10 |
50 |
25 |
25 |
25 |
50 |
50 |
| Metropolitan |
0 |
5 |
10 |
5 |
10 |
10 |
5 |
0 |
0 |
0 |
0 |
0 |
0 |
| Transportation Management Plan (TMP) Strategies |
| Temporary Traffic Control |
5 |
10 |
5 |
10 |
5 |
10 |
10 |
50 |
25 |
50 |
25 |
50 |
50 |
| Motorist Information |
5 |
5 |
0 |
0 |
5 |
10 |
10 |
25 |
0 |
0 |
25 |
50 |
50 |
| Demand Management |
5 |
10 |
10 |
5 |
5 |
10 |
5 |
50 |
50 |
25 |
25 |
50 |
25 |
| Corridor/Network Management |
5 |
5 |
5 |
5 |
5 |
10 |
10 |
25 |
25 |
25 |
25 |
50 |
50 |
| Traffic/Incident Management and Enforcement Strategies |
5 |
5 |
0 |
0 |
5 |
10 |
10 |
25 |
0 |
0 |
25 |
50 |
50 |
| Performance Measures |
| Travel Time |
5 |
5 |
10 |
10 |
10 |
10 |
10 |
25 |
50 |
50 |
50 |
50 |
50 |
| Delay |
5 |
10 |
10 |
10 |
10 |
10 |
10 |
50 |
50 |
50 |
50 |
50 |
50 |
| Queue Length |
5 |
10 |
0 |
10 |
10 |
10 |
10 |
50 |
0 |
50 |
50 |
50 |
50 |
| Speed |
5 |
10 |
10 |
10 |
10 |
10 |
10 |
50 |
50 |
50 |
50 |
50 |
50 |
| Volume |
5 |
10 |
10 |
10 |
10 |
10 |
10 |
50 |
50 |
50 |
50 |
50 |
50 |
| V/C Ratio |
0 |
5 |
10 |
5 |
5 |
5 |
5 |
0 |
0 |
0 |
0 |
0 |
0 |
| Density |
0 |
5 |
0 |
10 |
10 |
10 |
10 |
0 |
0 |
0 |
0 |
0 |
0 |
| LOS |
0 |
5 |
5 |
10 |
5 |
5 |
5 |
0 |
0 |
0 |
0 |
0 |
0 |
| VMT/PMT |
5 |
5 |
10 |
5 |
10 |
10 |
10 |
25 |
50 |
25 |
50 |
50 |
50 |
| VHT/PHT |
5 |
5 |
10 |
5 |
10 |
10 |
10 |
25 |
50 |
25 |
50 |
50 |
50 |
| Emissions |
0 |
5 |
0 |
0 |
0 |
5 |
5 |
0 |
0 |
0 |
0 |
0 |
0 |
| Fuel Consumption |
0 |
5 |
0 |
0 |
5 |
10 |
10 |
0 |
0 |
0 |
0 |
0 |
0 |
| Total Score |
|
|
|
|
|
|
|
925 |
765 |
780 |
900 |
1,155 |
1,150 |
3.4 Challenges in Selecting Traffic Analysis Tools for Work Zone Applications
In addition to identifying the objectives and available resources/requirements for a work zone traffic analysis, there are technical challenges and limitations to consider when determining which tool to use.
Figure 10 depicts a continuum of traffic analysis tools from simple to complex. Simpler tools include the categories of HCM and sketch planning, while the more complex tools include macro-, meso-, and microscopic simulation software. (Hardy, M., and K. Wunderlich. Traffic Analysis Toolbox Volume IX: Work Zone Modeling and Simulation – A Guide for Analysts. Publication FHWA-HOP-09-001, Federal Highway Administration, U.S. Department of Transportation, Washington, D.C., March 2009.) The spectrum includes seven of the many commonly used transportation analysis tools for assessing the impacts of roadway construction projects. As the diagram shows, the resources needed increase as the complexity of the tool increase.
Figure 10. Work Zone Modeling Spectrum
(Source: Hardy and Wunderlich, 2009.)
Common technical challenges and limitations are presented in Chapter 5 of the Traffic Analysis Toolbox Volume II: Decision Support Methodology for Selecting Traffic Analysis Tools, and are briefly summarized below. (Jeannotte, K., A. Chandra, V. Alexiadis, A. Skabardonis. Traffic Analysis Toolbox Volume II: Decision Support Methodology for Selecting Traffic Analysis Tools. Publication FHWA-HRT-04-039, Federal Highway Administration, U.S. Department of Transportation, Washington, D.C., June 2004.)
A significant technical challenge is the availability of data in the formats and quality required to effectively apply a particular tool. After weighing the key factors described in Section 3.2, an analyst may desire a detailed analysis tool, such as microsimulation. However, this type of modeling tool is data intensive and requires robust information about volumes (15-minute intervals or less), speeds, queues, etc. for calibration. It may later be discovered that the available peak hour traffic data is in one-hour blocks and/or it may be of poor quality. If financial and time resources are not available to collect what is needed, a simpler tool should be considered.
The availability and expertise of staff is another technical challenge. Because of lack of resources, past experience, or lack of familiarity with other available tools, many agencies use one of the tools currently in their possession, even if it is not the most appropriate tool for the project. In addition, simpler tools can be effectively applied by experienced technicians; whereas the complex tools require analysts with specialized training.
The availability of project funding is an important consideration, as traffic analysis tools require a significant capital investment. Costs associated with a work zone traffic analysis can include software licenses, training, running analytical scenarios, etc. When faced with funding limitations, analysts should focus on the project’s goals and objectives and try to identify the point of diminishing returns for the investment.
The development time and computer run time typically increase with the complexity of the tool. The implementation of many traffic analysis tools can be a resource-intensive process, especially in the model coding and calibration (front-end) phases for simulation analyses. Depending on the computer hardware and the scope of the study (e.g., area size, data requirements, duration, analytical time periods, etc.), an analytical model run may range from a few seconds to several hours. The most effective approaches to addressing this issue involves using the most robust computer equipment available and/or carefully limiting the scope of the study to conform to the analytical needs. Careful scheduling and pre-agreed upon acceptance criteria are necessary to keep the project focused and on target.
The output measures produced by each tool vary, so the process of matching the project’s desired performance measures with the tool’s output is important. In addition, some of the more complex projects require the use of more than one tool or analysis method. Keep in mind that the definition of a particular performance measure can vary from tool to tool. For example, LOS is calculated differently in a traditional HCM demand-based analysis versus an operations-based simulation model.
Analytical tools have functional limitations. Some analytical tools are not designed to evaluate the specific strategies that users would like to implement. Common limitations for each tool category are outlined in Section 3.1. Key considerations for each tool type are provided in Chapter 4.
A considerable amount of research has been conducted in the area of work zone capacity determination. Although it is widely accepted that capacity is reduced in work zone situations, estimating that reduction is not a straightforward process. Different transportation agencies around the country use varying methodologies, and work zone capacity values are often estimated differently depending on the roadway type (e.g., arterial versus freeway); duration of the work zone; intensity of the work activity (number of workers, types of machinery, and proximity of travel lanes to work under way); truck presence; and proximity of ramps, among other factors.
Some traffic analysis tools are unable to directly account for this reduced capacity. For example, reduced capacity can be directly specified in FREEVAL, an HCM-based deterministic analysis tool. In contrast, there is no direct “capacity” input in VISSIM, a microsimulation tool. In order to account for the reduced capacity, the analyst needs to adjust a set of parameters that affect capacity, such as standstill distance, headway time, and following variation. For some tools, it is possible to adjust variables other than capacity itself to, in turn, reflect reduced capacity conditions. Those variables may include driver and vehicle characteristics (e.g., headways, etc.). The variables are different depending on the tool. This may not be an issue in every analysis, particularly if all the alternatives are being compared under the same assumptions. Work zone capacity determination is addressed for each tool category in Chapter 4.
Finally, do not lose sight of the big picture, and be careful not to get lost in the technical details of the analysis. Keep focused on the identified project objectives, and let them guide your decisions as technical challenges are encountered along the way.
PDF files can be viewed with the Acrobat® Reader®.