Getting Started with Congestion Pricing: A Web-Based Workshop for Local Partners
Part 2
Slide 1
Getting Started with Congestion Pricing
A Web-Based Workshop for Local Partners
Part 2
Federal Highway Administration
Office of Operations
Slide 2
Recap of Part 1
- Congestion pricing comes in various forms, with lane pricing the most common application in the U.S.
- Congestion pricing can provide benefits to a variety of users and stakeholders
- Federal programs related to pricing are available to support
- There are a number of unique implementation challenges associated with lane pricing; in the last session we covered
- Public and political acceptance
- Funding and financing
Slide 3
Agenda
- Part 1 – Overview and Introduction to Six Challenges
- What is Congestion Pricing?
- The Case for Congestion Pricing
- Six Implementation Challenges
- 1 – Political Support and Public Acceptance
- 2 – Funding and Financing
- Part 2 – Continuation of Six Challenges
- 3 – Equity
- 4 – Technology
- 5 – Enforcement
- 6 – Long-Range Planning Integration
- Wrap-up and Summary
Slide 4
Equity
Slide 5
Equity
- Equity concerns in transportation policy are founded on the principles of environmental justice
- Types of equity concerns
- Income-based
- Modal
- Geographic
- Fairness (paying twice)
https://www.fhwa.dot.gov/ipd/revenue/road_pricing/resources/webinars/
Slide 6
Income-Based Equity
Social Justice Advocacy Groups’ concern:
This will be a regressive tax on those who can least afford it.
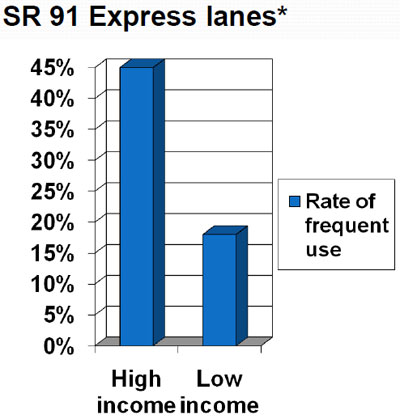
Slide 7
New Priced Lanes: Equity Concerns
- Tolls require a larger share of the income of low-income commuters
- So lower-income drivers use priced facilities less often
- This creates an equity issue (“Lexus lanes”)
*Source: Edward Sullivan, Continuing Study to Evaluate the Impacts of the SR 91 Value-Priced Express Lanes, Final Report, December 2000 (p.87)
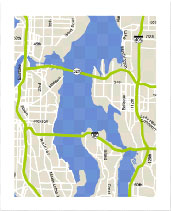
Slide 8
*From SR 167 HOT Lane first annual performance summary (2009)
Slide 9
Addressing Equity Concerns
Addressing income-based equity:
- Improved and/or lower cost transit service
- Toll credits or discounts for means-tested drivers
- Reimbursements of the amount of toll above the transit fare (NYC)
- Convenient ways for the “unbanked” to pay
Slide 10
Modal Equity
Transit Advocacy Groups’ Concern:
Congestion relief will encourage choice transit riders to abandon transit and go back to their cars.
Slide 11
Transit and Congestion Pricing
Slide 12
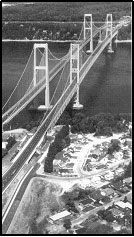
Case Study: I-95 Express
Miami, FL - HOV to HOT Conversion Project
Project Description
- Phase 1 - 10 miles project in Miami/Dade County, FL
- Opened in Dec. 2008
- Converted extremely congested 1-lane HOV to 2-lanes HOT each direction
- Went from 2+ HOV to 3+ Registered Carpool HOT
- Flexible plastic pole separation
- Limited midpoint access locations
Slide 13
I-95 Express
Miami, FL - HOV to HOT Conversion Project
Pricing Parameters
- Full time operation with dynamic tolling
- Toll free for registered HOV 3+/transit buses/motorcycles
- Toll rate - $0.25 - $7.10
- Must have Sunpass transponder
- No 3+ axle trucks allowed in Express lanes
Slide 14
Modal Equity – 95 Express Miami
- The 95 Express Bus Service benefitted significantly from the conversion of the HOV lanes into HOT lanes
- Increased speeds and reduced travel times allowed Miami-Dade Transit to reduce the scheduled travel times for the 95 Express Bus Service
- I-95 Express buses were on-time 76.2% of the time in 2008, 75.5% in 2009, and 81.1% in 2010
- Average weekday ridership on the 95 Express Bus Service increased 57% between 2008 and 2010 while the three control groups in the study experienced a ridership decrease
Slide 15
Modal Equity – 95 Express Miami
- Between 2008 and 2010, person throughput from transit increased 23% in the a.m. peak period and 36% in the p.m. peak period
- Of riders that only began using the 95 Express Bus Service after the Express Lanes were opened in December 2008, 53% said the opening of the Express Lanes influenced their decision to use transit.
- Of these new riders, 38% said they used to drive alone, but 45% said they used to use some other transit service. Within that 45% figure are 34% who used to take Tri-Rail and Metrorail
Slide 16
Addressing Modal Equity Concerns
Addressing Modal Equity:
- Dedicate some of toll revenue to transit (San Diego, Minneapolis)
- Provide free or discounted service for carpools (HOT lanes)
Slide 17
Geographic Equity
Local residents’ concerns:
Why do I have to pay for my road, when my tax dollars went to pay for the other guy’s road?”
Slide 18
Addressing Geographic Equity Concerns
Region-wide Approach
- Long-range planning
- Incorporate road pricing into LRP
- All regional residents share in the burden
- Affordability
- Lower tolls can be charged since financial burden is spread over more drivers
Slide 19
Fairness: Paying Twice
Motorist Advocacy Groups’ Concern:
Why impose tolls on existing free roads already paid for with taxes?
Slide 20
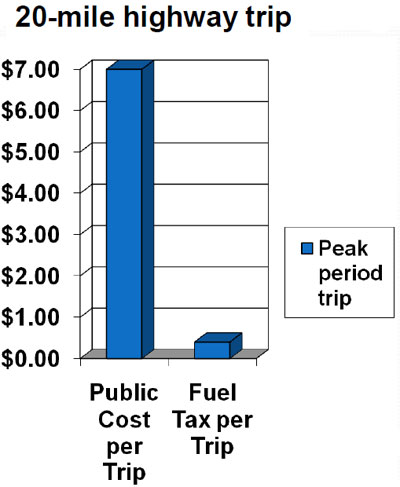
Construction Cost of New Lanes
- Providing “free” new capacity is financially unsustainable
- Fuel tax receipts from peak trips are less than 6% of capital cost for constructing a new lane
Slide 21
Equity Observations
- Payment plans may be structured to be more convenient for low income travelers.
- High income travelers bear the payment of user costs associated with managed lanes facilities, as most facilities are located in high income areas.
- Managed lane facilities can provide for additional modal options that are more attractive to lower income commuters
- Low income customers often value time savings at higher than the prevailing toll, and managed lane facilities provide a reliable travel time saving option.
Slide 22
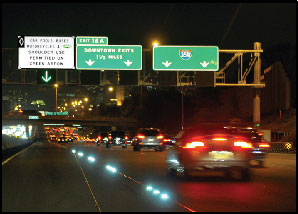
Technology
Slide 23
Technology
Tolling (traditional)
Road Pricing (new)
Slide 24
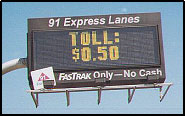
Toll Technology Options
- Toll gates with cash collection where everyone stops
- Cash lanes with dedicated electronic toll collection lanes where electronic customers slow down but only cash users stop
- Open road tolling (ORT) where electronic tolls are collected at highway speeds and cash tolls are collected at pull-out locations
- All-electronic toll collection (AETC)
- All tolls are collected at highway speeds
- There is no provision for cash collection
- Toll tag transponders and video tolling provide toll collection
Slide 25
Technical Feasibility
- Toll collection
- Enforcement
- Occasional users
- Administrative costs
Slide 26
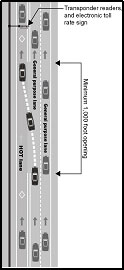
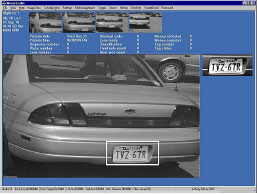
Enforcement Technologies
Toll Violation Enforcement Systems (VES)
Slide 27
Difficulties with Automatic License Plate Readers
- License plates are complex
- Multiple plate-type codes
- Duplicate & vanity plates
- Contrast between characters and backgrounds
- Colored characters cause problems (i.e., red)
- Data Accuracy
- Change of addresses not submitted by owners in a timely manner
- Data entry variations
- Rules Vary for Entering Plate Information
- What plate characters must be entered
- How to interpret data on the plate
Slide 28
Traffic Management/Toll Integration
- Proactive management
- Setting variable tolls to control demand
- Life-cycle operations
- Other operations functions
- Traffic/performance monitoring
- Incident management
- Enforcement
- Maintenance
Slide 29
Traffic Management/Toll Integration
“Concept of Operations” that integrates…
- Pricing
- Traffic management functions
- Signing/driver information
- Incident management
- Enforcement
- Toll operations
Slide 30
Concept of Operations
- Current system/conditions
- Concept for proposed system
- Operational parameters (description from user perspective)
- Variable pricing system (congestion calculation)
- System architecture
- Central processing system
- Variable toll message sign (VTMS) system
- Electronic toll collection system
- Pricing system
- Communications system
- Enforcement
- Incident Management
- Central system (back office)
- Customer Service Center (CSC)
- Account management
- Revenue management
- Reporting, financial controls, processes
- Security
- Hardware configuration
- Marketing
Slide 31
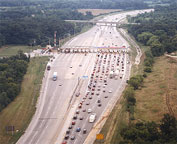
Case Study: I-35W MnPASS
Minneapolis, MN – HOV to HOT Conversion
Project Description
- Northbound: 14 miles; Southbound: 11.5 miles
- 1 lane each direction
- Striped buffer separation
- Opened Sep. 2009
- Midpoint Access
- Northbound: 9 entry/exit locations
- Southbound: 7 entry/exits locations
Slide 32
I-35W MnPASS
Minneapolis, MN – HOV to HOT Conversion
Pricing Parameters
- Dynamically priced based on demand
- Toll free for HOV 2+/transit/motorcycles
- Toll rate – varies between $0.25 and $8.00 (average peak period toll between $1.00 and $3.00)
- Must have MnPass transponder (if solo driver; $1.50/month leasing fee)
Slide 33
I-35W MnPASS
Minneapolis, MN – HOV to HOT Conversion
Project Features
- Priced dynamic shoulder lane (PDSL) equipped to operate as a MnPASS lane during peak periods to maximize capacity on existing roadways
- Electronic signs alert drivers whether the PDSL is open or closed
- Variable speed limits in the adjacent non-tolled lanes
- Coordination with business in the corridor to offer flex schedules and telework
www.mnpass.org
Slide 34
Enforcement
Slide 35
Enforcement
- One of the greatest challenges associated with HOT lane operations
- Multiple activities involved
- Enforcement continuum
- Field enforcement
- Violation processing
- Legislative and judicial considerations
- Fine levels
- Adjudication process
Slide 36
HOT Enforcement Methods
- Geometric design methods to aid visual check
- Technology-assisted methods
- Policy and administrative approaches
- Supporting regulatory measures
- Future HOT enforcement considerations
Slide 37
Occupancy Verification
- Verification currently depends exclusively on manual methods
- Roving patrols
- Stationary verification
- Team patrols
- Designated enforcement areas (ideal conditions)
- Low speed
- Enough space to verify and cite violators
- Hidden from view
Slide 38
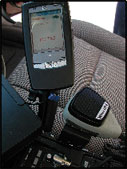
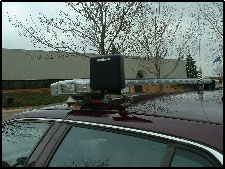
HOT Technologies – MnPass Example
- Handheld and Mobile Systems
- Transponder verification equipment in hand-held form or mounted to law enforcement vehicles
- Allows officers to remotely verify transponders from inside their car, alongside or behind vehicles in the HOT lane, or when violator apprehended
- Switchable transponders
Slide 39
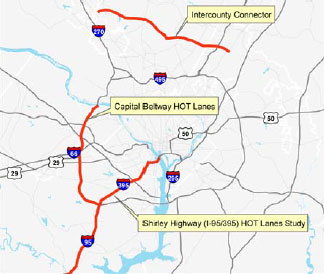
Long-Range Planning Integration
Slide 40
Long-Range Planning Integration
- Road pricing often has come about through pilot projects and demonstrations, separate from the traditional MPO process
- Case studies of four regions:
- Dallas/Ft. Worth, Texas
- Puget Sound Region, Washington
- Minneapolis/St. Paul, Minnesota
- San Francisco Bay Area, California
Integrating Pricing into the Metropolitan Transportation Planning Process: Four Case Studies. Final Report. FHWA
Slide 41
Lessons Learned
Regional road pricing policy grew from federal policies
- NCTCOG (DFW region)
- Funding constraint from ISTEA in 1991 is realized. As a result:
- All new highways shall be evaluated for tolling possibility
- All reconstructions shall include priced express lanes
- Metropolitan Council (Minneapolis-St. Paul)
- Pricing to leverage future federal funds
- More specific to multimodal investments
Slide 42
Lessons Learned
Regional road pricing policy grew from individual projects
- Puget Sound Regional Council (PSRC)
- Tacoma Narrows Bridge brought support for tolling for financing
- Route 167 HOT Lanes introduced congestion pricing
- Now have a 30-year vision to allow pricing to evolve and support revenue and demand management
- San Francisco Bay Area
- Early proposals for pricing Bay Bridge defeated
- Success of HOT lanes nationally, federal support ultimately led to Bay Bridge pricing, and opening of first HOT lane on I-680
Slide 43
Lessons Learned
Regional road pricing policy grew from individual projects
- Once individual projects were committed or underway, and gaining favorable response, regions adopted them into long-range plans and developed supportive policies
- Need for consistency was a driver
- Project development
- Revenue allocation policy
- Design and technology policies
Slide 44
Lessons Learned
Developing the right tools for the job
- Basic 4-step travel demand models not well suited to complexity of pricing
- D/FW – Results of outputs feedback into model
- Twin Cities – emphasis on “how many people would choose managed lanes at what price” resulted in simple modifications to traffic assignment routines
- Bay Area – use travel survey data for elasticities
- Puget Sound – developed new travel demand modeling and benefit/cost analysis techniques, supported by wealth of data from Traffic Choices study (per-mile pricing demonstration)
Slide 45
Lessons Learned
Communication of road pricing concepts is a challenge everywhere
- Especially difficult when concepts are unknown and untested
- D/FW – logical outgrowth of history of toll roads
- Bay Area – how HOT lanes benefit transit, address “Lexus Lanes”
- Twin Cities – continued public communication for 10 years after failure of original HOT proposal
- PSRC – pricing is one element of a larger plan; Pricing Task Force formed; project champion
Slide 46
Lessons Learned
Pricing is one element of a cohesive transportation plan
- All four regions found that making road pricing one element among many was effective at gaining acceptance
- Integrating project lists, road pricing concepts and decisions about use of potential revenue
- Pricing as it supports regional goals
- Puget Sound – revenue, GHG emission reduction goals
- D/FW – highway expansion
- Bay Area – revenue to support effective use of existing and planned HOV lanes
- Twin Cities – mix of strategies: bus-only shoulder lanes, priced dynamic shoulder lanes
Slide 47
Recap of Part 2
- Priced lanes involve more complexity than traditional highway projects in areas of public outreach, funding, design, and operations.
- Six implementation challenges were explored in this webinar, with examples from successful projects in operation.
- As pricing is introduced, the distinctive conditions associated with the corridor and the community will make it a wholly unique endeavor, but lessons learned from other projects and regions can offer guidance.
Slide 48
Questions and Discussions