|
|
An Agency Guide on Overcoming Unique Challenges to Localized Congestion Reduction Projects(You will need the Adobe Acrobat Reader to view the PDFs on this page.) APPENDIX A
| |||||||||||||||||||||||||||||||||||||||||||||||||||||||||||||||||||||||||||||||||||||||||||||||||||||||||||||||||||||||||||||||||||||||||||
| Vehicle Delay (hr) | Number of Stops | Fuel Consumption (gal) | CO Emissions (kg) | NO Emissions (kg) | |
|---|---|---|---|---|---|
| “Before” | 6,963 | 499,066 | 15,827 | 1,106 | 215 |
| “After” | 4,938 | 455,807 | 14,042 | 982 | 191 |
| Improvement | 2,025 | 53,259 | 1,785 | 125 | 24 |
| % Improvement | 29% | 11% | 11% | 11% | 11% |
| Annual Benefit | $16,221,490 | $372,813 | $3,213,000 | $436,785 | $171,936 |
| Total Benefit | $20,416,524 | ||||
| Approximate Cost | $402,500 | ||||
| Benefit-Cost Ratio | 51:1 | ||||
Baltimore City Signal Timing Optimization – Gateway Corridors, May 2008.
| Barriers/Challenges | How They Were Overcome |
|---|---|
| Lack of training | Hired a consultant with experience in corridor signal timing projects. |
| Culture of historical practices | Prior to the project the signal shop had a lot of control over signal timings; however majority control was switched to engineering. |
| No dedicated funding category | City obtained funding using the Congestion, Mitigation and Air Quality (CMAQ) program in addition to local funds. |
| Lack of available resources | Hiring a consultant supplemented available City staff. |
For more information – http://sabra-wang.com/media/BaltimoreSignalTimingOptimizationITEJournalJune08RinikerSilbermanSabra.pdf
Saginaw County, Michigan: I-75/M-81 interchange
Michigan Department of Transportation
Louie Taylor, Delivery Engineer
TaylorLo@michigan.gov
(517) 322-6092
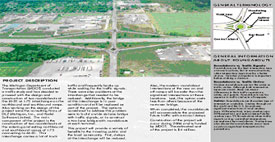
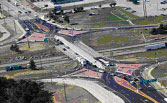
Multiple problems existed at this tight diamond interchange. It suffered from heavy truck traffic on M-81, inefficient signal control at the ramp terminals, and safety problems as a result of sharp left turns to and from the ramps that contributed to frequent truck overturns. Backups routinely occurred and the bridge for M-81 over I-75 was in “critical condition.”
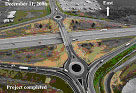
Given limited resources, the state chose an innovative design approach with roundabouts replacing the tight diamond. The project included reconstruction of the bridge, roundabouts (which include bypass lanes) at the ramp terminals, and removal of the traffic signals. At $5.1 million, this solution represented a cost savings of $6 to $7 million over typical reconstruction, primarily because right-of-way needs were considerably smaller compared to other proposed alternatives.
The installation of modern roundabouts significantly reduced delay and fuel consumption, with no visible traffic backups. Ultimately, the initially lukewarm reception of the design concept was replaced by public acceptance and accolades for the completed project – including being selected as a Gold Level Winner of the 2007 National Achievement Awards sponsored by the National Partnership for Highway Quality.
| Barriers/Challenges | How They Were Overcome |
|---|---|
| Culture of historical practices | Focused discussion with management on design concept – cost savings |
| Lack of confidence in solution | Simulation models showing level-of-service improvement from D to A. |
| Getting stakeholder buy-in | Presentations to stakeholders and aggressive public involvement and education campaign including the use of special brochures, videos and newspaper editorials. |
For more information – http://www.nphq.org/doc/awardnominations/2007/Michigan.doc

Minneapolis, Minnesota: I-94 approaching I-394
Minnesota Department of Transportation
John Griffith
John.Griffith@state.mn.us
(651) 234-7728
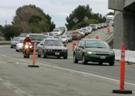
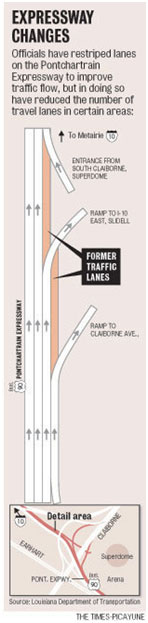
Congestion regularly occurred in the right lane of westbound I-94 prior to the westbound I-394 exit. This was caused by the high amount of weaving from vehicles that tended to occur from motorists trying to avoid the right lane congestion and merge just north of the Lowry tunnel where there was a lane added.
The $300,000 project reconfigured the westbound lanes so that the right lane through the tunnel became an exit-only lane to I-394, the left lane became exclusively for westbound I-94 and the middle lane was split into two lanes at the tunnel exit with the left lane designated for westbound I-94 and the right lane an “option” lane between either I-94 or I-394. The lane modification was designed to provide better access to I-394, reduce congestion in the right lane, and improve safety in the area by eliminating the last-minute weaving into the right lane.
Minnesota DOT is gathering data from traffic detectors to regularly assess the performance of this project which was completed in September 2010. Preliminary results show positive increases in throughput during the AM peak and no significant effect in the PM. The safety effects will be evaluated at a later date.
| Barriers/Challenges | How They Were Overcome |
|---|---|
| Culture of historical practices | Education on benefits in short-term goals. |
| Lack of confidence in solution | Review of traffic analysis and other data supports the solution. |
| Spot treatment won’t fix the problem | Commitment to monitor for one year and make necessary changes with future programmed project one year out. |
| Hesitancy to implement non-standard solution | Review of standards and how project does not violate driver expectation and, where design exception needed, determine likely outcomes. |
For more information – http://www.dot.state.mn.us/metro/projects/cmsp/pastprojects.html
Minneapolis, Minnesota: TH-100 from 36th St. to I-394
Minnesota Department of Transportation
Lars Impola, Metro District Traffic Engineer
Lars.Impola@state.mn.us
(651) 234-7820
The section of TH-100 from 36th Street to I-394 was the last remaining segment of original 1937 construction. A bottleneck existed with a four-lane section of freeway sandwiched between two six-lane segments. This bottleneck caused congestion during both the AM and PM peak periods in both directions. MnDOT found that this part of TH-100 was exposed to congestion for the longest amount of time per day of the Minneapolis/St. Paul metro area. Additionally, recent crash studies indicated that several of the substandard ramps were causing an unacceptable number of correctable crashes. Urgency was added to this project because it could act as a reliever to the upcoming I-35W/MN-62 reconstruction.
MnDOT converted the shoulders of TH-100 to a general purpose through lane northbound and a collector-distributor lane southbound. These lanes were designed to increase the existing capacity and throughput. The existing interchanges were also reconfigured to correct substandard ramp entrances. Construction was completed in 2006 at a cost of $7.1 million.
The table below shows that significant mobility benefits were realized; however, due to downstream bottlenecks and a substandard ramp, crashes have increased within the area of influence of this project. This project won an award in Minnesota for public project of the year and provided a greater level of mobility benefit than a parallel design-build project on I-494 that cost $138 million to construct.
| Project Cost (millions) | Reduction (Annual Hrs of Delay) | Increase in Traffic Flow (vehicles) | Decrease in Peak Period Congestion | Peak Period Travel Speed1 | Crash Reduction | Benefit-Cost Ratio2 |
|---|---|---|---|---|---|---|
| $7.1 | 1,063,500 | AM peak: 8,770 | AM: 5 miles | AM: 45-50 mph | 49% increase-SB | 13:1 |
| PM peak: 11,918 | PM: 6 miles | PM: 45-50 mph | 17% increase-NB |
1 The daily peak period is 10 hours, AM peak from 6:00 to 10:00AM and the PM peak from 2:00 to 7:00PM ↑
2 Based on 7 year congestion savings ↑
| Barriers/Challenges | How They Were Overcome |
|---|---|
| Culture of historical practices | Education on benefits in short-term goals. |
| Lack of confidence in solution | Review of traffic analysis and other data supports the solution. |
| Spot treatment won’t fix the problem | Commitment to monitor for one year and make necessary changes with future projects. |
| Hesitancy to implement non-standard solution | Review of standards and how project does not violate driver expectation and, where design exception needed, determine likely outcomes. |
For more information – http://www.dot.state.mn.us/metro/programmanagement/pdf/beforeafter.pdf
Springfield, Missouri: I-44 at Route 13
Missouri Department of Transportation
Don Saiko, Project Manager
Donald.Saiko@modot.mo.gov
(417) 895-7692
The I-44/Route 13 interchange had a number of issues including: traffic congestion, left-turns backing up and blocking thru traffic, and 73% of crashes are rear-end and left-turn right angle. MoDOT had limited funds to improve this location and considered three options: (1) widen the bridge with dual lefts; (2) replace bridge with a Single-Point Urban Interchange (SPUI); or (3) convert the existing interchange to a Diverging Diamond Interchange (DDI), which would be the first in the United States.
MoDOT chose to build the first DDI because it was cheaper to build ($3.2 million vs. $9 million for a SPUI) and maintain. The DDI option also was quicker to build (6 months vs. 1½-2 years) primarily because it utilized the existing bridge and required no additional ROW.
MoDOT evaluated the DDI on traffic operations, safety & public perception
| Traffic Operations | Safety | Public Perception |
|---|---|---|
|
|
|
| Barriers/Challenges | How They Were Overcome |
|---|---|
| Project champion | The project engineer became champion and garnered by internal (upper MoDOT management) and external (business) support. |
| Project planning and programming requirements | The FHWA required that a modified Interstate Access Justification (IAJ) be done 2 weeks before the project was let; however, project staff was able to finish the new analysis prior to the deadline. |
| Lack of confidence in the proposed solution | Project staff utilized an enhanced level of traffic analysis and public outreach (particularly with Wal-Mart) including a simulation model and project video designed to showcase how a DDI operates. |
| Hesitancy to implement solution that does not follow standards | The project engineer had to convince MoDOT Central Design staff that the pedestrian access would work well through the middle of the DDI instead of on the outside like traditional diamonds. |
For more information – http://library.modot.mo.gov/RDT/reports/TRyy1013/or11012.pdf
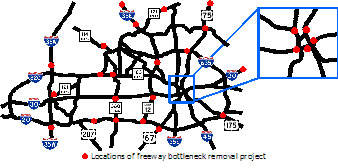
Dallas-Fort Worth, Texas: 17 projects
Texas Department of Transportation
Stan Hall, Advance Planning Engineer
Stan.hall@txdot.gov
(214) 320-6155
The DFW area has the most extensive freeway system on a per-capita basis when considering lane-miles and interchanges. Over the last 20 years, recurrent congestion appeared at many locations and in areas with no major capital improvements in the long-range plan. TxDOT developed a number of low-cost projects to address these localized congestion areas, also commonly called bottlenecks. Most improvements were implemented with discretionary funds and project champions were a key to success.
Some of the typical low-cost solutions implemented in the DFW region included: restriping, reducing lane widths and converting shoulders in order to provide additional travel lane(s) for a short section, auxiliary lanes, and ramp modifications (e.g., closure, reversal and/or metering).
See Transportation Research Record No. 1925, 2005, pp. 66-75.
Evaluations of the 17 case study projects revealed benefit-cost ratios from 3 to 400:1, based on measured travel time savings. Typical project costs ranged from $5,000 to $2.7 million dollars with most under $1 million. The project also improved safety with an average 35% reduction in injury crash rates after congestion mitigation from the bottleneck improvement. Since TxDOT took the time to evaluate the project outcomes, positive media attention and public feedback from commuters often followed.
| Barriers/Challenges | How They Were Overcome |
|---|---|
| Project Champion | Support for low-cost bottleneck projects was at a high level, including the District Engineer and MPO Director. |
| Project planning and programming requirements | Most solutions were over a short distance where air quality and environmental requirements were not necessary. |
| Lack of training | The Texas Transportation Institute developed a Freeway Bottleneck workshop that taught TxDOT about successful bottleneck removal. |
| Lack of incentives/recognition | TxDOT leadership formalized recognition for successful projects, rewarding Area Engineers during annual performance evaluations. |
| Design exception process is difficult | Over time, TxDOT gained the trust of FHWA staff by evaluating projects and showing the positive operational and safety benefits. |
For more information – http://www.bottleneckworkshop.org/
September 2011
FHWA-HOP-11-034
|
United States Department of Transportation - Federal Highway Administration |
||