| Skip
to content |
|
Freight and Air Quality Handbook2.0 Background on Freight-Related Air QualityUnderstanding the air quality issues and regulatory environment related to the freight sector is an important component of planning for transportation projects and specifically freight-related air quality projects (freight projects designed to reduce air pollutant emissions). This section provides background on the nature of freight-related pollutants and associated air quality impacts, the sources of freight emissions by mode, and the conditions, laws, and regulations that govern air quality and impact freight operations and investment decisions. It will provide transportation and freight practitioners less versed in air quality with basic information about air quality rules, regulations, and impacts, allowing them to better communicate with resource agency staff and environmental professionals. For those with broader air quality planning experience, it provides background information on the types of air quality impacts that are unique to freight movements and operations. 2.1 Emissions and Air Quality ImpactsThis section provides an overview about various types of air pollutants associated with the freight transportation sector, the health and environmental impacts of each, their impacts on regional and local air pollution and global issues (climate change), and some of the tools and methods used to calculate emissions. Specific types of air pollutants covered include:
2.1.1 Criteria PollutantsCriteria pollutants are a group of air pollutants for which the U.S. Environmental Protection Agency (EPA) sets National Ambient Air Quality Standards (NAAQS), following the requirements of the Clean Air Act (40 CFR Part 50). The EPA sets national guidelines ("criteria") for permissible levels of criteria pollutants, based on scientific knowledge of their human health and/or environmental impacts. The six criteria pollutants regulated by the EPA are:
2.1.2 Mobile-Source Air ToxicsMSATs are pollutants emitted from highway vehicles and non-road equipment. MSATs may have serious health effects, but unlike criteria pollutants they are not regulated by NAAQS. The seven MSATs of particular concern are acrolein; benzene; 1,3-butadiene; formaldehyde; diesel particulate matter and diesel exhaust organic gases; naphthalene; and polycyclic organic matter (U.S. Environmental Protection Agency, "Control of Hazardous Air Pollutants from Mobile Sources; Final Rule," Federal Register Volume 72, Number 37, Monday February 26, 2007: pages 8427-8570). Some of these chemicals (such as benzene) are present in gasoline and diesel fuel and are emitted through evaporation or when fuel passes through an engine without being burned. Others (such as formaldehyde and diesel particulate matter) are not present in the fuel itself; rather, they are byproducts of incomplete combustion. These compounds have a variety of potential human health effects. Benzene, for instance, is a known carcinogen, while formaldehyde and diesel particulate matter are probable carcinogens. An EPA study concluded that long-term inhalation of diesel exhaust probably poses a lung cancer risk and can cause other respiratory problems (United States Environmental Protection Agency, Health Assessment Document for Diesel Engine Exhaust, May 2002). 2.1.3 Greenhouse GasesGreenhouse gases (GHG) are gaseous compounds that trap heat in the earth's atmosphere. They can be naturally occurring or man-made. There are several greenhouse gases that are the result of human activity, but carbon dioxide (CO2) is the primary concern from a freight perspective, since it is formed through the burning of fossil fuels such as oil, natural gas, and coal. In 2007, the transportation sector produced about 32 percent of the nation's CO2 emissions, 60 percent of which was attributable to passenger vehicles. Much of the remainder came from freight sources (EPA, Inventory of U.S. Greenhouse Gas Emissions and Sinks: 1990 to 2007, April 2009). Unlike criteria pollutants or MSATs, greenhouse gases are global in nature and can remain in the atmosphere for very long periods of time (50 to 200 years in the case of CO2). GHGs are the cause of the "greenhouse effect," which refers to the rise in earth's temperature that results from atmospheric gases trapping the sun's heat. As such, GHGs (including CO2) are a primary contributor to global warming since they enhance the heat-trapping properties of the atmosphere. Since the Industrial Revolution, the concentration of carbon dioxide in earth's atmosphere has risen by about 30 percent, largely due to human activities. During the last 100 years, the global average surface temperature has risen by 1.33 degrees Fahrenheit; most of that increase (1.17 degrees Fahrenheit) occurred in the last 50 years (Intergovernmental Panel on Climate Change Working Group I, Assessment Report 4, November 2007). Increased concentrations of GHGs will likely accelerate this trend. Climate change can be linked to other environmental phenomena like sea-level rise, increased precipitation, and increased hurricane intensity. The recent warming of earth's atmosphere has been linked to melting sea ice (which affects currents and ecosystems) as well as melting glaciers and ice sheets on land (which raises the sea level). About one-third of the CO2 generated by the burning of fossil fuels is absorbed into the ocean, where it raises the acidity of surface water, which in turn can have potential negative effects on marine life (Grimond, J. "Troubled waters." The Economist, December 30, 2008). Besides the risks to life and property, climate change can adversely affect freight movements and transportation in general (Global warming may also enhance freight movement. There is a chance that melting Arctic sea ice will open up new shipping lanes through the Arctic Ocean, which would cut 2,000 miles off of a trip from Rotterdam to Seattle as compared to transiting through the Panama Canal). For example, it has been projected that an 18-foot storm surge (such as that produced by a hurricane) would inundate 41 percent of rail miles operated, 64 percent of Interstate miles, and 57 percent of arterial highway miles along the U.S. Gulf Coast (Climate Change Science Project, Potential Impacts of Climate Variability and Change on Transportation Systems and Infrastructure – Gulf Coast Study, March 12, 2008). 2.1.4 Emissions ModelingThere are a number of quantitative tools that air quality practitioners and transportation planners can use to estimate freight vehicle emissions and model their impacts. The EPA's MOVES2010 (Further information regarding MOVES2010 can be found on EPA's web site at http://www.epa.gov/otaq/models/moves/index.htm) model estimates emissions of VOC, NOx, PM (PM10 and PM2.5), CO, MSATs (benzene; 1,3-butadiene; formaldehyde; acetaldehyde; acrolein; naphthalene; ethanol; and MTBE), and greenhouse gases for cars, trucks, buses, and motorcycles outside California. In California, emissions analyses are conducted using the EMFAC2007 model. This model was developed by the California Air Resources Board and approved by EPA. Estimating emissions from freight movements also should consider non-road sources, like locomotives, ships, and aircraft (although non-road sources are not considered in the transportation conformity process described later in Section 2.3.1). This is especially important in communities with ports or significant rail traffic. EPA publishes emissions rates and methodologies for different types of rail movements (line-haul, shortline, switch, etc.) as well as aircraft. EPA also publishes guidance on estimating marine vessel emissions. EPA's NONROAD model can be used to estimate emissions from non-road sources other than ships, trains, and aircraft. This would include cargo handling equipment like port gantry cranes, forklifts, and container handlers. Other EPA modeling tools include:
2.2 Freight Sources of Air PollutnatsMost freight emissions are from diesel engines, and diesel exhaust is a major source of PM, NOx, and SOx pollutants. This section will focus on the characteristics that differentiate among the modes (fuels, mode of operation, etc.). The different modes include trucks, marine vessels and ports, rail vehicles, and air cargo. 2.2.1 TruckTrucks remain the most dominant mode for freight movements, by weight, value, and ton-miles. In 2007, trucks carried about 61 percent of total freight tonnage in the United States, and more than 65 percent of total freight value (Federal Highway Administration, Freight Analysis Framework). The EPA has introduced stringent new caps on emissions of PM, NOx, and other pollutants for model year 2007 and later trucks. At the same time, it mandated the use of ultra-low sulfur diesel (ULSD) in heavy-duty trucks produced since the 2007 model year, which enables the use of more advanced pollution control technology in diesel engines (higher sulfur fuels can "poison" the catalyst used in NOx and PM aftertreatment technologies). To support that rule, refiners began producing ULSD in mid-2006, and its use was required for the on-road fleet in 2007. However, there are still millions of older trucks in the nation's fleet that lack these new aftertreatment technologies. In any case, many of these trucks were built before the most recent emissions standards for diesel engines came into effect, which limits the effect of the new standards in the short term. Vehicle maintenance also can affect truck emissions; poorly maintained trucks often emit more than those that are kept in good running condition. Unlike locomotives, trucks are not subject to engine rebuild emissions standards. It should be noted that 10 percent of medium- and heavy-duty truck fuel consumption is from gasoline trucks. Emissions from gasoline-powered freight vehicles are an important contributor to freight-related emissions. 2.2.2 Marine Vessels and PortsMarine cargo vessels and port complexes are the second largest source of diesel freight emissions. In addition to cargo ships, ports use cranes, hostlers, and other equipment powered by diesel fuel. Cargo vessels typically burn bunker fuel (also known as residual fuel because it is literally left over from the refining process), a form of diesel fuel with particularly high sulfur content. Bunker fuel is the most common fueling option because of its low cost; considering that a typical cargo ship burns 120 gallons of fuel per mile (Barry, K. "Toyota's Solar Car Carrier." Wired Blog Network, September 3, 2008). They are major contributor to air quality issues in coastal regions, especially those related to sulfur oxides. Researchers have estimated that ships burning this type of fuel are responsible for as many as 60,000 deaths per year worldwide and cost the U.S. economy about $500 million annually (Corbett, J., Winebrake, J., Green, E., Kasibhatla, P., Eyring, V., and Lauer, A. "Mortality from Ship Emissions: A Global Assessment." Environmental Science and Technology, November 5, 2007). Another study found that as much as 44 percent of the primary sulfates (a very small particulate matter found in diesel exhaust) in the air in California coastal areas comes from ships (McDonald, K. "Dirty Smoke from Ships Found to Degrade Air Quality in Coastal Cities." University of California, San Diego News Center, August 18, 2008). Marine diesels are classified by the EPA into Category I, II, and III engines. Category III engines are the very large engines used on oceangoing cargo vessels such as containerships. These engines are the primary users of bunker fuel. Category I and II engines generally burn cleaner distillate fuel. However, these engines are subject to less stringent emissions regulations than diesel engines designed for on-road use. In addition to the ships themselves, cargo handling equipment at ports are often powered by diesel engines. These can include container cranes (Most modern container cranes use electric power, but there are still many older diesel-powered cranes in use) (which offload cargo containers from ships for transfer to trucks or trains), forklifts, terminal tractors, and container handlers, among other things. Although many of these vehicles utilize clean-diesel technologies (and many ports mandate the use of such technology), they still contribute to air quality issues around ports. 2.2.3 RailRail locomotives are another source of significant diesel exhaust pollution. There currently are 20,000 freight locomotives in use across the country (Palaniappan, M., Prakash, S., and Bailey, D. Paying With Our Health: The Real Cost of Freight Transport in California. The Pacific Institute, November 2006). Rail is often held up as a clean alternative to trucks, and it is true that one train can move an equivalent volume of 250 trucks, and that trains enjoy about a three to one advantage in fuel efficiency (emissions per ton/mile) over trucks. However, emissions standards for locomotives lag behind those for trucks, and many older locomotives that are still in use predate even the most basic regulations (more stringent locomotive emissions requirements are slowly being phased in and are described in Section 2.3.2). Locomotives have 30- to 40-year service lives, so older, more polluting models remain in use longer than trucks typically do, although engines are typically rebuilt every 600,000 to 1,000,000 miles (Stodolsky, F. (2002). Railroad and Locomotive Technology Roadmap. Argonne National Laboratory, Center for Transportation Research, ANL/ESD/02-6). Like trucks, trains emit significant amounts of NOx and particulate matter. In addition, rail freight is growing for a number of reasons. These include escalating fuel costs (which plays to rail's fuel efficiency advantage) and a shortage of truck drivers. The U.S. Department of Transportation estimates that total rail freight tonnage will grow by 73 percent between 2006 and 2035 (Federal Highway Administration, Freight Analysis Framework). The EPA estimates that without new controls, locomotives and ships will contribute 27 percent of total mobile source NOx and 45 percent of mobile source fine diesel particulate matter (PM2.5) emissions by 2030 (http://www.epa.gov/nonroad-diesel/420f04041.htm). Freight rail locomotives fall into two groups: 1) line-haul locomotives; and 2) switchyard locomotives. Line-haul locomotives are the more powerful engines that the railroads use to move large freight trains between major hubs. Switchyard locomotives are less powerful and are used to disassemble and reassemble trains by moving cars around at a rail yard. Line-haul operations, involve a greater proportion of operating time at high power levels, while locomotives engaged in switching operations typically spend most of their time at a lower power output, starting and stopping, or at idle. This tends to increase emissions for switchers, since frequent acceleration and deceleration requires more power than cruising at a constant speed. Railroads also tend to "sunset" older locomotives by shifting them from line-haul duty to switchyard functions, meaning that rail yards (sometimes located in dense urban population centers) often end up with the oldest, most polluting locomotives; however, these locomotives are subject to updated engine-rebuild emissions standards when they go through major overhauls. 2.2.4 Air FreightAir cargo is a very small part of total freight movements in the United States, when measured by weight. This is because moving goods by air is very expensive. Generally, light, higher-value, more time-sensitive commodities move by air. In fact, despite being less than one percent of total freight volumes in 2006, air cargo movements comprised seven percent of total freight value that year (Federal Highway Administration, Freight Analysis Framework). Air cargo movements are expected to grow faster in volume than other modes (with growth rates of up to four percent annually by some estimates (FHWA and ICF Consulting, Assessing the Effects of Freight Movement on Air Quality at the National and Regional Level, April 2005)), so they will likely contribute more to air quality problems in the future, especially in large urban areas with major airports. In addition, air movements almost always require a truck trip on either side of the shipment (air-rail moves are possible, but rare), so truck volumes and their associated emissions grow along with air cargo moves. Cargo and baggage handling equipment at airports primarily serves passenger jets, but also is a source of airport-related emissions. It is hard to isolate air freight emissions because a large proportion of air cargo is carried in the cargo holds of commercial passenger aircraft. The FHWA estimates that just 0.1 percent of NOx and 0.2 percent of PM10 emissions related to freight come from air cargo operations. However, in some cities the proportion is much higher; in Los Angeles, for example, air freight accounts for 0.5 percent of total freight NOx emissions and 0.3 percent of freight PM10 emissions (Ibid). All jet aircraft (passenger and freight) emit VOCs, NOx, SO2, and CO. Aircraft operations that occur below 3,000 feet are considered to have an impact on ground-level air quality. Like locomotives, commercial jets have long service lives (25 to 40 years), so it can take decades before technological improvements or new regulatory standards that reduce emissions show up in the majority of the fleet. 2.2.5 Total Emissions by Mode and Expected TrendsTrucks accounted for 46 percent of freight-related NOx emissions in 2005, the largest share of any single mode (Figure 2.1). While trucks' share of total emissions for both pollutants has declined in recent years due to the advent of stricter emissions regulations, they still account for a significant amount of freight emissions because most freight in the United States moves by truck. Marine vessels made up the next largest share at 38 percent, followed by railroads (16 percent) and air cargo (less than 1 percent). In contrast, ships comprised 57 percent of PM10 emissions in 2005, compared to 34 percent for trucks, 9 percent for rail, and less than 1 percent for air cargo. Figure 2.1 Total NOx and PM10 Emissions by Mode (2005) 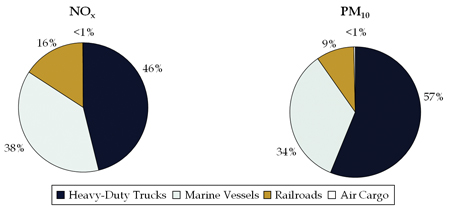
Source: EPA 2005 National Emissions Inventory. The share of emissions by mode can vary significantly by region. For example, over 23,000 tons of NOx in the Chicago region in 2002 (19 percent of total freight emissions) came from freight rail, reflecting that region's status as a major North American rail freight hub. Similarly, marine operations accounted for a large proportion of PM10 freight emissions in Houston (40 percent) and Los Angeles (37 percent), a result of the major port facilities present in those cities (FHWA and ICF Consulting, Assessing the Effects of Freight Movement on Air Quality at the National and Regional Level, April 2005). With the exception of air freight, most of the modal sources of freight pollution are expected to decline in the future (Figure 2.2) (This forecast uses a 2002 base year. With the gradual phasing in of stricter regulations beginning in 2007 (particularly for truck and rail), the declines would likely be more modest if a more recent base year were used, but would still be substantial given fleet turnover rates). These reductions will largely be the result of stricter EPA regulations governing mobile source emissions. Heavy-duty truck emissions are expected to decline the most (by about 82 percent), with freight rail emissions declining by 43 percent. Marine emissions are expected to decline much more modestly due to less stringent regulations and the fact that most cargo vessels calling on U.S. ports are foreign flagged and, therefore, not subject to EPA regulations. Air freight PM10 emissions are expected to decline slightly, but NOx emissions related to air cargo will increase by 51 percent by 2020. Overall, PM10 emissions from freight sources are expected to decline by 5 percent annually through the year 2020, resulting in a 63 percent total decline; NOx emissions will decline by 4 percent per year (50 percent overall). Figure 2.2 Future Freight-Related NOx and PM10 Emissions Change by Mode (2010 and 2020) 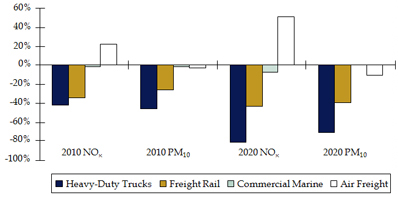
2.3 Regulatory EnvironmentThis section provides an overview of Federal, state, and local laws and regulations dealing with emissions and air quality, as well as agency roles and responsibilities. Each level of government has a distinct set of responsibilities related to transportation and environmental protection, as shown in Figure 2.3.
Figure 2.3 Agency Roles and Responsibilities 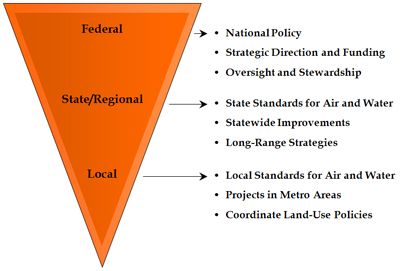
The following sections discuss the Federal, state, and local roles in more detail to provide a complete picture of the regulatory environment affecting freight and air quality. 2.3.1 Clean Air ActThe Clean Air Act (CAA) was first enacted in 1963 and has been revised many times since then. The Clean Air Act of 1970 represented a major shift in Federal pollution control activities by authorizing comprehensive requirements for the control of stationary, area and mobile source emissions. The most recent revisions (in 1990), often called the CAA Amendments or CAAA, increased the authority and responsibilities of the Federal government. Air Quality StandardsAs discussed in Section 2.1.1, the national ambient air quality standards (NAAQS) set limits for six criteria pollutants: CO, NO2, O3, PM, SO2, and lead. The CAA requires that areas exceeding the limits for one or more of the criteria pollutants (as measured through air quality monitoring) be designated as nonattainment. States that have nonattainment areas are required to develop a State Implementation Plan (SIP), which is a detailed description of the resources and programs a state will use to achieve and maintain NAAQS. The SIP is based on analytical methods approved by the EPA and is developed in consultation with local transportation and resource agencies. A state's SIP can incorporate freight issues; for example, the Texas SIP for the Houston-Galveston region includes a transportation control measure that focuses on NOx reductions and includes a voluntary emissions program for railroads. Areas which were previously designated as nonattainment but have consistently met the NAAQS over a 3-year period with no violations on their monitors are redesignated as attainment and called maintenance areas. Maintenance areas must develop maintenance SIPs which show how the area will maintain the NAAQS for two 10-year periods. The CAA requires the Federal government to conform to air quality goals in the SIP before approving or funding any activity. Conformity (Transportation conformity is covered under 40 CFR Parts 51 and 93, Subpart A, while general conformity is covered under 40 CFR Parts 6, 51, and 93, Subpart B) is the process used to meet this requirement. Freight activities are either covered under transportation or general conformity, depending on which Federal agency is funding and/or approving the project. Transportation conformity only applies to on-road mobile sources – not freight rail, marine, or aviation – in nonattainment and maintenance areas for transportation-related pollutants (ozone, CO, PM10, PM2.5 and NO2). It specifically applies to metropolitan transportation plans, programs and projects developed, funded, or approved under title 23 U.S.C. or Federal Transit Laws. General conformity applies in nonattainment and maintenance areas for all criteria pollutants. It also applies to all other Federal actions not covered under transportation conformity, such as airports and railroads. Interagency consultation should be used to determine how the conformity requirements are met for a particular freight project. Mobile Source Air Toxics (MSAT)MSAT analysis may be relevant in some cases. In February 2007, EPA promulgated new regulations to reduce MSATs by limiting the amount of benzene in gasoline and reducing emissions from passenger vehicles and gas cans. The FHWA has published interim guidance for project sponsors conducting MSAT analysis, which is encouraged but not required for environmental documentation on Federally funded transportation projects (FHWA, 2009: "INFORMATION: Interim Guidance Update on Mobile Source Air Toxic Analysis in NEPA Documents." Memorandum from April Marchese, Director, Office of Natural and Human Environment, September 30, 2009. https://www.fhwa.dot.gov/environment/airtoxic/100109guidmem.htm). FHWA uses a three-tiered approach with projects divided into groups:
Emissions StandardsThe Clean Air Act and its amendments also set emissions standards for new engines and vehicles, including freight vehicles. Diesel engines used in freight applications can be grouped into two broad categories:
Truck Emissions Standards Heavy-duty vehicles are defined as vehicles for commercial use that have a gross vehicle weight rating above 8,500 pounds. EPA emissions standards are divided into three groups depending on the date of vehicle manufacture:
Locomotive Emissions Standards EPA regulations governing locomotive emissions are organized into five Tiers (0 through 4). Tiers 3 and 4 were introduced in new EPA regulations in 2008, along with strengthened standards for Tiers 0 through 2. The EPA uses a dual-cycle approach, meaning that all locomotives must comply with both line-haul and switch standards. Tiers 0 through 2 are the currently applicable emissions standards:
Marine Engine Emissions Standards As noted in Section 2.2.1, marine diesel engines are divided into three categories. The categories are based on displacement per cylinder (Cylinder displacement should not be confused with vessel displacement, which refers to the mass of a ship and the equivalent amount of water the vessel displaces while floating). The EPA regulates marine engines differently based on which category they fall into:
There are some regional differences in standards for marine engine emissions and fuels. For example, the California Air Resources Board (CARB) is implementing regulations that will require oceangoing vessels operating within 24 miles of the California coastline to use diesel fuel with 0.5 percent or less sulfur content beginning July 1, 2009. By 2012, vessels must use fuel with 0.1 percent or less sulfur. Non-Road Engine Emissions Standards There are two types of non-road engines: mobile and stationary. Mobile engines are often found on self-propelled vehicles, but portable equipment (such as generators) are included. Mobile engines are used in a wide variety of applications, including construction vehicles, forklifts, and farm tractors. Mobile cargo handling equipment such as container lifts are a freight-specific example. Stationary engines are not portable and do not appear on self-propelled vehicles; a freight example would be a diesel-powered cargo crane. Mobile diesel engines are subject to a set of tiered emissions standards similar to those adopted for locomotives:
Emissions from stationary engines were previously unregulated by EPA, which had led to a complex patchwork of state and local regulations. In 2003, Environmental Defense Fund (an advocacy group) brought a lawsuit against the EPA to require the agency to promulgate regulations governing stationary engines. In the consent decree that settled the suit, EPA agreed to adopt emissions standards for stationary engines. As a result, most stationary engines are subject to the same Tier 1 through 4 emissions requirements as mobile non-road engines. However, stationary diesel engines displacing 10 or more liters per cylinder are subject to the Tier 2 standards for Category 2 marine engines. Aircraft Emissions Standards The International Civil Aviation Organization (ICAO) typically leads the development of emissions standards for aircraft. ICAO standards cover NOx and CO emissions, as well as smoke and vented fuel. The latest standards were adopted in 2005 and apply to commercial aircraft engines certified after December 2007 generating more than 26.7 kilonewtons of thrust. The limits are based on a reference landing and takeoff cycle below 3,000 feet, but they also help limit high-altitude emissions (NOx is a precursor to ozone, which is a greenhouse gas at altitude). Aircraft emissions standards in the United States have been aligned with ICAO standards since 1997. The EPA sets U.S. emissions standards for aircraft, which are enforced by the Federal Aviation Administration (FAA). At the present time, EPA does not regulate GHG emissions from aircraft, which account for about 10 percent of transportation-related GHG emissions according to the U.S. DOT (U.S. DOT Center for Climate Change and Environmental Forecasting). However, there is growing pressure for them to do so, as shown by a series of petitions filed by states, regional governments, and environmental groups in late 2007. The petitions requested that the agency make a determination as to whether GHG emissions from aircraft and marine vessels present a danger to public health, and if so, to issue regulations controlling them. The EPA issued an Advanced Notice of Proposed Rulemaking (ANPR) in July 2008. Although the ANPR does not directly address the petitioners' requests, it does compile comments from other agencies on regulating GHG emissions and raises potential issues that may be encountered. 2.3.2 National Environmental Policy ActThe National Environmental Policy Act (NEPA) was signed into law on January 1, 1970. The Act establishes national goals for the protection, maintenance, and enhancement of the environment and stipulates the process for implementing the goals within and among different Federal agencies. It represents a national framework for environmental protection. The basic premise of the law requires the Federal government to create and maintain conditions allowing man and nature to coexist in harmony. Federal agencies are required to incorporate environmental considerations into everyday decision-making using a consistent, systematic approach. Transportation projects (including those for freight transportation) are required to undergo the NEPA process if they involve Federal funds or permits. Air quality is one of the impacts considered in the NEPA process (40 CFR 1508.27(b)(2) and (10)). The NEPA process varies based on the scope of the proposed project. There are three levels of NEPA analysis:
2.3.3 State Regulations and ResponsibilitiesMany states have implemented their own air quality and environmental impact laws. These laws are typically very similar to the Clean Air Act and NEPA. Some states enact NEPA-like environmental clearance processes to deal with projects that do not receive Federal funding and thus are not subject to NEPA. Other states have determined that NEPA requirements do not go far enough in terms of environmental protection, and have, therefore, instituted more stringent regulations. The most notable is California, which faces significant air quality challenges due to its high population (and ensuing traffic congestion and growth in vehicle-miles traveled) and its status as a marine freight gateway for the entire United States. Certain geographic characteristics (mountainous areas with valleys in between) combined with climate conditions such as prevailing wind patterns also create areas that are uniquely susceptible to air quality problems. The California Environmental Quality Act (CEQA) requires all public agencies to "avoid or minimize environmental damage where feasible (Title 14 California Code of Regulations, Chapter 3, "Guidelines for Implementation of the California Environmental Quality Act")." Structured similarly to NEPA, government agencies in California are required to consider the environmental impacts of public and private activities that they regulate. Like NEPA, there is a list of projects that are exempt from CEQA requirements. Similar to NEPA, although CEQA does not apply to the development of regional or state transportation plans and programs, the projects that are developed following those plans and programs are subject to CEQA requirements. For projects that involve more than one public agency, a designated lead agency prepares the required documentation; the other agencies are required to consider those documents before approving or acting upon the proposed project. In this way, CEQA mandates extensive coordination between public agencies when reviewing projects, including those related to transportation. 2.3.4 Local Regulations and ResponsibitiesAs mentioned above, MPOs are largely responsible for making determinations of transportation conformity with respect to their planning and programming activities. Local agencies often enact other regulations that can affect freight transportation and emissions. These can include anti-idling laws and other actions designed to minimize the impact of freight movements on local communities. Municipal public works or transportation departments can be instrumental in providing adequate access to freight-generating businesses like distribution centers. Local jurisdictions also are normally responsible for land use and zoning restrictions, which can affect freight movements and freight-related emissions. Land uses have an impact on truck travel patterns (including volume and the way trucks are distributed) since some land uses generate more freight than others. Similarly, localities can collocate industrial uses with intermodal freight facilities to increase the viability of rail, which can affect air quality. Previous Section | Next Section | Top |
|
United States Department of Transportation - Federal Highway Administration |
||