| Skip
to content |
|
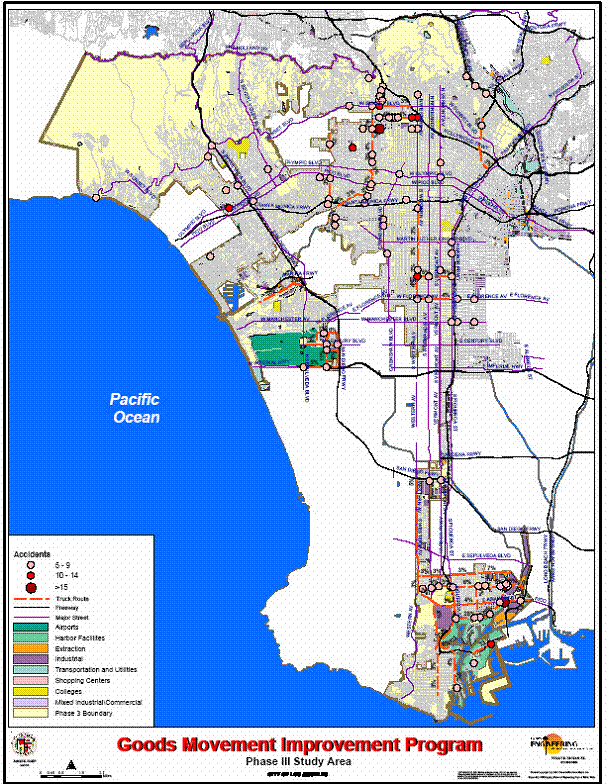
Urban Freight Case Studies - Los AngelesNOTABLE PRACTICESGIS AnalysisLADOT used GIS analysis to identify truck routes, truck circulation and access problems, hazardous locations, and corrective measures. LADOT undertook this project as part of the effort to develop the Goods Movement Improvement Plan. MethodologyThe first step was to identify the study areas. Phase 1 examined the industrialized area east of downtown Los Angeles. Phase 2 focused on City suburbs, including Northeast Los Angeles and the San Fernando Valley. Phase 3 covered areas not explored in the first two phases, including Hollywood, Mid-City, South Los Angeles, West Los Angeles, Los Angeles International Airport, and the Port of Los Angeles. Sub-areas were identified on an as-needed basis. After the study area for each phase was defined, work began on the impediments to efficient goods movement. LADOT identified routes that trucks use to travel between Interstates and local freight attractors and generators by compiling truck count data and information from trucks studies from the City of Los Angeles. Truck count data were geo-coded to illustrate areas experiencing high truck volumes. Using the data, LADOT calculated the truck share of all traffic on all roadways and designated de-facto truck routes. Truck routes were defined as roads that have existing truck volumes of 6 percent or greater for the downtown area and 3 percent or greater for suburban areas. These de-facto truck routes and those identified in previous studies were added to the City's GIS database. LADOT also added other information to the GIS database, such as truck-generated land uses, freeway entrances and exits, railroad grade crossings, and the percentage of trucks using specific roadway segments. Moreover, LADOT collected data on truck-related crashes that occurred over the previous five years and the Level of Service (LOS) at various intersections on designated truck routes. Locations with more than five crashes over a five-year period were geo-coded. Figure 2 illustrates the type of map produced for each phase of the study. Figure 2: Sample GIS Map
Source: Los Angeles Department of Transportation, Improving Truck Movement in Urban Industrial Districts: Application of GIS, Accident and Field Data (Los Angeles, CA: 2005). After fully documenting the existing system in the GIS, LADOT gathered input through interviews with various stakeholders, including trucking companies, local businesses, other agencies, and elected officials. It gained input on issues that hinder efficient goods movement through and within the City. These issues were documented and, where applicable, included in the GIS database. LADOT then sent its engineers out to the field to observe problem locations identified by stakeholder input, truck-volume data, and crash data. By observing the circulation of trucks around specific locations throughout the City, LADOT engineers were able to better describe the real-world problems experienced by commercial vehicle operators. The documentation produced by LADOT engineers included the exact location, time of day, description of issues encountered, photographs, and videos. The research identified 75 problem locations: 43 in greater downtown Los Angeles, 20 in Northeast Los Angeles and the San Fernando Valley, and 12 in the rest of the City (Hollywood, Mid-City, South LA, West LA, Los Angeles International Airport, and the Port of Los Angeles). Table 1 lists the wide-ranging issues identified during the research. Table 1: Recurring Issues and Deficiencies
Based on the detailed problem descriptions, LADOT developed a list of potential solutions that fall into four categories: 1) Operational Improvement Measures, 2) Engineering Improvement Measures, 3) Capital Improvement Measures, and 4) Programmatic and Policy Measures. Table 2 illustrates some of the specific problems identified in the three phases of the study and recommended solutions. Through extensive marketing efforts, the City of Los Angeles continues to push for the implementation of these solutions. As a result, the City received $2 million funding from Metro for implementation of six projects that improve the efficiency of goods movement. Table 2: Examples of Project Identified in the Goods Movement Improvement Plan
Project Costs/BenefitsThe costs associated with the development of a GIS database will differ by agency and jurisdiction and depend on the availability of transportation-related data. Many agencies, including LADOT, maintain a database of roadways and other transportation facilities. In this case, the costs associated with the development of a freight-focused GIS database include the collection of truck-specific data, analysis, and report preparation. Although the initial cost of developing a similar database may be substantial for a smaller jurisdiction, the tool can be used by several agencies, updated easily, and tailored to meet the needs of other agencies. By creating this system of documentation and analysis, future planning efforts are enhanced. Lessons LearnedThe lessons learned during the development of a freight-focused GIS database can be transferred to other jurisdictions and agencies undertaking similar projects. Several of the lessons learned during this project include:
TransferabilityThe LADOT strategy to locate and document truck-related problem areas and develop solutions can be adopted and implemented by any size jurisdiction. With slight modifications, this strategy can be simplified to fit the needs of a smaller community or enhanced to develop a more extensive database. By using GIS to document and analyze goods movement or other transportation issues, agencies can build a tool that can be easily updated to support future planning efforts. According to LADOT, an agency needs to collect data on land use, traffic and truck volumes, and truck crash rates, in order to begin work on developing a freight-focused GIS database. Although many jurisdictions maintain GIS programs with road and land-use layers, some have not yet begun to geo-code information on traffic volumes and crash rates. Therefore, the current state of an agency's GIS program and availability of analytical staff will determine the cost and effort needed to develop a freight-focused GIS database. previous | table of contents |next | |||||||||||||||||||||||||||||||||||||||||||||||||||||||||||||||||||||||||||||||||||||||||||||
|
United States Department of Transportation - Federal Highway Administration |
||