
More and more, transportation system operators are seeing the benefits of strengthening links between planning and operations. A critical element in improving transportation decision-making and the effectiveness of transportation systems related to operations and planning is through the use of analysis tools and methods. This brochure is one in a series of five intended to improve the way existing analysis tools are used to advance operational strategies in the planning process. The specific objective of developing this informational brochure series was to provide reference and resource materials that will help planners and operations professionals to use existing transportation planning and operations analysis tools and methods in a more systematic way to better analyze, evaluate, and report the benefits of needed investments in transportation operations.
Figure 1. Analytical Methods/Tools and Related Case Studies Developed Under this Project
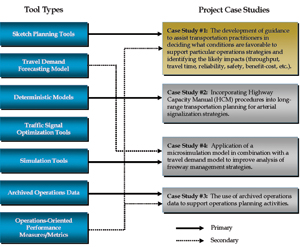 Figure 1 - flow chart - The figure shows that the four case studies represent a variety of the traffic analysis tool types. Each case study supports a primary tool type and several also support multiple case studies. Case study number one is highlighted to represent the contents of this document and it primarily supports the sketch planning tool type and it also includes operations-oriented performance measures/metrics as a secondary tool type.
The series of brochures includes an overview brochure and four case studies that provide practitioners with information on the feasibility of these practices and guidance on how they might implement similar processes in their own regions. The particular case studies were developed to illuminate how existing tools for operations could be utilized in innovative ways or combined with the capabilities of other tools to support operations planning (The use of the term “Tools” in this context is meant not only to include physical software and devoted analytical applications, but is also intended to encompass more basic analysis methods and procedures as well). The types of tools considered when selecting the case studies included:
Additional information on these existing tool types is presented in the overview brochure to this series.
In selecting the case studies to highlight in this brochure series, a number of innovative analysis practices and tool applications were considered. Ultimately, four different case studies were selected from among many worthy candidates. Each of these case studies represents an innovative use of one or more of the tool types listed above. Figure 1 presents the topics of the case studies and maps them to the related tool. Although individual case studies were not developed for each tool category, this should not be considered as a measure of indictment of the ability of any tool type to be used in innovative ways to support operations planning – there simply weren’t project resources to identify and document all the innovative practices being used. Likewise, the selection of a particular case study representing a specific tool should not be construed as the only manner in which to apply the particular tool. Instead, the case studies represent a sampling of the many innovative ways planners and operations personnel are applying these tools currently.
This particular case study focused on compiling information on various operations strategies into an easily accessible format in order to promote a greater understanding of the strategy impacts. As previously shown in Figure 1, this case study is most reflective of “sketch planning tools.” The information compiled and organized focused on the following two separate areas:
The guidance provided in this study is intended to bridge a common knowledge gap faced by many deploying agencies and aims to answer the questions: “what situations are most conducive to operational strategy deployments” and “what are the likely impacts of the strategies under consideration.” By providing this information, this study is intended to aid planners and operational personnel in conducting preliminary analysis and screening of the need for operations strategies and in comparing the relative impacts of various strategies.
This specific case study was unique among the four conducted under this project in that it did not involve the direct participation of a particular state, regional, or local agency. Instead, this case study was led by Cambridge Systematics with support from Noblis, Inc., which conducted literature searches and research of the impacts and deployment guidance.
A significant effort has been made by Federal, state, and local transportation agencies in quantifying and documenting the impacts and benefits associated with the deployment of various operations strategies. Many of these impact studies have been compiled in national, cross-cutting database repositories such as the U.S. DOT ITS Benefits Database (http://www.itsbenefits.its.dot.gov/), and other libraries maintained by agencies and research institutions. These impact studies have also served as the basis for developing recommended impact ranges for different strategies used in several operations analysis tools developed by Federal, state, and regional agencies. While these resources provide extremely useful and detailed information to practitioners, the amount of documentation and quantity of information can be overwhelming, thus limiting practitioners from quickly obtaining a high-level understanding of the range of impacts associated with particular strategies. Simple questions, such as “What is the average impact on safety of adding ramp metering?” cannot be easily answered without scanning multiple documents.
In addition to the information on the likely benefits of operations strategies, some agencies have begun to develop guidelines for identifying conditions where operations strategies are warranted. The development of these guidelines is still in its infancy and these often take the form of suggested thresholds or rules-of-thumb regarding deployment conditions that are favorable to particular strategies. Over time it is expected that this deployment guidance will become more common and more detailed as the thresholds are vetted against real-world conditions.
The purpose of this case study was to assemble this impact data and deployment guidance into a spreadsheet format that was readily accessible and could easily be customized by practitioners. Two separate spreadsheets were developed:
Each spreadsheet was developed in a simple format that may be freely modified by individual practitioners to add new data as it is discovered, or to serve as a repository for their own customized impact ranges or deployment guidelines. The spreadsheets are available for download at the following link http://www.plan4operations.dot.gov/casestudies/analysis.htm.
The ultimate objective of developing these spreadsheets was to provide a valuable reference source for this information in order to improve access to the data by planners and operational staff, and provide this in a format that could be easily used and updated by these individuals.
The summary information presented in the Impacts Summary provides a valuable reference source for information on the order of magnitude impacts observed in other regions that have deployed particular operations strategies. This data is provided in a format that can be easily used and updated by individual practitioners to develop their own impact repositories.
To illustrate how this data and the Impacts Summary can be used by practitioners to improve their planning for operations, several hypothetical applications are discussed below that show how the tool could have been applied in several previously conducted studies.
In the early 2000s, the Ohio-Kentucky-Indiana (OKI) Regional Council of Governments undertook a major study to estimate the benefits of the current and future planned ITS deployments in the Cincinnati region. The region decided to conduct the analysis using the FHWA ITS Deployment Analysis System (IDAS) software. The IDAS tool estimates impacts of ITS deployments using default impact rates for different strategies based on national averages of impacts observed in other regions.
Prior to implementing the analysis, OKI wanted to assess the appropriateness of the default rates based on national averages for application in the Cincinnati region (i.e., to determine if the national averages were reflective of the conditions in Cincinnati). To accomplish this, a comprehensive literature review was undertaken to find particular studies that had been conducted in regions of similar size, geography, and climate. Findings from these studies were then compared with the default national averages to assess if particular impacts should be adjusted in the analysis. Studies that were found from more similar regions (e.g., Columbus, Nashville, St. Louis) were given more weight in this assessment while studies of impacts from widely differing regions (e.g., Los Angeles) were given less weight. The result of this activity was adjusted impact factors for a wide range of ITS deployments that OKI felt were more representative of the Cincinnati region than the default national averages.
Had the Impacts Summary spreadsheet been available at the time, this research and adjustment process could have been greatly streamlined. The researchers could have first consulted the spreadsheet to identify similar regions where impact findings were available. The impacts from these regions could have been quickly compared with the findings from other regions to assess whether there were discernable differences in impacts based on these regional characteristics, and any difference could have been investigated by utilizing the reference notations in the spreadsheet to obtain the full study documentation for studies that were particularly interesting. Use of the Impacts Summary spreadsheet in this way would have eliminated weeks of time and effort from this example application.
The Florida DOT (FDOT) recently conducted the development of an ITS Benefits Repository. This effort was undertaken to identify and document standardized estimates of impacts that could then be used similarly in all ITS planning studies statewide. This will ensure a more level, apples-to-apples comparison of ITS project funding requests received from different regions of the State.
The Florida DOT effort utilized the ITS benefits library in the FHWA’s IDAS Tool, which is set up similarly to the Impacts Summary, but not in an as user-friendly format. The information regarding impacts observed in other regions was compared with averages as well as the engineering judgment of FDOT staff regarding impacts of particular strategies. Once a standard impact value had been agreed upon, it was documented back into a spreadsheet format for archiving. The final spreadsheet was then distributed to all ITS plan ners and operations personnel in the State.
Other regions could conduct a similar exercise utilizing the Impacts Summary worksheet. This would provide access to a greater amount of information than is currently available in the IDAS tool, and would not require the purchase of any software. The Impacts Summary spreadsheet could be easily modified by any agency to serve as an archive of their own standardized impacts, simply by adding a “our preferred value” column to any strategies the agency wants to document. The spreadsheet format also aids in distribution of the customized repository or any updates.
This section briefly summarizes the procedures followed in developing the guidance for practitioners. Subsequent sections provide greater detail on how practitioners can best use the developed guidance. The following steps were used in developing this guidance:
The study team first reviewed the format of some of the existing resources providing information on the observed or potential benefits of various operations strategies. Resources reviewed included the U.S. DOT ITS Benefits Database and the FHWA’s ITS Deployment Analysis (IDAS) tool.
Based on the need to develop a simple and accessible reference, a spreadsheet format was selected. The study team decided to categorize similar strategies (e.g., signal coordination) on individual worksheets within the spreadsheet and to differentiate variations of the strategies (e.g., pre-set timing versus traffic actuated signal coordination) in the various rows of the worksheet. Columns in the worksheet were used to categorize various performance measures impacted by the particular strategies. For consistency, all the worksheets in the spreadsheet were formatted similarly so that the performance measure column headings are the same on all sheets, regardless of whether or not there were observed impact data available for the particular strategy. Both the Impacts Summary and the Deployment Guidelines spreadsheets were developed using this format; however, the Deployment Guidelines spreadsheet does not include the performance measures categorization.
Next, the research team identified the strategies and categories of strategies to be included in the spreadsheets and developed a list of performance measures that could be impacted by the various strategies. The IDAS tool provided the initial basis for identifying and categorizing the various operations strategies. The strategy categorization used in IDAS was initially based on the ITS National Architecture’s Market Packages; however, many of the Market Packages were further disaggregated to identify specific strategies that were more consistent with the way that practitioners typically deployed them. Over 60 individual strategies are identified in IDAS, grouped into 12 major categories as shown in Table 1. All of the IDAS identified strategies, with the exception of the “Generic Deployments” which are specific to the IDAS tool, were used to develop the preliminary list of strategies for this project.
Table 1. Operations Strategies in IDAS
Arterial Traffic Management Systems
Freeway Management Systems
Advanced Public Transit Systems
Incident Management Systems
Electronic Payment Systems
Railroad Grade Crossing Monitors
Emergency Management Services
Regional Multimodal Traveler Information Systems
Regional Multimodal Traveler Information Systems (continued)
Commercial Vehicle Operations
Advanced Vehicle Control and Safety Systems
Supporting Deployments
Generic Deployments
Additionally, several new operations strategies not currently available in IDAS were identified to supplement the list based on feedback from practitioners. These strategies include the following:
Once the various strategies were identified, a list of performance measure categories was developed. These performance measure categories were based on impact categories listed in the ITS JPO’s ITS Benefits Database and in the IDAS software. Merging the performance measure categories in these two resources resulted in the following impact categories:
Research was then conducted to identify studies that could be used to populate the cells of the spreadsheets. For the Impacts Summary, data was first compiled from the internal IDAS benefits library and the ITS Benefits Database. This data was updated through searches of more recently conducted impact studies and through additional research. This additional research was particularly useful in compiling impact information for some strategies that had not been previously included in IDAS or the ITS Benefits Database, such as Congestion Pricing and Work Zone Management. For consideration in the Impacts Summary the identified data minimally must include the following:
The identification of the impact in the spreadsheet is generally terse, for example the following entry summarizes one regions observed safety impacts of ramp metering: “Minneapolis St. Paul – Average number of peak period accidents decreased by 24 percent.” These entries were kept brief because the goal of this Impacts Summary was to provide a quick reference guide for practitioners, not to provide a detailed assessment of each impact study. Therefore, the research team did not attempt to compile data at the comprehensive level of detail of the ITS Benefits Database or other similar sources.
For the Deployment Guidelines spreadsheet, research was conducted to identify state or local agencies that have developed guidelines or thresholds for identifying problem locations or conditions that are appropriate for deployment of various operations strategies. This research included contacting a number of state DOTs known to be investigating these types of guidelines. Information regarding guidelines, thresholds, or warrants for determining the potential for operations strategy deployment proved much more difficult to compile than the impact data. The development of these types of guidelines is still in its infancy and there are very few agencies that currently have any formalized and documented guidance; however, a greater number of agencies reported that these types of guidelines were currently under development or at least under consideration, so it is hoped that more data on these guidelines will be available in the near future. Guideline information that was identified was compiled along with any supporting documentation, when available.
The compiled data were then used to populate the appropriate spreadsheet cells. For the Impacts Summary worksheet, identified impacts were mapped to the appropriate category (worksheet), strategy (row), and performance measure (column). To further assist the user, strategies with many entries for a specific performance measure were further organized to disaggregate the impacts identified in domestic locations from those observed in international deployments. Additionally, those impacts estimated through the use of modeling or simulation studies were segregated from empirical results observed in “before-and-after” studies.
To provide additional guidance to the user, the default impact values identified in the IDAS analysis tool were also entered into the spreadsheet for appropriate strategies. These IDAS default values from the tool are based on an average of impact values observed in nationwide studies and provide users with a suggested value to use as a starting point in their own investigations. These default impact values from IDAS are provided in the spreadsheet for a similar purpose–to provide an average value to serve as a starting point for practitioners to initiate their investigation of strategy impacts. The same caveats that apply to these default values in IDAS also apply to the spreadsheet including, the user is strongly encouraged to view these national average values in light of the impacts experienced by individual jurisdictions and make adjustments to more closely fit their own regional conditions and environment. All IDAS default values identified in the spreadsheet are specifically denoted as such, as shown in Figure 2, which presents a sample view of the Impacts Summary spreadsheet.
Figure 2. Sample View of Impacts Summary Structure
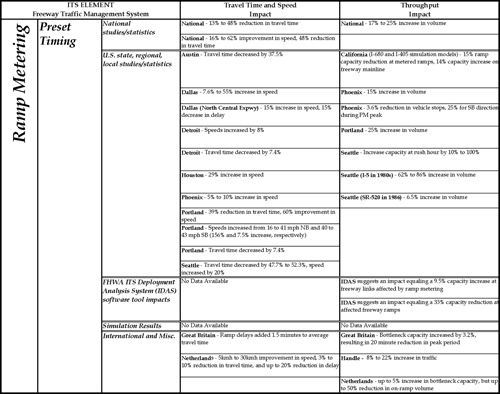 Figure 2 - spreadsheet screenshot - The figure shows a partial view from a Microsoft Excel spreadsheet showing some of the contents of the impact summary spreadsheet developed for this case study. The impact values shown are for performance measures such as travel time, throughput, and mode shift associated with various ramp metering deployments.
For cells where no suitable impact data were identified, an entry of “No Data Available” was made.
Additionally, for all data entered, a reference is provided to the source document where the data were obtained. For ease of use, the reference columns are hidden when the spreadsheet is first opened, but this data may be easily viewed by the user if they are interested in investigating the specifics regarding any particular data entry.
For the Deployment Guidelines spreadsheet, all compiled guidelines and thresholds were mapped to the appropriate worksheet and row for the particular strategy. Given the general lack of data for this subject, the identified guidelines are provided in a single column with any source information provided in an adjacent column, as shown in Figure 3. No attempt was made to further disaggregate these guidelines according to particular conditions or the threshold performance measures used, although the spreadsheet format provides for this possibility in the future if more information becomes available.
Figure 3. Sample View of Deployment Guidelines Structure
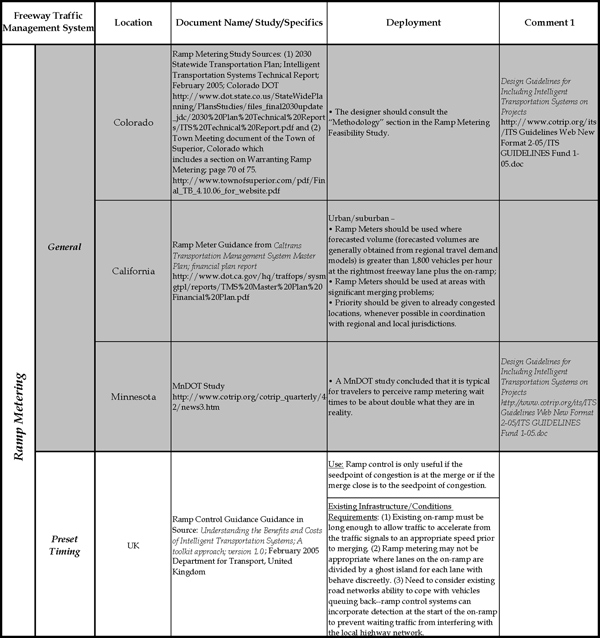 Figure 3 - spreadsheet screenshot - The figure shows a partial view from a Microsoft Excel spreadsheet showing some of the contents of the deployment guidelines spreadsheet developed for this case study. The deployment guidance shown is related to ramp metering, and reference specific documents, deployment guidance, and general comments.
The final step in developing the Impacts Summary and Deployment Guidelines resources was to develop instructions and user guidance for their application. In order to provide a simple resource that could be easily distributed as a single file, the instructions for use were incorporated as a separate worksheet in both resources. This user guidance is also provided in Appendix B of this report.
Table 2 provides a quick-look summary of the data contained in the Impacts Summary spreadsheet. This table provides a cross reference of those strategies and performance measures where data was available at the time of publication of this document.
Table 3 provides a further synthesis of the data contained in the Impacts Summary spreadsheet by highlighting general ranges of impacts noted in the individual data points ( The individual data points that were used in estimating the general ranges presented in Table 3 are presented in the Impacts Summary spreadsheet. These individual data points also identify the region in which the impact was observed and provide a reference for this information. The ranges presented in Table 3 are only intended as a general overview of the more detailed data contained in the spreadsheet tool and in many cases are not inclusive of outliers observed in the collected data). Note that not all the data points for all strategies and impact categories (as identified in Table 2) are presented in this table. Publication logistics only allow a brief summary of the wealth of information in the actual spreadsheets. This data also represents a snapshot in time of the available data on the impacts of these operations strategies. New deployments and evaluation efforts are constantly being completed that provide additional data points for these impacts. The spreadsheet provides the opportunity for practitioners to update the impact information with new data as it is discovered; however, the summary information in this static publication is not anticipated to reflect any future updates to the spreadsheet.
Table 2. Quick-Look Reference to “Impact Summary” Data
Strategy |
Speed & Time |
Throughput |
Mode Change |
TOD Change |
Route Change |
Foregone Trip |
Safety |
Customer Satisfaction |
Emissions |
Energy |
Cost |
Efficiency |
Other |
|---|---|---|---|---|---|---|---|---|---|---|---|---|---|
ATMS Signal Coordination |
no |
no |
no |
no |
no |
no |
no |
no |
no |
no |
no |
no |
no |
Traffic Actuated Isolated |
yes |
yes |
no |
no |
no |
no |
no |
no |
yes |
no |
no |
no |
no |
Preset Timing Corridor |
yes |
yes |
no |
no |
no |
no |
yes |
no |
yes |
yes |
yes |
yes |
yes |
Traffic Actuated Corridor |
yes |
yes |
no |
no |
no |
no |
yes |
yes |
yes |
yes |
no |
no |
yes |
Central Control Corridor |
yes |
yes |
no |
no |
no |
no |
no |
no |
yes |
yes |
yes |
no |
yes |
ATMS Signal Priority |
no |
no |
no |
no |
no |
no |
no |
no |
no |
no |
no |
no |
no |
Transit Vehicle |
yes |
yes |
no |
no |
no |
no |
yes |
no |
yes |
no |
no |
yes |
no |
Emergency Vehicle |
yes |
no |
no |
no |
no |
no |
yes |
no |
no |
no |
no |
yes |
no |
Freeway Management Systems |
no |
no |
no |
no |
no |
no |
no |
no |
no |
no |
no |
no |
no |
Ramp Metering Preset Timing |
yes |
yes |
no |
no |
no |
no |
yes |
no |
no |
yes |
yes |
no |
no |
Ramp Metering – Traffic Actuated |
yes |
yes |
no |
no |
no |
no |
yes |
yes |
yes |
yes |
yes |
no |
no |
Ramp Metering – Central Control |
yes |
yes |
no |
no |
no |
no |
yes |
no |
no |
no |
no |
no |
no |
Advanced Public Transportation Systems |
no |
no |
no |
no |
no |
no |
no |
no |
no |
no |
no |
no |
no |
Fixed Route – Automated Schedule |
yes |
no |
no |
no |
no |
no |
no |
no |
no |
no |
yes |
no |
no |
Fixed Route – AVL |
yes |
no |
no |
no |
no |
no |
no |
no |
no |
no |
yes |
yes |
yes |
Fixed Route – Security Systems |
no |
no |
no |
no |
no |
no |
yes |
yes |
no |
no |
no |
no |
no |
Paratransit – Automated Schedule |
yes |
no |
no |
no |
no |
no |
no |
yes |
no |
no |
no |
no |
no |
Paratransit – AVL |
no |
no |
no |
no |
no |
no |
yes |
no |
no |
no |
yes |
no |
no |
Incident Management Systems |
no |
no |
no |
no |
no |
no |
no |
no |
no |
no |
no |
no |
no |
Detection/Verification |
yes |
yes |
no |
no |
no |
no |
yes |
no |
yes |
no |
yes |
yes |
no |
Response/Management |
yes |
no |
no |
no |
no |
no |
yes |
yes |
yes |
yes |
yes |
yes |
no |
Combination Detection & Response |
yes |
yes |
no |
no |
no |
no |
yes |
yes |
no |
no |
yes |
yes |
no |
Electronic Payment Collection |
no |
no |
no |
no |
no |
no |
no |
no |
no |
no |
no |
no |
no |
Transit Fare Payment |
no |
no |
no |
no |
no |
no |
no |
yes |
no |
no |
yes |
no |
no |
Basic Toll Collection |
yes |
yes |
no |
yes |
no |
no |
no |
yes |
yes |
yes |
yes |
yes |
yes |
Railroad Grade Crossing |
no |
no |
no |
no |
no |
no |
no |
no |
no |
no |
no |
no |
no |
Grade Crossing Monitor |
yes |
no |
no |
no |
no |
no |
yes |
yes |
no |
no |
no |
no |
yes |
Emergency Management Services |
no |
no |
no |
no |
no |
no |
no |
no |
no |
no |
no |
no |
no |
Emergency Vehicle Control |
yes |
no |
no |
no |
no |
no |
yes |
yes |
no |
no |
no |
yes |
no |
Emergency Vehicle AVL |
no |
no |
no |
no |
no |
no |
yes |
yes |
no |
no |
no |
yes |
no |
In-vehicle Mayday |
no |
no |
no |
no |
no |
no |
no |
yes |
no |
no |
no |
no |
yes |
Multimodal Traveler Information |
no |
no |
no |
no |
no |
no |
no |
no |
no |
no |
no |
no |
no |
Highway Advisory Radio |
yes |
no |
no |
no |
yes |
no |
no |
yes |
no |
no |
no |
no |
no |
Highway Dynamic Message Sign |
yes |
yes |
no |
no |
yes |
no |
no |
yes |
no |
no |
no |
no |
no |
Transit Dynamic Message Sign |
yes |
no |
no |
no |
no |
no |
no |
yes |
no |
no |
no |
no |
no |
Telephone–511 |
no |
no |
yes |
yes |
yes |
no |
no |
yes |
no |
no |
yes |
yes |
yes |
Web/Internet |
yes |
yes |
no |
no |
no |
no |
yes |
yes |
yes |
yes |
no |
no |
yes |
Transit/Multimodal Kiosk |
yes |
no |
no |
no |
no |
no |
no |
yes |
no |
no |
no |
no |
yes |
Handheld Personal Device |
yes |
yes |
no |
yes |
yes |
no |
yes |
yes |
yes |
yes |
yes |
no |
yes |
In-Vehicle Guidance |
yes |
yes |
no |
no |
yes |
no |
yes |
yes |
yes |
yes |
yes |
no |
yes |
Commercial Vehicle Operations |
no |
no |
no |
no |
no |
no |
no |
no |
no |
no |
no |
no |
no |
Electronic Screening |
yes |
no |
no |
no |
no |
no |
no |
no |
no |
no |
yes |
no |
no |
Weigh-in-Motion |
no |
no |
no |
no |
no |
no |
no |
no |
no |
no |
yes |
no |
no |
Electronic Clearance |
yes |
no |
no |
no |
no |
no |
no |
yes |
no |
yes |
yes |
no |
no |
Safety Inspection |
no |
no |
no |
no |
no |
no |
yes |
no |
no |
no |
yes |
yes |
no |
Hazmat Incident Response |
no |
no |
no |
no |
no |
no |
no |
no |
no |
no |
yes |
yes |
no |
Congestion Pricing |
no |
no |
no |
no |
no |
no |
no |
no |
no |
no |
no |
no |
no |
HOT Lanes |
yes |
yes |
yes |
yes |
no |
no |
yes |
yes |
yes |
no |
yes |
yes |
yes |
Variable Tolls |
yes |
yes |
yes |
yes |
no |
no |
yes |
yes |
yes |
no |
yes |
no |
yes |
Cordon Pricing |
yes |
no |
yes |
yes |
no |
yes |
yes |
yes |
yes |
yes |
yes |
no |
yes |
Weather Applications |
no |
no |
no |
no |
no |
no |
no |
no |
no |
no |
no |
no |
no |
Ice Removal |
yes |
no |
no |
no |
no |
no |
yes |
no |
no |
no |
yes |
no |
no |
Snow Removal |
no |
no |
no |
no |
no |
no |
no |
no |
no |
no |
yes |
no |
no |
Weather Detection |
yes |
no |
no |
no |
no |
no |
yes |
no |
no |
no |
no |
no |
yes |
Work Zone Management |
no |
no |
no |
no |
no |
no |
no |
no |
no |
no |
no |
no |
no |
Smart Work Zones |
yes |
no |
no |
no |
yes |
no |
yes |
yes |
no |
no |
yes |
no |
yes |
Table 3. High-level Synthesis of Impacts Summary Spreadsheet Data
Strategy |
Sample Synthesis of Impacts (Ranges) |
|---|---|
ATMS Signal Coordination |
Majority of available data focuses on travel time, speed, and delay impacts. |
ATMS Signal Priority |
Majority of available data focuses on transit travel times in relation to transit signal priority systems. |
Freeway Management Systems – Ramp Metering |
Majority of available data focuses on speed, throughput and safety. |
Advanced Public Transportation Systems |
Majority of available data focuses on travel time, on-time performance and agency costs/efficiency. |
Incident Management Systems |
Majority of available data focuses on delay and agency efficiency impacts.
|
Electronic Payment Collection |
Majority of available data focuses on throughput and agency cost/efficiency; however, due to variations in performance metrics, synthesis of general findings is not possible. |
Railroad Grade Crossing |
National synthesis studies suggest a decreases of approximately 40 percent of accidents at crossing locations. |
Emergency Management Services |
Majority of available data focuses on customer satisfaction impacts related to crash notification services. |
Multimodal Traveler Information |
Majority of available data focuses on travel time and customer satisfaction impacts. |
Commercial Vehicle Operations |
Majority of available data focuses on agency cost/efficiency; however, due to variations in performance metrics, synthesis of general findings is not possible. |
This case study resulted in the development of two separate resources: 1) Impacts Summary – summarizing the likely impacts of various operations strategies, and 2) Deployment Guidelines – summarizing deployment guidance that has been developed to date. Each data set was developed in a simple spreadsheet format that may be freely modified by individual practitioners to add new data as it is discovered, or to serve as a repository for their own customized impact ranges or deployment guidelines.
The Impacts Summary contains a high-level identification of the impacts associated with various operations strategies disaggregated by performance measures impacted. The impacts identified in the resource represent observed impacts from before-and-after studies of previous deployments in other U.S. and international locations, results from simulation and modeling studies, and the recommended default impact values from the FHWA’s IDAS tool. The resource is intended to provide a quick guide to the overall range of impacts associated with various strategies; however, references to the source documentation is provided to allow the user to conduct further, more detailed investigation of any of the values.
Recent changes to the U.S. DOT ITS Benefits Database, implemented in parallel with the development of this Impacts Summary, have replicated some of the quick reference capabilities provided by the spreadsheet – providing users the much needed ability to more quickly view summaries of impact findings. The Internet-based format of the ITS Benefits Database provides advantages to the user in that it is continually updated and can provide direct links to the data source documentation. These changes to the ITS Benefits Database do not, however, eliminate the need for a resource like the Impacts Summary. This Impacts Summary provides advantages to potential users, including the following:
The Deployment Guidelines spreadsheet likewise provides a valuable, quick-check resource for investigating deployment guidance and rules-of-thumb in use by other agencies. The usefulness of this resource is currently restricted, however, due to the limited amount of data that is currently available. The open format of this resource does provide the opportunity to update the repository in the future in the event that more information and guidelines become available. Many agencies contacted as part of the research effort indicated that they currently were considering or actively developing these types of guidelines.
The two resources developed as part of this case study effort represent high-level summaries of the currently available information. More importantly, however, the resources provide a basic framework for presenting the information that may be adopted, modified, and updated by individual agencies to serve as customized repositories for this type of information in order to better support their own planning for operations efforts.
This appendix contains the instructions for using the Impacts Summary [DRAFT Impact Summary v1.xls] and Deployment Guidelines [DRAFT Deployment Guidelines v1.xls] resources. These instructions are also provided on the INTRODUCTION sheet of the respective spreadsheets.
This spreadsheet was developed as a case study conducted as part of the FHWA project “Improving the Application of Existing Methods to Advance Transportation Operations.” This Impacts Summary spreadsheet is intended to provide users with a high-level, quick reference of the impacts associated with various operations strategies. Many of the impact values presented in this resource were summarized from studies compiled in national, cross-cutting database repositories such as the U.S. DOT ITS Benefits Database [http://www.itsbenefits.its.dot.gov/], and other libraries maintained by agencies and research institutions, as well as from several operations analysis tools such as the FHWA ITS Deployment Analysis System (IDAS) tool [http://idas.camsys.com/]. This resource is not intended to replace these other resources. Instead, the information in this spreadsheet is intended to provide a high-level summary of available impact measures and help guide users in investigating these other data sources. The spreadsheet format of the resource also allows users to add their own data to create a customized repository.
The Impacts Summary is organized as a series of 17 individual worksheets, each representing a general category of operations strategies, including the following:
Within each strategy category (each worksheet) there may be multiple individual strategies presented. These strategies are identified down the left-hand side of each worksheet and can be viewed by scrolling down through the sheet.
For each individual strategy, impacts are identified and mapped to a number of performance measure categories, including the following:
The performance measures are represented by the columns in the sheet. Within the cells representing a specific strategy (rows) and performance measure category (columns) there may be multiple impact findings noted, based on the number of data points available. In cases where there are many impact data points identified, these are generally arranged as:
In situations where no relevant data were identified for a particular strategy and performance measure, a statement of “No Data Available” was entered in the cell.
Although not shown in the default spreadsheet, references to the source data for each entry are provided. This material is located in the two columns immediately to the right of each entry in a performance measure column. By default, these columns are initially hidden. The user can unhide these columns to view this supplemental data. For example, if the user would like to learn more information regarding an entry in the Travel Time & Speed Impact column (typically column “D”), the user should unhide the two columns immediately to the right of the performance measure column (columns “E and F” in this example). A sample view of the references is shown in the figure below.
Figure 4. Example Screen Showing Unhidden Reference Columns
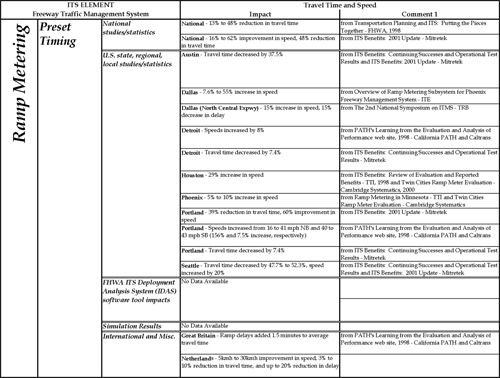 Figure 4 - spreadsheet screenshot - The figure shows a partial view from a Microsoft Excel spreadsheet showing some of the contents of the impact summary spreadsheet developed for this case study. The impact values shown are for the travel time and speed performance measures associated with various ramp metering deployments. Three columns are highlighted, as if they were recently unhidden to show comments fields containing the source documents for the impact values shown.
This spreadsheet was developed as a case study conducted as part of the FHWA project “Improving the Application of Existing Methods to Advance Transportation Operations.” This Deployment Guidelines spreadsheet is intended to provide users with a high-level, quick reference of specific thresholds or rules-of-thumb that have been developed by other agencies to help practitioners identify conditions that warrant deployment of particular operations strategies. The spreadsheet format of the resource also allows users to add their own data to create a customized repository.
To populate this Deployment Guidelines spreadsheet, research was conducted to identify state or local agencies that have developed guidelines or thresholds for identifying locations or conditions that are appropriate for deployment of various operations strategies. This research included contacting a number of state DOTs known to be investigating these types of guidelines. Currently (2008), there is still very limited information regarding guidelines, thresholds, or warrants for determining the potential for operations strategy deployment. The development of these types of guidelines is still in its infancy and there are very few agencies that currently have any formalized and documented guidance; however, a greater number of agencies reported that these types of guidelines were currently under development or at least under consideration. It is hoped that more data for these types of guidelines will be available in the near future.
The Deployment Guidelines spreadsheet is organized as a series of 12 individual worksheets, each representing a general category of operations strategies, including the following:
Within each strategy category (each worksheet) there may be multiple individual strategies presented. These strategies are identified down the left-hand side of each worksheet and can be viewed by scrolling down through the sheet.
For each individual strategy, identified guidelines are presented in the Deployment Guidance column. Within the cells representing a specific strategy (rows) there may be multiple guidelines noted, based on the number of data points available. In most cases, however, there are limited or no guidelines currently available. Empty cells are provided as a placeholder for any future guidelines that may be identified.
References to the original source documentation are provided in the Document Name/Study/Specifics column, and the location of the agency developing the guidelines is presented in the Location column.