Traffic Analysis Toolbox Volume X:
Localized Bottleneck Congestion Analysis
Focusing on What Analysis Tools Are Available, Necessary and
Productive for Localized Congestion Remediation
5.0 Levels of Analysis
The planner must select the most appropriate type of analysis tool. This section introduces the variety of analysis tools, and discusses the circumstances when one might be preferable over another. This section also introduces a set of project characteristics to consider.
5.1 Categories of Analysis Tools
There are numerous types of tools to fit projects of different sizes, scopes, and objectives. Depending on the project, there might be more than one suitable tool, or the project might require more than one tool (from more than one category) simultaneously. These tools can typically be characterized as presented below.
Sketch Planning Tools
These tools produce order-of-magnitude estimates of travel demand, operations, and delay. They are sometimes used to prepare preliminary budget estimates or similar. They can be as simple as look-up tables or basic design criteria found in design or planning tenet manuals. They are limited in scope, analytical robustness, and presentation capabilities.
Empirical Observations
Collecting even the simplest field data or observing particular driver habits can go a long way towards assessing a particular problem. Maybe the observation of when or why drivers slow, yield, merge, or otherwise react to a bottleneck can help to propose a plan of action. Perhaps the observation that some motorists are bypassing a bottleneck via an adjacent collector-distributor road or local network can lead to a conclusion. Keep in mind that the more detailed the data collected or available, the greater the opportunity to employ a more thorough analysis later on.
Equation Tools
Equation tools contain an analytical procedure that is static and closed-form. In such cases, the analyst will enter several inputs into the model, and the tool will produce singular outputs that provide information on the expected operational conditions on that facility; i.e., specific questions "in" will render specific answers "out," if you will. Data outputs from such tools can include the facilities' LOS (delay, speed, density). Such tools are simplistic; the outputs of the tool are typically not fed back into the model as new inputs, but rather, new equations are run. The same inputs will always yield the same outputs; random variations are not accounted for. Examples of equation tools include the Highway Capacity Software (HCS) and SIDRA (software for evaluating and designing roundabouts).
Equation tools are very appropriate for localized study areas like a single intersection or a highway section. Equation tools also are appropriate for a quick-and-dirty preliminary analysis that may lead to or warrant a future, more detailed analysis.
Deterministic Tools
Deterministic tools vary from equation tools in that deterministic tools can go beyond providing information of the traffic conditions present on the facility - they can help analyze operational and signal timing components. Deterministic tools also are closed-form and non-iterative; they do not necessarily use logical, advancing, or repeating investigation that iteratively builds upon a prior result, until a complete computer "run" is delivered. But in a deterministic system, every action or cause produces a predictable reaction or effect, and every reaction, in turn, becomes the cause of subsequent reactions. Given that the HCM has more than 30 chapters covering everything from driveways to highways, there are several qualifying sections that are "deterministic" in their application.
Traffic signal optimization tools also vary in complexity and are deterministic tools. Many of these tools have the ability to optimize signal phasing and timing plans for isolated signal intersections, arterial streets, or street networks. This may include capacity calculations, cycle length, or splits optimization, including left turns, as well as coordination/offset plans. Some deterministic tools also can optimize the ramp metering rates for freeway ramp control. The most advanced traffic optimization tools are capable of modeling actuated and semiactuated traffic signals, with or without signal coordination. Examples of such tools include Synchro and TRANSYT.
Deterministic tools are appropriate for a corridor, a series of intersections, or grid urban network.
Stochastic Tools
Stochastic modeling is the counterpart to deterministic modeling and introduces randomness. There is some indeterminacy in the future evolution of the analysis, as described by probability distributions. The product can generate either totally random outcomes, or, as is typically the benefit of the product, can predict more-probable ones. These tools can evaluate the evolution of traffic congestion problems on transportation systems. By dividing the analysis period into time slices, a simulation model can evaluate the buildup, dissipation, and duration of traffic congestion over time. Simulation models, by evaluating entire systems of facilities, can pinpoint the interference that occurs when congestion builds up at one location before it impacts other locations. Also, traffic simulators can model the variability in driver/vehicle characteristics.
Stochastic tools are most appropriate for analyzing complex systems; advanced operational strategies; mitigation techniques (i.e., adjustments of ramp metering parameters); or larger study areas (typically not more than 100 square miles).
There are three different subcategories of simulation models, as discussed below.
Macroscopic Models
Macroscopic models take place on a section-by-section basis rather than tracking individual vehicles, and therefore operate on the basis of aggregate speed/volume and demand/capacity relationships. Validation of macroscopic simulation models involves replication of observed congestion patterns. Macroscopic models have considerably less demanding computer requirements than other stochastic models. They do not, however, have the ability to analyze transportation improvements in as much detail as other stochastic models; and do not consider trip generation, trip distribution, and mode choice in their evaluation of changes in transportation systems.
Microscopic Models
Microscopic models simulate the movement of individual vehicles, based on theories of car-following and lane-changing. Microscopic models also do an increasingly good job of simulating the geometrics of the facility. Typically, vehicles enter a transportation network using a statistical distribution of arrivals (a stochastic process); and are tracked through the network over small time intervals (e.g., one second or fraction of a second). Upon entry, each vehicle is assigned a destination, a vehicle type, and a driver type. In many microscopic simulation models, the traffic operational characteristics of each vehicle are influenced by vertical grade, horizontal curvature, and superelevation (based on relationships developed in prior research). The primary means of calibrating and validating microscopic simulation models is through the adjustment of driver sensitivity factors. Computer time and storage requirements for microscopic models are large, usually limiting the network size and the number of simulation runs that can be completed.
Mesoscopic Models
Mesoscopic models utilize data that is more general than microscopic models, but represent traffic components in higher detail than macroscopic models. The mesoscopic models' unit of traffic flow could be the individual vehicle or groups of vehicles. These models can handle large network grids of nodes and links, and can provide for diversionary routes and volume adjustments. Mesoscopic tools can assign vehicle types and driver behavior, or base their behavior on the roadway characteristics (Jayakrishnan, R., H. S. Mahmassani, et al., 1994, An Evaluation Tool for Advanced Traffic Information and Management Systems in Urban Networks, Transportation Research C). Their movement, however, is governed by the aggregate characteristics of the link or traffic group or cells (Ben-Akiva, M., 1996, Development of a Deployable Real-Time Dynamic Traffic Assignment System, Task D Interim Report: Analytical Developments for DTA System, ITS Program, Cambridge, Massachusetts, MIT ITS Program). Mesoscopic model travel predictions take place at an aggregated level, and do not consider dynamic speed/volume relationships for individual system components (vehicles in most cases).
5.2 A Word about Microsimulation Tools
For all their prowess in number crunching, simulation tools have some caveats. First and foremost, microsimulation analysis is a specialty field and not a standard staff duty. These tools often require a plethora of data, considerable error checking, and the potential for manipulation by one or more of the basic data inputs. Calibration can be complex and time-consuming. Secondly, using them is not a "magic bullet" to be blindly accepted. The algorithms are often vendor-copyrighted and may not have universal acceptance by the professional community. There is no national consensus on the design of a simulation-tool approach. Simulation models assume "100 percent safe driving" and often assume the most direct route selection regardless of human behavior patterns or reaction. This is not an indictment of simulation tools - merely a caution towards the old adage "data in equals data out" and the fact that special training is required for each differing model that exists.
Microsimulation analysis might be entirely warranted when the complexity of the bottleneck has significant, and not merely incidental, impacts on weaving or upstream and downstream traffic. Other applications might be when the rate of a ramp meter discharge is impacting, or when route changes are impacted.
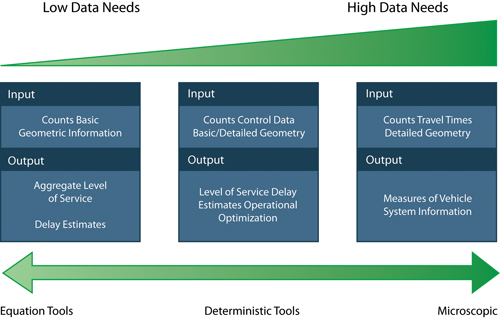
Figure 1. Relative Tool Complexity
5.3 Case Study in Tool Selection: Sacramento SR 65/I-80 Interchange Analysis
Overview
Recurrent, localized bottlenecks occur at the SR 65/I-80 interchange near Sacramento, California because of high traffic volumes and the inefficient geometry of the eastbound to northbound loop connector. Bottlenecks occur in the southbound SR 65 to westbound I-80 in the a.m. and p.m. periods and in the eastbound I-80 to northbound SR 65 in the p.m. The interchange is a Type F-6 freeway-to-freeway interchange. The bottlenecks and their effects are confined by Post Mile (PM) 2.6 and 7.1 on I-80 and PM 4.9 and 6.2 on SR 65.
Existing and forecast peak-period volume data is available for both mainlines and connectors.
The following four alternative solutions are being considered:
- Alternative 1 - Add a high-occupancy vehicle (HOV) flyover connector in both directions along the troublesome quadrant. Add an additional lane in each direction from the intersection for three overcrossings in either direction.
- Alternative 2 - Replace the eastbound I-80 to northbound SR 65 loop connector with a new flyover connector. HOV connectors would not be constructed. Add an additional lane in each direction from the intersection for three overcrossings in either direction.
- Alternative 3 - Add both flyover connectors proposed in Alternatives 1 and 2, as well as the additional lanes in each direction.
- Alternative 4 - The No-Build alternative.
Approach
Let us consider the case using the following seven criteria:
- Area of Influence - The congestion is caused by geometric restrictions at a single interchange, but its effects are felt for as long as 4.5 miles upstream on I-80.
- Facility - The facility under consideration is a single freeway interchange.
- Availability of Data - Existing and forecast peak-period volumes are available.
- Mitigation Strategies - The mitigation strategies under consideration include HOV lanes, geometric improvements, and new facilities.
- Scope - The project overview does not state a project scope, but if capital improvements are under consideration, it can be assumed that this project is scoped for the long term.
- Performance Measures - To analyze this situation, one would want to include interchange-wide vehicle throughput and person-mobility (number of persons served through this interchange) to compare the different design alternatives. The overall vehicle-miles of travel (VMT) and vehicle-hours of travel (VHT) can be calculated to gauge mobility and delay. Finally, speeds from the specific connector movements also may be useful. Due to the constrained study area limits, calculating travel time and delay would not be as meaningful or representative.
- Cost Effectiveness - The project overview does not state restrictions on ease of use, so it can be assumed that this is not a prohibitive factor.
Analysis Results
The bottlenecks are localized and are caused by both driver behavior and design factors. The addition of the new flyover ramps (new structures) prompted the use of simulation, since other tool types may be more suitable to model changes in the current structure (i.e., lane widening, lane addition, grade reduction), instead of new links.
More specifically, microscopic simulation analysis would best fit this project's analytical needs. In this case, the project analyst selected Paramics traffic microsimulation software to model the interchange.
Modeling each alternative in Paramics, the analyst saw that Alternative 3 (both the HOV connector and eastbound to northbound flyover) would serve the most vehicles and people by year 2040. According to the microsimulation analysis, this alternative would serve about 83,000 to 84,000 vehicles during the a.m. and p.m. peak-periods, respectively. This alternative also had the least number of miles traveled relative to the number of vehicles served; between 96,000 to 100,000 vehicle-miles for about 83,000 to 84,000 vehicles per peak-period. The removal of the loop connector would shorten the distances traveled by the eastbound to northbound commuters, thus bringing some fuel consumption and air quality benefits.