Appendix A: Detailed Traffic Analysis for I-270 Corridor
The following graphics and text summarize the rationale for the selection of
September 13, 2007 as the "benchmark" non-congested day for I-270.
Paired Volume – Speed for "Summer-lite" Days
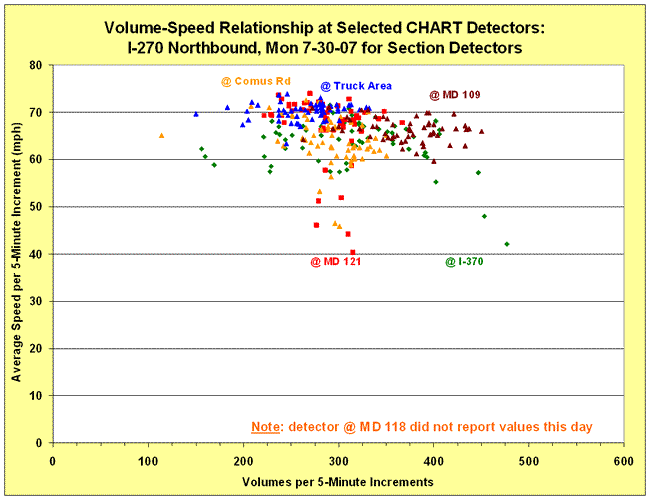
Figure A-1: Volume-Speed Relationship for 7-30-07
- Shows generally tight clusters of points – one cluster for each detector
- 5-minute volumes go from about 100 to 475 veh
- Each cluster has mostly high speeds of 60-75 mph; some speeds drop to 40 to 60 mph range
- The points are consistent with HCQSM findings
- Although this was a lightly congested day, the absence of data for MD 118 makes this day less useful for comparison to congested days
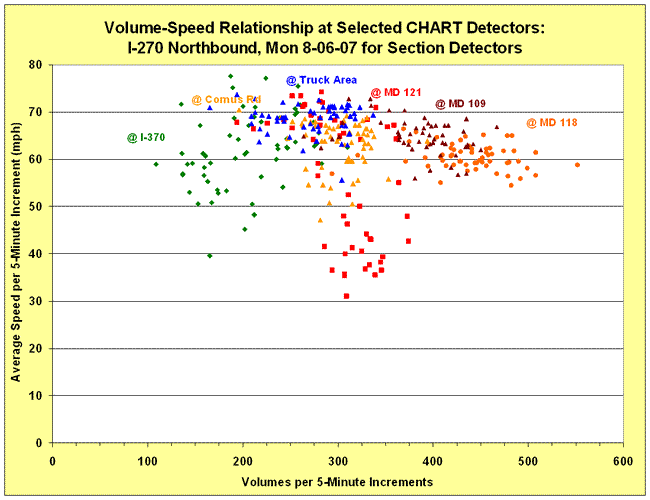
Figure A-2: Volume-Speed Relationship for 8-6-07
- Also shows generally tight but more dispersed clusters of points – one cluster for each detector.
- 5-minute volumes go from about 100 to 550 veh.
- Each cluster has mostly high speeds of 50-75 mph; some speeds drop to 30 to 50 mph range.
- The points are consistent with HCQSM findings.
- Presence of data for MD 118 makes this day more useful, but minor congested conditions at three detectors makes this day less useful.
Volume-Speed for a Summer and a "Special" Day
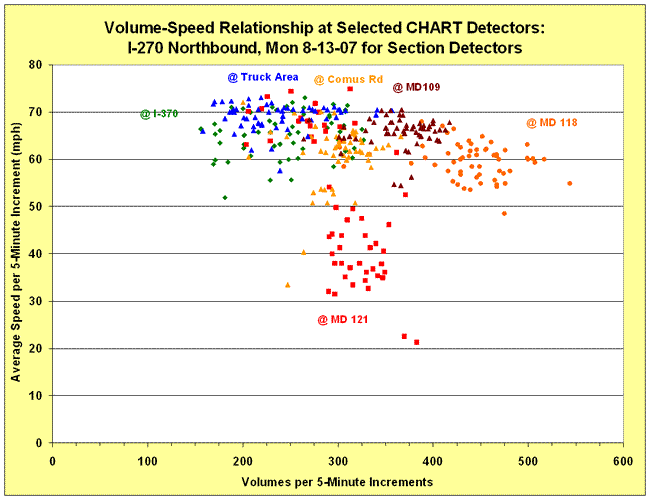
Figure A-3: Volume-Speed Relationship for 8-13-07
- Specific clusters of points are more dispersed
- 5-minute volumes go from about 150 to 550 veh
- Most speeds of 50-75 mph, but speed drops at:
- MD121: many speeds of 20 to 50 mph
- Comus Rd: some speeds of 30 to 50 mph
- The points are consistent with HCQSM findings
- Presence of congested conditions makes this day less useful for comparison purposes
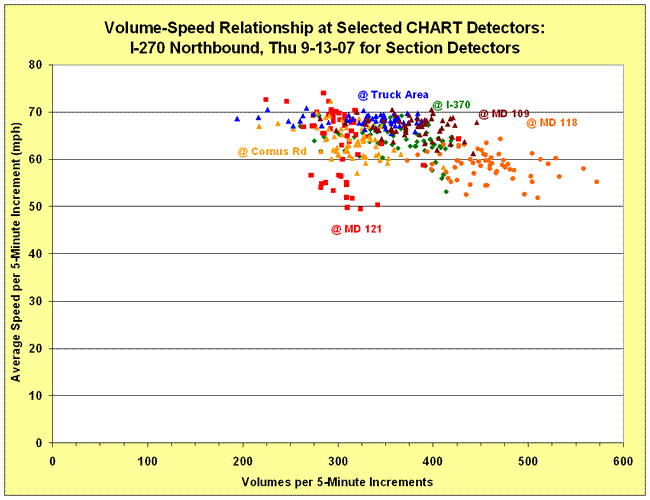
Figure A-4: Volume-Speed Relationship for 9-13-07
- Specific clusters of points are fairly tight.
- 5-minute volumes go from about 200 to 575 veh.
- Each cluster has mostly high speeds of 60-70 mph; some speeds 50 to 60; few over 70; only two 5-minutes intervals just under 50 mph
- The points are consistent with HCQSM findings.
- Although not in "August", combination of high volumes, light congestion, and systemic demand reductions makes this day good for comparison.
Comparison of an Uncongested to a Congested Day
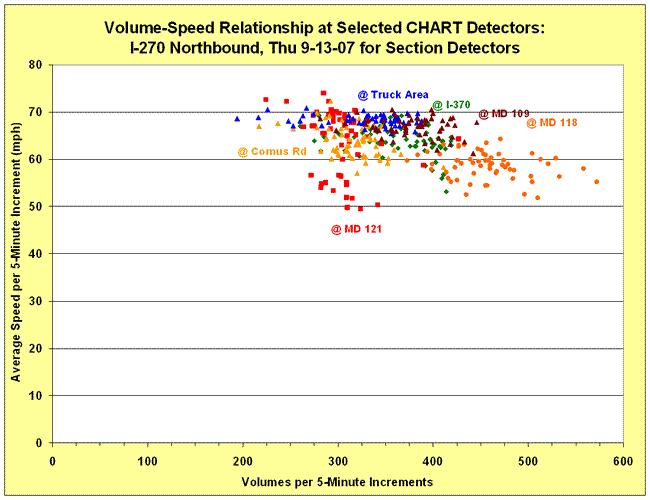
Figure A-5
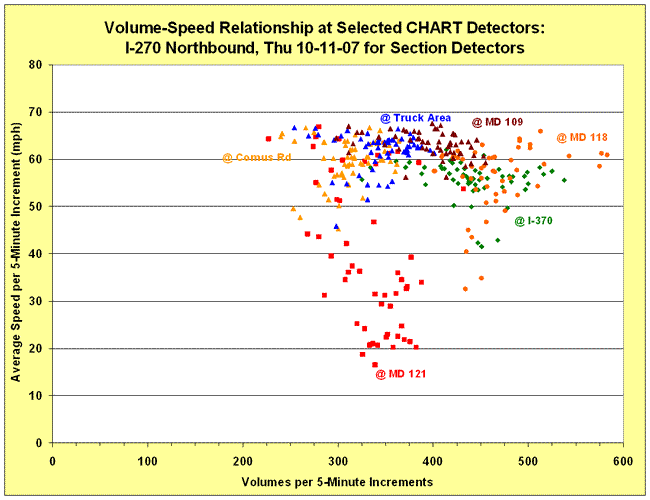
Figure A-6
- The 10-11-07 graph directly above, for a typical congested day shows:
- Volumes vary from 225 to 575 vehicles (MD 118 had peak volume of 583 veh)
- Five of the six detectors have speeds below 50 mph
- At MD 121 many speeds less than 30 mph (slowest average speed of 17 mph)
Again, the points for both graphs are consistent with HCQSM findings.