Transit and Congestion Pricing
Pricing Strategies and Their Effect on Public Transportation
Congestion pricing and public transportation convey mutual benefits—road pricing benefits public transportation by improving public transportation speeds and the reliability of public transportation service, increasing public transportation ridership, lowering costs for public transportation providers, and expanding the source of revenue that may be used for public transportation.
Public transportation benefits road pricing by absorbing commuters who shift their travel from automobile to bus or rail. By replacing traffic with free-flowing conditions on major routes, congestion pricing can improve the speed and productivity of current express bus services, making them more attractive to commuters while reducing operating costs. Reducing congestion can also facilitate rapid deployment of innovative, high-performance bus-rapid-transit (BRT) operations in major corridors, which require only modest investments in new vehicles and passenger facilities. Improving the performance and variety of peak-period public transportation through a combination of congestion pricing and limited capital investment can provide significant benefits to current public transportation users. It can improve public transportation’s effectiveness in reducing peak-period auto travel and can provide the expanded passenger-carrying capacity necessary to accommodate shifts in public transportation commuter use induced by the imposition of congestion pricing.
Recent experience suggests that the effect of congestion pricing on public transportation depends on the type of pricing strategy implemented. At present, variably priced lanes have had limited effect on public transportation usage, whereas the impact of zone-based (cordon or area) pricing has been significant.
 Flow Chart. Congestion pricing: Benefits to transit. The cycle depicts the benefits to transit. Congestion pricing leads to an increased price for peak-period highway use. This initiates the virtuous cycle, which is as follows: higher transit ridership leads to less highway congestion, which leads to higher transit speeds and more reliable transit service, which leads to higher transit ridership and lower costs for transit providers, which leads to more frequent service and lower fares, which loops back to higher transit ridership, and the cycle begins again. Within the diagram are two overlapping circles that depict opportunities for new capacity. One circle represents congestion pricing, the other circle depicts improved transit service. Expanded mobility is represented in the area where the two circles overlap.
Congestion pricing: Benefits to transit.
Variably Priced Lanes
Variably priced lanes include express toll lanes and HOT lanes. On HOT lanes, low-occupancy vehicles are charged a toll, whereas high-occupancy vehicles (HOVs), public transportation buses, and emergency vehicles are allowed to use the lanes free of charge or at reduced rates. HOT lanes create an additional category of eligibility to use HOV lanes. People can meet the minimum vehicle passenger requirement, or they can choose to pay a toll to gain access to the HOV lane. With citizens growing more frustrated with under-used HOV lanes, HOT lanes are increasingly being viewed as a solution that can reduce public opposition to HOV lanes. Express toll lanes are similar to HOT lanes—the difference is that all vehicles are required to pay a toll, that is, HOVs do not get free service.
The current experience with HOT lanes suggests that variably priced lanes do not generate a shift to public transportation per se; however, in many cases, some of the revenues generated by the lanes are dedicated to public transportation.
State Route 91 Express Lanes in Orange County, CA
The four variably priced express lanes in the median of the State Route (SR) 91 freeway opened in December 1995. The objectives of the SR-91 express lanes were to generate revenue and to provide additional highway transportation options. The variable tolls range from $1.25 during off-peak times to as much as $9.80 on Friday afternoons. The toll schedule is adjusted every 3 months based on traffic observed over the prior 3-month period. Speeds are 60–65 mph on the express lanes, whereas congestion on the free lanes has reduced average peak-hour speeds to no more than 15–20 mph. During the peak hour, which occurs on Friday afternoon (5:00–6:00 p.m.) in the eastbound direction, the two “managed” express lanes each carry almost twice as many vehicles per lane than do the free lanes because of the effect of severe congestion on vehicle throughput in the free lanes. Toll revenues have been adequate to pay for construction and operating costs.
Although local public transportation vehicles use the express toll lanes, there is little impact on public transportation operations from this variable-pricing application (Jackson, Zirker, Peirce, & Baltes, 2008). Although a commuter rail line and an express bus line both operate in the SR-91 corridor, total public-transit ridership in the corridor amounts to less than 1 percent of the highway traffic (Sullivan & Burris, 2006).
HOT Lanes on I-15 in San Diego, CA
The San Diego HOV/HOT-lanes deployment, known as FasTrak®, is a reversible HOV facility that operates along an 8-mile corridor within the median of I-15, north of downtown San Diego. Typical of other HOT lanes, the San Diego HOT lanes allow public transportation vehicles and carpools with two or more persons to travel free, and single-occupant vehicles may access the lanes if they pay a variable toll ($0.50–$8.00). When the I-15 FasTrak® HOT-lanes project was opened with electronic tolling in 1998, it became the world’s first fully dynamic variable-pricing operation. The toll varies based on the congestion level, which is analyzed every 6 minutes, with appropriate modifications made to the toll rate if needed.
Although this operation is primarily seen as a traffic-reduction highway initiative, the San Diego HOT lanes have always had a public transportation link in its concept and operations. The HOT lanes currently generate annual toll revenues of approximately $1–$2 million. Approximately half of the toll revenues are used to fund the Inland Breeze bus express service between northern San Diego County and downtown San Diego along the HOT lanes. Ridership on the Inland Breeze is modest, and most of its riders had been using public transportation prior to its advent; thus, the new express bus service had little direct impact on congestion. Still, public transportation improvements financed by toll revenues contributed to a 25-percent increase in bus ridership.
Overall, the I-15 FasTrak® value-pricing program has been so successful that construction is underway to expand the system by 2012 to a 20-mile, two-directional managed-lane project that extends from downtown San Diego to Escondido in the far northern part of the county. A key component of this $1 billion expansion project is the inclusion of direct access ramps to five new BRT stations. The high-frequency BRT service is currently in development and will address the shortcomings of the Inland Breeze express bus service (Jackson, Zirker, Peirce, & Baltes, 2008).
Houston, TX, HOT Lanes “QuickRide” Program on I-10/Katy Freeway
There are approximately 105 miles of HOV lanes that are operating in the Houston metropolitan area. The HOV lanes are owned and managed by the Metropolitan Public Transportation Authority of Harris County (Houston Metro). Public transportation vehicles, carpools with specified occupancy, vanpools, and motorcycles are allowed to use these lanes. The QuickRide program operates on two HOV facilities (I-10 and US 290) on which two-person carpools are required to pay a toll of $2.00 to use the HOV lanes during certain specified peak times when only vehicles with higher occupancy levels may ride free. Although a large number of public transportation vehicles use the HOV lanes, including express buses, there does not appear to be a strong connection between HOV lanes, the QuickRide program, and public transportation. On the basis of a 2004 evaluation of the QuickRide program, there were a number of complaints in regard to existing Houston Metro service along the HOV corridors. The service is not generating substantial and sustainable modal changes that favor public transportation ridership (Jackson, Zirker, Peirce, & Baltes, 2008).
Minneapolis–St. Paul, MN, I-394 MnPASS Value-Pricing Program
In May 2005, the Minnesota Department of Transportation (MnDOT) opened the I-394 HOT-lane corridor. Known as the I-394 MnPASS project, this project has the first HOT lane not physically separated (e.g., by barriers, separate roadway, etc.) from the toll-free, general-purpose lanes. This was made possible through strong enforcement and by incorporating the latest technologies into the HOT-lane operations. Toll rates are dynamically set (ranging from $0.25 to $8.00), depending on the current congestion level and the distance traveled. As is typical with all Minnesota HOV lanes, public transportation, carpools, and motorcycles never pay a toll. Although value-pricing objectives stated that road-use charges seek to provide incentives to shift some trips to off-peak times, less-congested routes, or alternative modes, a November 2006 evaluation found that most public transportation providers reported negligible impacts on operations as a direct result of the MnPASS deployment. The evaluation went on to emphasize that the MnPASS deployment will not result in mode-share changes to the I-394 corridor (Jackson, Zirker, Peirce, & Baltes, 2008).
Denver, CO, I-25 Express Lanes
Since the I-25 express lanes opened in Denver, CO, in June 2006, usage levels are above predicted use. In June 2006, the first month of operation, 21,551 vehicles used the HOT lanes. This increased by 73 percent in March 2007 to 80,665 vehicles that used HOT lanes. Regional transportation district buses operated over 96 percent on time in the first year of operation of the HOT lanes.
Variable Tolls on Roadways
With variable tolls, flat toll rates on existing toll roads are changed to a variable-toll schedule so that the toll is higher during peak-travel hours and lower during off-peak or shoulder hours. This encourages motorists to use the roadway during less-congested periods and allows traffic to flow more freely during peak times. Peak-toll rates may be high enough to guarantee that traffic flow will not break down, thus offering motorists a reliable and congestion-free trip in exchange for the higher peak toll. Variable tolls can also be introduced on existing toll-free facilities to manage traffic flow. Again, tolls vary by time of day and are charged only on congested highway segments to manage traffic flow and to recover the highway’s capacity to carry the number of vehicles for which it was designed.
New York–New Jersey Variable Pricing
In February 2001, the Port Authority of New York and New Jersey changed its tolling system from fixed to variably priced along its numerous Hudson River crossings. An early analysis in June 2001 showed some effect on travel and public transportation patterns at a few key locations. Long-term impacts have not been reported (Jackson, Zirker, Peirce, & Baltes, 2008).
Lee County, FL, Variable Bridge-Toll Pricing
The variable-pricing program on the Cape Coral and Midpoint Bridges in the Fort Meyers, FL, area is a small-scale project. To provide an incentive for motorists to adjust their travel times, half-price tolls are offered during a short period prior to and after peak hours to those vehicles registered with Lee Way prepaid toll accounts. (Standard tolls range from $0.50 to $1.00.) Survey data revealed that, among those eligible for the discount, there was an increase in traffic of as much as 20 percent during the discount period before the morning rush hours, with corresponding drops in the rush hour itself. However, there has been no discernable public transportation interest in this bridge-toll-pricing system (Jackson, Zirker, Peirce, & Baltes 2008).
Zone-Based (Cordon or Area) Pricing
Zone-based pricing involves charging a fee to enter or drive within a congested area, usually a city center. Two of the most comprehensive and successful international examples of zone-based pricing have been in London, U.K., and Stockholm, Sweden. These cities’ experiences demonstrate that properly structured zone-based charging schemes can reduce urban congestion and increase public-transportation ridership. More important, there is a significant relationship between the success of zone-based pricing and the provision of public transportation.
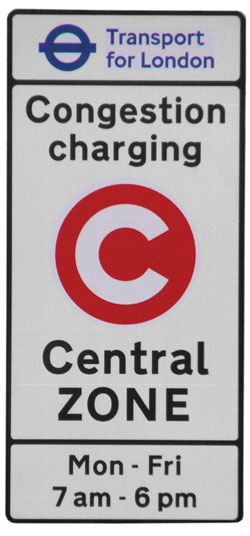
Central London
On February 17, 2003, London implemented an ambitious plan for using pricing to combat congestion in central London. The scheme requires the payment of an £8 ($16) fee to enter a 15-square-mile area of Central and West London, which includes the historic and commercial core of the city. The charge is in effect from 7:00 a.m. to 6:00 p.m., Monday through Friday. There is an array of exemptions, including a 90-percent discount for residents of the zone.
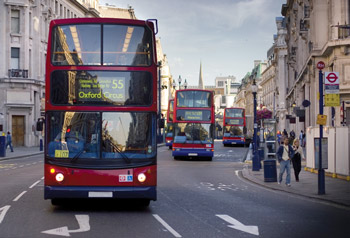
The congestion charge had been in the planning stages since the mid-1990s but was ultimately implemented by London’s first elected mayor as one component of his transportation strategy for the region. Enhanced public transportation services were at the core of this strategy and were deployed well in advance of implementing the congestion charge. Most of the public transportation investment was focused on the bus system, with 300 additional buses put into service months before the congestion charge was initiated.
A detailed, pre-charge review of bus services resulted in improved frequencies on 53 routes and the use of larger vehicles on 10 routes, that is, a change to double-decker or articulated buses. Fifteen routes were restructured or extended, and seven entirely new routes were introduced. All of these changes were implemented in 2002 and early 2003, months before the congestion charge actually took effect. A similar review was conducted in 2007, prior to the westward expansion of the zone. Overall, total scheduled bus mileage within the zone (including on the boundary) increased by 10 percent between January 2002 and January 2003. These service expansions coincided with other ongoing efforts to improve bus services, including improved traveler information, exclusive bus lanes, electronic fare payment, stricter enforcement of bus lanes and parking restrictions, public transportation signal priority, and low-floor and accessible vehicles. Essentially, Transport for London created a 200-mile network of dedicated bus lanes.
Evaluation results indicate that the charging system has been successful in reducing congestion by about 25 percent within the zone and has led to substantial increases in bus ridership. The charge raises £122 million ($240 million) per year, which by law must be reinvested in transportation. Monitoring showed that bus ridership increased even more than expected. In the first year, ridership into the zone during the morning peak was up by 29,000 passengers (38 percent). Half of this was attributed to the congestion charge itself as opposed to other improvements that had been made to the bus system. The following year, inbound morning ridership increased by another 12 percent. Overall, bus ridership across the zone boundary during charging hours is now 37-percent higher (70,000 additional passengers) than before the charge. The additional bus capacity provided decreased impact on load factors: From 2002 to 2003, average occupancy on inbound morning buses only increased from 32 to 36 and has since moderated.
Bus travel times and reliability improved due to the reduction in traffic congestion brought about by the charge. “Excess wait time” at bus stops fell by 24 percent across Greater London during the first full year of charging, with a 30-percent decrease within the zone itself. By contrast, there has been little change in ridership on the London Underground and suburban rail services.
One noteworthy aspect of the London case is that Parliament granted a single agency, Transport for London, final authority for almost all aspects of transportation in Greater London, including the Underground and bus networks, light rail, maintenance on major roads, and the congestion charge itself. This fosters cooperation between the various modes of travel and appears to have been a significant success factor in coordinating the start of the congestion charge with additional public transportation services. An additional institutional factor that has proven important is support from other layers of government. In this case, the required level of public transportation investment exceeded the net revenue produced from the congestion charge, and public transportation funding, which was made available by the central government, offset the shortfall.
Stockholm City Center

Stockholm is the most recent large international city to deploy cordon pricing. It was first deployed on a trial basis from January 2006 to July 2006 and was made permanent in August 2007. During the trial, vehicle owners with Swedish registration were required to pay the congestion tax if their vehicle passed one of the 18 control points on the way in or out of the Stockholm inner-city area on weekdays between 6:30 a.m. and 6:29 p.m. Fees varied depending on the time of day, ranging from $1.50 to $2.75 (U.S. dollar equivalent). The highest charges were during the peak periods of 7:30 a.m. to 8:29 a.m. and 4:00 p.m. to 5:30 p.m. The cost for passing a control point varied, and there was a maximum charge per day, initially set at $8 per day. No congestion charges were made for travel during the evenings or at night, Saturdays, Sundays, or public holidays. Certain vehicle types, such as emergency vehicles, those with disabled drivers, and buses, were exempt from the tax. There were no resident discounts, except for residents of one land-locked island, which is only accessible by passing through the cordoned area.
Actual planning for the cordon pricing on a trial basis began in the autumn of 2003, and beginning on August 22, 2005—5 months in advance of the congestion charge itself—public transportation service was expanded. It was the largest increase in public transportation investment in modern times and accounted for an overall 7-percent increase in public transportation service. As the fixed-track (rail) service was already considered fully utilized during rush hours, it was clear that much of the increase in capacity had to be achieved by investing in extended bus service. During the trial, the public transportation system added 197 new buses and 16 new bus routes to allow for additional alternatives for travel during peak periods. Of the 16 new bus routes, 14 were express buses with enhanced comfort, transporting people from the municipalities surrounding Stockholm into the inner city. Although the express routes became the “face” of the public transportation service enhancements for the trial, almost 70 percent of the increase was to existing services. All existing bus routes added more frequent trips, and train lines added off-peak capacity where possible.
The cordon-pricing trial results were very favorable, with public acceptance climbing throughout the trial, from under 30-percent approval before the trial to over 55 percent toward the end. There was an immediate 22-percent drop in vehicle trips into the zone, a decrease in travel times, and a large shift to public transportation—ridership on inner-city bus routes rose 9 percent. Buses, taxis, and distribution vehicles reported reductions in travel times. Traffic accidents involving injuries fell by 5–10 percent. Exhaust emissions decreased by 14 percent in the inner city and by 2–3 percent in Stockholm County.
Overall public transportation use increased by 6 percent (i.e., 45,000 riders), although about 1.5 percent of the increase was attributed to an increase in fuel costs. During the trial, 97 percent of the increased public transportation traffic took place when the tax was charged, with 75 percent occurring during peak periods (6:30–9:00 a.m. and 3:30–6:30 p.m.). Use of the park-and-ride lots increased by 23 percent. There was substantially less congestion on Stockholm access roads and a significant reduction in traffic to and from the city center.
The clear lesson is that expansion of public transportation alone was insufficient to meaningfully impact congestion; the real change occurred after the congestion charge began. Both additional public transportation service and congestion pricing are necessary to reduce congestion (Jackson, Zirker, Peirce, & Baltes, 2008). Residents of the City of Stockholm voted for continuation of the system in a referendum on September 17, 2006. It was reinstated in 2007.
Singapore
Traffic congestion was significantly reduced when peak-period pricing was introduced in downtown Singapore during the morning rush hours in 1975. The U.S. General Accounting Office noted that in 1975, the Singapore city government instituted a $1 charge for private vehicles to enter the central business district during the morning rush hours. Carpools, buses, motorcycles, and freight vehicles were exempted from the charge. The result was an immediate 73-percent decline in the use of private cars, a 30-percent increase in carpools, and a doubling of buses’ share of work traffic. In spring 1998, the city shifted to a fully automated electronic-charging system, with in-vehicle electronic devices that allow payment by smart card, which is enforced with the use of cameras and license-plate–reading equipment. Variable electronic charges were also introduced on the expressway system, with charges set by time of day to ensure free flow of traffic. The system, the first of its kind in the world, has reduced traffic by 13 percent and increased vehicle speed by 22 percent (U.S. General Accounting Office, 2003).
Area-Wide Pricing
The State of Oregon has tested a pricing scheme that involves per-mile charges, which it will consider using as a replacement for fuel taxes in the future. A congestion-pricing component was tested, with higher charges during congested periods on high-traffic road segments. The Puget Sound Regional Council tested the travel behavior impacts of a similar charging system in the Seattle metropolitan area during 2005–2006. Charges were based on the type of facility used and its level of congestion. The impact of area-wide pricing schemes on transit use has not been examined.
Parking-Pricing Strategies
This type of congestion-pricing strategy does not involve tolls and is discussed in greater detail in a companion primer, Non-Toll Pricing. The discussion that follows focuses on transit impacts of this strategy.
Parking Cash-Out
The vast majority of employers provide their employees with free parking at work; few offer any transit or other commuter benefits. Even when alternative benefits are offered, they are generally capped at a far lower value than the parking subsidy that is provided. For these and other reasons, most employees choose to drive alone to work. An especially promising alternative is parking cash-out. Parking cash-out allows employers to offer their employees the option of receiving taxable cash in lieu of any parking subsidy offered, thus providing employees an incentive to find alternatives to driving alone during peak periods. Among 1,700 employees in eight case study firms in Southern California, parking cash-out led to an 11-percent reduction in commuter trips and a 12-percent reduction in commuter vehicle miles traveled.
Variably Priced Parking Meters
Free on-street parking provides an incentive for motorists to circle around congested urban blocks in search of a space and to bypass commercial garages that do have space but for which the driver must pay to use. Studies show that on average, 30 percent of traffic in dense urban areas can be attributed to such circling. Introducing on-street-parking pricing is a public acceptance challenge, although technologies such as pay-by-cell-phone systems and mid-block parking-ticket-dispensing machines that accept credit cards can help. Donald Shoup, the preeminent U.S. authority on parking policy, has regularly called for pricing at a level that yields 85-percent occupancy, leaving about one in seven parking spaces per block available for the taking. The transit impacts of such schemes have not been examined.
Lessons Learned
The Domestic Experience
All congestion-pricing schemes deployed in the United States to date have had the primary goal of congestion reduction (via modifications to travel times and routes) followed by revenue enhancements. Most areas have barely acknowledged mode shift as a goal and usually recognize it only as a byproduct of pricing initiatives. Congested areas may need to set their congestion-pricing fees relatively high to achieve the desired level of service on the roadways (tolls on Orange County’s SR-91 have progressively risen to as much as $0.95 per mile) to maintain free-flowing traffic. However, in the absence of a reliable and viable public transportation alternative, higher fees have not led to significant modal shifts. Insufficient development of park-and-ride facilities has greatly limited public transportation’s involvement in the domestic-pricing deployments. If mode shift is a project goal, properly sited parking must be developed to accommodate increased public transportation demand.
Thus far, public transportation involvement in domestic value-pricing strategies has been limited. To capture the mutual benefits of congestion pricing and transit, upper management at both highway and public transportation agencies must commit to jointly develop multimodal congestion-pricing programs.
The International Experience
International zone-based pricing experiments could not have been successful without involvement from public transportation. Enhanced public transportation services are an essential component of a zone-based pricing system and must be comprehensively planned and deployed well in advance of zone-based charging. In London, planning for the zone-based charge began in the mid-1990s and included a series of progressively more detailed analyses. Much of the additional public transportation service was rolled out as early as one year before the advent of charging. Congestion pricing had been under discussion in Sweden since the early 1990s, and once the decision was made to begin zone-based charging, a year was spent comprehensively planning service modifications and their related impacts. New and enhanced public transportation service was launched 5 months in advance of the imposition of the congestion tax, which provided time to iron out problems and publicize the service.
Changes to public transportation service must be tailored to local conditions, travel patterns, and public transportation capacity constraints. In both London and Stockholm, this meant significant increases in bus services due to capacity constraints on the underground networks. On the basis of analysis of its travel patterns, Stockholm also emphasized express services from the suburban municipalities to the inner city, with accessible locations, limited-stop service, and frequent operations. Stockholm increased park-and-ride spaces by 18 percent and heavily publicized the new parking options. Selection criteria were applied to ensure that the new parking spaces were in close proximity to public transportation options, and parking was free with a public transportation pass.
In London, careful planning ensured that sufficient buses were provided to keep occupancy rates relatively constant, thus preventing overcrowding. Additional low-floor accessible buses were also ordered. The focus on the bus system also made sense, given that it has proven impossible to provide air conditioning in the Underground. Passenger comfort is an important factor when planning changes to public transportation service in anticipation of zone-based charging.
Although the increase in demand for public transportation as a result of congestion pricing can be relatively modest overall, it can still require major service changes for certain hours, locations, and directions of travel. In the year following the beginning of zone-based charging, overall bus ridership was up by only 2 percent in Greater London, but inbound morning ridership increased by 38 percent. Although overall public transportation ridership increased by 6 percent in Stockholm, the city saw increases in inbound morning ridership of 10 percent on the buses and 13 percent on the Underground (even with its capacity constraints). Another noteworthy lesson is the role that private service providers played: The timely expansion of bus services in London was possible because of contracts with private service providers.
U.S. Department of Transportation’s Urban Partnership Agreements Program
On May 16, 2006, the U.S. Department of Transportation (USDOT) announced the National Strategy to Reduce Congestion on America’s Transportation Network. One major component of the National Strategy is the Urban Partnership Agreement (UPA) Program, through which the USDOT partners with specific congested metropolitan areas to demonstrate the effectiveness of synergistic combinations of proven strategies in reducing traffic congestion. Under the UPA, metropolitan areas commit to pursue aggressive strategies under the umbrella of the “four Ts” (tolling, public transportation, telecommuting, and technology), an integrated approach to reducing traffic congestion (Jackson, Zirker, Peirce, & Baltes, 2008).
At present, USDOT has entered into partnerships with six urban areas under the UPA Program and its successor, Congestion Reduction Demonstration Program:
- Los Angeles, CA—HOT lanes and additional express bus services.
- San Francisco, CA—Variable parking pricing.
- Seattle, WA—Variably priced bridge tolls and increased transit services.
- Minneapolis, MN—HOT lanes and improved express bus services.
- Miami, FL—HOT lanes and improved express bus services.
- Atlanta, GA—HOT lanes and improved express bus services.
Federal Transit
Administration’s Policy on
HOV to HOT Conversions
The Federal Transit Administration (FTA) published its policy on HOV to HOT conversions in February 2007 (Federal Transit Administration, 2007). This policy states that FTA will classify HOT lanes as fixed guideway miles for purposes of the funding formulas administered so long as each of the following conditions is satisfied:
- The HOT lanes were previously HOV lanes and were reported in the National Transit Database as fixed guideway miles for purposes of the funding formulas administered by FTA. Facilities that were not eligible HOV lanes prior to being converted to HOT lanes will remain ineligible for inclusion as fixed guideway miles in FTA’s funding formulas.
- The HOT lanes are continuously monitored and meet performance standards that preserve free-flow traffic conditions as specified in 23 U.S.C. 166(d).
- Program income from the HOT-lane facility, including all toll revenue, is used solely for ‘‘permissible uses.’’ ‘‘Permissible uses’’ means any of the following uses with respect to any HOT-lane facility, whether operated by a public or private entity:
- Debt service,
- A reasonable return on investment of any private financing,
- The costs necessary for the proper operation and maintenance of such facility, and
- If the operating entity annually certifies that the facility is being adequately operated and maintained, any other purpose relating to a project carried out under Title 23 U.S.C. and Title 49 U.S.C. 5301 et seq.