| Skip
to content |
|
FHWA Operations Support - Port Peak Pricing Program EvaluationAppendix A. Port Market Analysis ResultsA.1 Port of SeattleMarket Characteristics
| |||||||||||||||||||||||||||||||||||||||||||||||||||||||||||||||||||||||||||||||||||
Pollutant |
Share |
|---|---|
Oxides of Nitrogen (NOx) |
11% |
Volatile Organic Compounds (VOC) |
2% |
Carbon Monoxide (CO) |
1% |
Sulfur Dioxide (SO2) |
33% |
Fine Particulate Matter |
4% |
Diesel Particulate Matter (DPM) |
28% |
Source: Puget Sound Maritime Air Emissions Inventory, http://www.maritimeairforum.org/emissions.shtml.
Figure A.1 shows the share of heavy-duty truck emissions relative to other sources for the Port of Seattle. As seen from the above table, the contribution of port-related heavy duty truck traffic to pollutant emissions is relatively low compared to other port sources. With the port’s objective to increase the share of on-dock intermodal container traffic in the future, the relative impacts of port trucking activity compared to other sources on air quality are expected to decline in the future.
Figure A.1 Port of Seattle Share of Emissions by Source and Type of Pollutant – 2005
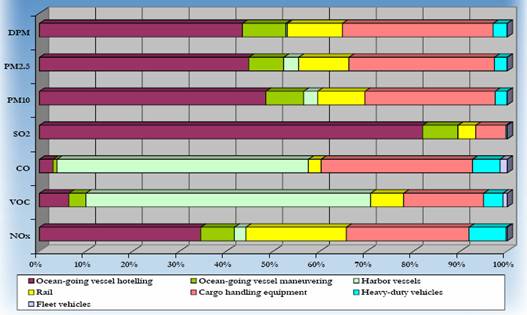
Source: Puget Sound Maritime Air Emissions Inventory, http://www.maritimeairforum.org/emissions.shtml.
Interport competitiveness is expected to be an important factor impacting the success of a peak pricing/extended gate operations program at the Port of Seattle. The Port of Seattle shares a long history of competition with the Port of Tacoma, its neighboring port in the Puget Sound. Due to the proximity between the two ports, they compete with each other not only for “discretionary” cargo, but also for “local” cargo. From the Port of Seattle’s perspective, the effect of this competition on its market position, particularly for Asia-Pacific trade, cannot be ignored, more so now than anytime in the past, as the Port of Tacoma has grown to be a major west-coast port rivaling the Port of Seattle in total container traffic volumes, as well as strong intermodal rail connections to the eastern U.S. The fact that the Port of Tacoma has a lot more available space for capacity expansion compared to the Port of Seattle also places the Port of Tacoma in a strong position to leverage available resources to increase capacity and potentially gain market share relative to the Port of Seattle in the future. In addition, the Port of Seattle also faces competition for “discretionary” cargo from other ports on the west coast, such as the Port of Vancouver (British Columbia) and most notably from the newly developed Port of Prince Rupert in British Columbia, which offers the fastest intermodal route between Asia and the U.S. Midwest.
Port officials indicate that any future efforts towards the implementation of a peak pricing/extended gate operations program at the port would entail working together with the Port of Tacoma, and potentially with other ports such as the Port of Vancouver, so that a joint program can be developed (a program implemented solely at the Port of Seattle is expected to induce some loss in market share, particularly to the Port of Tacoma). These ports have already worked cooperatively in the past to address environmental issues through the development of the Northwest Ports Clean Air Strategy.Unlike the San Pedro Bay ports, POHA does not experience any congestion within the terminals, at terminal gates, as well as on the surrounding highway corridors. This is because the port is continually expanding to add infrastructure capacity to handle the growing container traffic demand. The first phase of the new Bayport container terminal became operational in January 2007. At full build out, the terminal will have seven container berths with the capacity to handle up to 2.3 million TEUs annually. The Barbour’s cut container terminal at the port was built in the 1970s and is the other major container terminal at the port, currently handling bulk of the port’s container traffic. The port has extensive highway connectivity provided by 8 major highways, and other major arterials. In addition to available highway system capacity, the absence of high-density container truck traffic occurring on specific highway corridors (like the I‑710 in Southern California) is another reason why congestion is not an issue at the port.
POHA is located in a nonattainment area for U.S. Environmental Protection Agency’s (EPA) National Ambient Air Quality Standard (NAAQS) for 8-hour ozone pollutant. Thus, air quality is a serious issue in the Houston-Galveston area. However, the air quality issues being faced by POHA are inherently different from the kinds of issues plaguing the San Pedro Bay ports. Most notably, POHA does not have the level of truck traffic generated by the San Pedro Bay ports. Also, there is no truck traffic congestion/idling in and around POHA, which is a major contributor to air pollution around the San Pedro Bay ports. To meet the air quality challenges in the region, POHA plays a very active environmental stewardship role in mitigating the air quality impacts of port activities. It is the first port in the U.S. to have achieved ISO 14001 certification, which recognizes the port for identifying and controlling the environmental impacts of its activities, and continually improving its environmental performance.
POHA handles 98 percent of the Texas container market and around 75 percent of the container market in the Gulf of Mexico. So, the port faces a stronger competition from other Gulf of Mexico ports for the “discretionary” container cargo market (as compared to local container market in Texas). Since a large share of the container market is local, discussions with port officials indicate that the port is not really worried about the competition for discretionary cargo from other ports in the Gulf of Mexico. Port officials indicated that the port is expected to lose some market to the Port of New Orleans if a peak pricing program is implemented in the future. However, owing to the port’s strong customer base and container market shares in the region, it is expected that the port will quickly recover any such loss in market through the attraction of new customers.
PONYNJ does face truck traffic congestion within the marine terminals, attributed primarily to marine terminal operating conditions. The Bi-State Carriers Association, which represents around 80 percent of the drayage carriers serving the port, is critical of the in-gates processes of most MTOs. The association claims that gate related container pick-up and drop-off processes, which vary from terminal to terminal, are generally slow and inefficient, which is leading to in-terminal truck congestion/idling. Truck traffic congestion, particularly on the local connectors just beyond the port’s Marine Terminal Highway System, has also been expressed as a critical problem by the MTOs.
General a.m. and p.m. peak-period traffic congestion on major highway corridors, such as the New Jersey Turnpike, I‑78, and I‑80 is impacting port trucking operations. Also, functionally obsolete segments (particularly bridges) of key local service roads such as Truck Routes 1 and 9, and the New Jersey Department of Transportation (NJ DOT) designated Portway route are slowing and hampering truck operations, since they are major routes used by port-related trucks. The capacity of these highway systems in light of substantial port-related truck traffic growth predicted for the region is a major concern of the freight community in the region.
PONYNJ lies in the New York-New Jersey-Long Island nonattainment area for PM-2.5 and 8-hour ozone. PONYNJ, like the San Pedro Bay ports, is faced with the serious challenge, to find ways of accommodating growing cargo volumes and realizing associated economic benefits, while at the same time minimizing the impacts of port growth and expansion on the environment. Being the largest port on the east-coast, the port is a significant contributor to air pollution in the region. In order to assess the relative impacts of port emissions on air quality, and identify prioritized solutions for impact mitigation, the port has been proactive in conducting detailed air emissions inventories of the primary sources of air emissions, which include ocean-going vessels (OGV), heavy-duty trucks, and cargo handling equipment (CHE). These analyses, the results of which are not available at this time, have indicated that trucks are a major contributor to air pollution from port-related sources. This can be attributed to the fact that a large share of the container traffic moving through the port is destined for local distribution by truck. Also, off-terminal truck trips have been identified to be the primary contributors to truck-related pollution, followed by on-terminal truck idling. Based on these findings, the port has identified several key issues to mitigate air pollution from trucks, and has made notable strides in addressing these issues, which are discussed below:
PONYNJ faces competition from others ports in the U.S. mainly for international containerized imports. The major competitors for the port include:
The port has a strong market share for containerized imports through the North Atlantic range for local markets. Consequently, the port is not particularly concerned about losing any of the local market share to other east-coast ports under a peak pricing/extended gate operations program. The port has expressed interest in analyzing the impacts of a peak-pricing/extended gate operations program on potential market diversion for “discretionary” cargo. However, the impact is expected to be minimal since most of the cargo moves via on-dock intermodal, which will not be affected by the program.
According to port officials, the port does not experience any truck traffic congestion at terminal gates, and within the marine terminals. The Hampton Roads region, where the port is located, faces growing highway congestion, like other metropolitan areas. The major highways used by port trucks include I‑64, I‑664, and Route 460. Majority of the port trucks also use the bridge-tunnels (underwater tunnels) along I‑64 (Hampton Roads Bridge-Tunnel) and I‑664 (Monitor Merrimac Memorial Bridge-Tunnel). Congestion is particularly an issue along the I‑64 Hampton Roads Bridge-Tunnel, which carries around 3 million vehicles each month. Also, growing auto and truck traffic volumes are worsening the traffic conditions on Route 460 and sections of I‑64 in the peninsula (north of Newport News). Even though the region is taking a proactive approach towards implementing transportation solutions (for example, Interstate quality access was recently completed at the Portsmouth Marine Terminal (Route 164), and a major east-west route (U.S. Route 460) is being upgraded to an Interstate highway), there remains some uncertainty in the implementation of some key projects – notably, the Hampton Roads Third Crossing, and I‑64 widening from Newport News to New Kent – primarily due to funding constraints. Unless these projects are implemented, which are key corridors used by port trucks, congestion is expected to remain a critical issue in the region.
The Hampton Roads region is currently in attainment of EPA’s NAAQS for all criteria pollutants. However, the region has been on the border line for attainment/nonattainment for 8-hour ozone. The region was recently redesignated (nonattainment to attainment status) for 8-hour ozone, and has a maintenance plan in place to ensure attainment of the 8-hour ozone NAAQS in the future, through the year 2018. The port’s contribution to air pollution in the region relative to other sources has not been made available as of this time. Since port truck traffic accounts for a significant share of the NOx emissions from ports, and reducing NOx emissions in the Hampton Roads region is critical to maintaining the attainment status for 8-hour ozone, the port is taking a proactive leadership role in reducing port truck emissions. Notable among these efforts is the port’s partnership with the EPA in a new program that encourages truckers through facilitation of grants to purchase new trucks or retrofit older units to cut emissions. As a result of all the port air pollution reduction efforts, it is estimated that between 2005 and 2015, the port will experience a surge in cargo volumes by 49 percent, while port emissions will drop 38 percent. Also, with the development of the Heartland rail corridor, the port is well positioned to increase the share of containers moving on the rail system, which will have a net benefit in terms of port air quality impacts.
The Port of Virginia faces competition in varying degrees from other East Coast Ports. The port has one of the highest percentages of cargo on the East Coast that moves by rail. In that respect, the port faces strong competition for “discretionary” cargo from PONYNJ, and the ports of Savannah and Charleston. The port has a strong market position for local containerized imports. As with PONYNJ, interport competitiveness is not expected to play a role in the success of a peak pricing/extended gate operations program at the port, owing to the following reasons:
Table A.2 Peak-Pricing/Extended Gate Operations Program Performance Evaluation of Selected Ports
Port |
Performance Factors |
Summary of Issues/Characteristics |
Peak-Pricing/Extended Gate Operations Program Performance Evaluation |
|---|---|---|---|
Port of Seattle |
Market Characteristics |
A significant share of high-volume shippers in the market; 24-hour warehousing/DC operations not prevalent currently; Relatively low share of total export container volumes accounted for by low-margin shipments; A major share (85 percent) of total intermodal imports accounted for by off-dock rail |
Yes |
Port of Seattle |
Congestion |
Congestion not an issue for port truck traffic within terminals, at terminal gates, and on major highway corridors around the port |
No |
Port of Seattle |
Air Quality/Environmental Issues |
NAAQS attainment area for all criteria pollutants; Relative impacts of port truck traffic on air pollution observed to be low, owing to lack of truck idling and relatively lower magnitude of truck volumes compared to other large ports (such as Los Angeles/Long Beach) |
No |
Port of Seattle |
Interport Competitiveness |
Serious competition for Asia-Pacific trade with the Port of Tacoma (and with the Port of Vancouver to a certain extent). Implementation of a peak-pricing program at the port expected to result in a notable loss in market share, particularly to Tacoma |
No |
Port of Houston |
Market Characteristics |
Significant presence of high-volume shippers in the import container market; 24-hour warehousing/DC operations prevalent to a certain extent; Relatively low share of total export container volumes accounted for by low-margin shipments; Not a major rail port; Most of the container market is local. Some off-dock rail related truck trips for intermodal container traffic |
Yes |
Port of Houston |
Congestion |
Congestion not an issue for port truck traffic within terminals, at terminal gates, and on major highway corridors around the port; and not expected to be a major issue in the next five years |
No |
Port of Houston |
Air Quality/Environmental Issues |
NAAQS nonattainment area for 8-hour ozone; Relative impacts of port truck traffic on total emissions not available at this time; however, the region experiencing no truck idling/congestion and its exacerbating environmental impacts; the port taking a leadership role in mitigating environmental impacts of its activities (ISO 14001 certified) |
No |
Port of Houston |
Interport Competitiveness |
Primary competition from the Port of New Orleans in the Gulf of Mexico, mostly for “discretionary” cargo; Port having a very strong market position for local cargo; Interport competitiveness not expressed as a primary concern for a peak-pricing program, because of the port’s strategic location, strong customer base and market position for local container traffic (98 percent of Texas container market) |
Yes |
Port of New York/New Jersey |
Market Characteristics |
Low share of the local container market accounted for by high-volume shippers; Low share of low-margin shipments in the export container market; Low share of off-dock rail in the total port container throughput |
No |
Port of New York/New Jersey |
Congestion |
Significant truck traffic congestion within marine terminals, local connectors beyond the port’s Marine Terminal Highway System, and on major highway corridors (New Jersey Turnpike, I‑78 and I‑80) |
Yes |
Port of New York/New Jersey |
Air Quality/Environmental Issues |
Nonattainment area for PM-2.5 and 8-hour ozone; Port trucking activity and truck idling/congestion contributing significantly to air pollution; Extended gate hours identified as a key strategy to reduce truck congestion, and realize environmental benefits |
Yes |
Port of New York/New Jersey |
Interport Competitiveness |
Primary competition from the Port of Virginia in the North Atlantic range for “discretionary” cargo; Port having a very strong market position for local containerized imports; Interport competitiveness not expressed as a major concern for the implementation of a peak pricing program, owing to the port’s strong market position |
Yes |
Port of Virginia |
Market Characteristics |
Notable share (40 percent) of the import container market accounted for by high-volume (big-box) shippers, which is expected to grow in the future; Some of these shippers operate 24-hour warehouses/DCs; Low share of low-margin shipments in the port’s container traffic; Low-share of off-dock rail shipments of the total port container traffic |
Yes |
Port of Virginia |
Congestion |
Congestion not an issue at marine terminal gates, and within the terminals; Truck congestion a critical problem on certain specific corridors such as the Hampton Roads Bridge-Tunnel and the I‑64 corridor in the peninsula |
Yes |
Port of Virginia |
Air Quality/Environmental Issues |
NAAQS attainment area for all criteria pollutants; however, 8-hour ozone air quality remains a critical problem; Port truck congestion on certain key corridors (such as the Hampton Roads Bridge-Tunnel) exacerbating air quality impacts; Port implementing a clean truck/retrofit program in partnership with the EPA; however, extended gate operations could have additional air quality benefits through reduction in highway truck congestion |
Yes |
Port of Virginia |
Interport Competitiveness |
Strong market position for local containerized imports; Competition from PONYNJ, and the ports of Savannah and Charleston for “discretionary” cargo; Interport competitiveness not expressed as a concern for a peak-pricing program |
Yes |
|
United States Department of Transportation - Federal Highway Administration |
||