12. Security Projects
The plans for the iFlorida deployment included five projects related to transportation security. Four of these projects were completed during the period from May 2003 through October 2007:
- A bridge security monitoring system was deployed at two high-priority bridges in Florida.
- A broadband wireless system was deployed on parts of I-4, providing network connectivity to vehicles there, and the LYNX transit system deployed video surveillance equipment that used that broadband wireless system to transmit bus security video to the LYNX operations center and the District 5 Regional Transportation Management Center (D5 RTMC).
- A vulnerability assessment of the D5 RTMC was conducted.
- An emergency evacuation plan for the Daytona International Speedway was developed.
The fifth project, using traffic modeling applications to test the effectiveness of alternate routes in case a bridge was destroyed or disabled, was delayed because the iFlorida data warehouse did not archive sufficient data to support those activities. FDOT plans on completing that activity once a new data warehouse, under development at the time of this writing, is in place. The remainder of this section describes each of the four completed iFlorida security projects and the lessons learned in implementing them.
12.1. Bridge Security Monitoring
FDOT viewed the Bridge Security Monitoring project as a technical proof of concept that would indicate the feasibility and cost of deploying a system to monitor the location around a bridge in order to identify and respond to potential threats to the bridge. This part of the evaluation report describes FDOT's experience in designing, deploying, and using the Bridge Security System.
12.1.1. Assessing the Need for a Bridge Security Monitoring System
FDOT believed that, before deciding to deploy a Bridge Security Monitoring System, a DOT should perform a comprehensive review of the security risks across the whole DOT infrastructure to identify the highest priority risks that could be addressed most cost effectively. One approach for doing this is to use the Homeland Security Comprehensive Assessment Model (HLS-CAM), developed by the National Domestic Preparedness Coalition.1
Although the full HLS-CAM process was not necessary for this project-FDOT was committed to deploying a Bridge Security Monitoring System in order to gather information on the costs and effectiveness of such a system-FDOT elected to follow applicable parts of the HLS-CAM process. Following this process involved the following five steps:
- Threat Assessment. The purpose of the threat assessment was to list the critical infrastructure and key resources that might be threatened and identify the types of threats that might exist for those items. Because the three bridges considered for the iFlorida Bridge Security project were pre-selected, this step was only used to identify the types of threats that might exist for the bridges.
- Criticality Assessment. The purpose of the criticality assessment was to estimate the overall impact of a terrorist attack on a given target. This information would have helped FDOT select the infrastructure that should receive highest priority in conducting the security assessment (attacks that result in more severe impacts receive priority over attacks that result in less severe impacts). However, because the three bridges were pre-selected, this step was not necessary for this project.
- Mission, Demography, Symbolism, History, Accessibility, Recognizability, Population, and Proximity (M/D-SHARPP ) Matrix. The M/D-SHARPP matrix included a rating for each of the eight M/D SHARPP characteristics assigned to each method of attack for each infrastructure element. These ratings were combined to help identify the most likely methods of attack, with the most likely methods receiving focus in the remaining two HLS-CAM steps.
- Community Priority Assessment Plan. The community priority assessment plan considered the results of the Criticality Assessment and the M/D-SHARPP matrix to identify the high-impact targets (from the criticality assessment) that also have high vulnerability (from the M/D-SHARPP Matrix). This helped identify the infrastructure items and modes of attack that should be emphasized in the vulnerability assessments. In this project, three types of threats were identified for inclusion in the bridge vulnerability assessment: (1) an explosion on the bridge surface, (2) an explosion under the part of the bridge over land, and (3) an explosion under the part of the bridge over water.
- Vulnerability Assessment. The vulnerability assessment identified the vulnerabilities of infrastructure elements to the types of attacks identified in the community priority assessment plan. In the iFlorida Bridge Security project, vulnerability assessments were conducted for all three bridges. These vulnerability assessments identified specific threat scenarios related to the three general explosion scenarios, such as where and how a bomb might be placed.
The end result was a series of threat scenarios that identified specific vulnerabilities that could be addressed and mitigated. In general, the HLS-CAM process might identify a number of different mitigation approaches, such as limiting access to the bridge (e.g., by installing fencing), identifying and responding to a threat before damage occurs (e.g., by deploying a monitoring system), hardening the bridge against damage if an attack occurs (e.g., by reinforcing key structural elements), or reducing impacts if a bridge is damaged (e.g., by identifying and signing alternate routes). Each mitigation approach would be considered and the most cost-effective ones selected for deployment.
For the iFlorida Bridge Security Monitoring project, the mitigation strategy was selected ahead of time. In this case, the HLS-CAM process defined the details of potential threat scenarios that were used to help design the Bridge Security Systems by identifying locations at which surveillance was needed in order to detect a threat before damage could occur.
12.1.2. Designing the Bridge Security Monitoring System
The iFlorida Bridge Security Monitoring System was a software system that automatically monitored video images and activated an alarm whenever it detected image characteristics indicating that suspicious activities might be occurring near the bridges. When an alarm was raised, the system would allow operators to review real-time and archived video footage to identify the source of the alarm and monitor response activities, if a response was required.
Based on the threat scenarios identified during the HLS-CAM vulnerability assessment, the first step in the design process was to identify the locations for the video surveillance cameras. The threat scenarios identified the most likely locations where explosives might be placed to damage the bridges. Cameras were positioned to monitor access to those locations. This analysis identified the need for 15 cameras at 1 bridge and 16 at the other, providing surveillance both on the surface of the bridge and underneath it.
The next step was to design the hardware needed to support the video surveillance equipment, the video archiving, the video monitoring software, and the operator interface to the surveillance video and alarms, as well as the network connecting this equipment together. The iFlorida Bridge Monitoring System design called for deployment of digital video recorders and video analysis processors in the field near the bridge and the use of the existing FDOT fiber network to transmit the video and alarm data to the Bridge Security Monitoring workstations.
| The system design should include design of the video monitoring tests that will be applied. |
The last step in the design was to specify the type of monitoring that the video monitoring software would apply to the bridge security video. This software provided a number of different tests that can be applied to a video stream in order to generate alarms. In general, one could specify an area in a video image that should be monitored and specify the type of test that should be applied. For example, one test looks for motion in an area while another is designed to detect static objects. A motion test might be used to identify objects entering an area in which access was limited, while a static test might be used to detect a vehicle that stops on a road. While the design documentation for the Bridge Security Monitoring System included all the details related to the hardware required to operate the system, it did not include details on the video monitoring tests that would be applied. Instead, tests were defined after the system was installed. More information on this part of the design is covered in the next two sections.
12.1.3. Deploying the Bridge Security Monitoring System
The Bridge Security Monitoring System project was first delayed because the contractor withdrew. A new contractor was selected and the project began in October 2004. The design and deployment proceeded on schedule until the summer of 2005, when several hurricanes resulted in extensive flooding that left several planned pole locations underwater. Construction at one bridge was also halted during the Super Bowl. In September 2005, testing was completed and the Bridge Security System was operational. However, network problems prevented FDOT D5 from accessing bridge security monitoring data from one location until July 2006. (The data was assessable from a different FDOT TMC.) By July 2006, network connectivity had been restored and D5 had full access to the Bridge Security Monitoring system.
12.1.4. Using the Bridge Security Monitoring System
The first step in using the Bridge Security Monitoring System was to set up the tests that would be applied to the video surveillance images and trigger alarms. The contractor assisted FDOT with setting up the initial set of tests that would be used. FDOT tested the system, and it successfully detected vehicles entering monitored areas. FDOT did not test the system to determine if the number of false alarms generated was acceptable. Observations by the Evaluation Team indicated that the number of false alarms was high, and RTMC operators responded to the high number of false alarms by turning off the alarm speakers.
| System testing should include verifying that the number of false alarms is not excessive. |
One major source of false alarms appeared to be the highly variable environment in which the system operated. The environment included locations often shadowed by the bridge, and lighting varied dramatically throughout the day. Headlights from vehicles entering the area could put lights and shadows at different locations as the vehicles passed. The automated video analysis often generated alarms that, when reviewed, had no apparent cause. An example is shown in Figure 136 below.
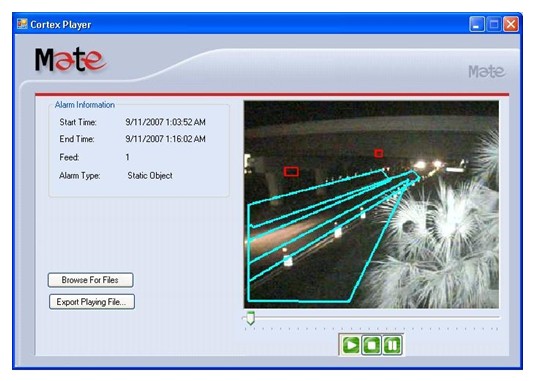
Figure 137. Example of a Bridge Security System False Alarm at Night
In this figure, the large, blue highlighted regions indicate areas in which special tests have been defined and the smaller, red highlighted boxes indicate locations that generated alarms. Another example is shown in Figure 137.
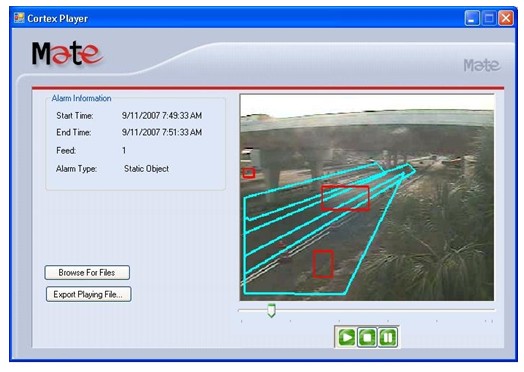
Figure 138. Example of a Bridge Security System False Alarm During the Day
In each of these examples, there was no readily apparent cause for the alarm. A review of the alarms logs during one twenty-four hour period showed that 559 alarms had occurred. (This high number of alarms occurred shortly after FDOT installed a software upgrade and reconfigured the system. Lower-but still high-alarm rates had occurred previously.)
| The system design should include alarm plans for normal operations and other alarms plans that might be used during construction activities. |
False alarms also often occurred during construction activities around the bridge, as the system would detect parked vehicles or construction workers entering and exiting monitored areas. Because the Bridge Monitoring System did not include alternate alarm parameters for use during construction activities, RTMC operators usually muted alarms during these times.
FDOT also experienced challenges in maintaining the cameras needed to support the Bridge Monitoring System. Figure 138 depicts the average percent of Bridge Security Monitoring cameras that were operational each month.
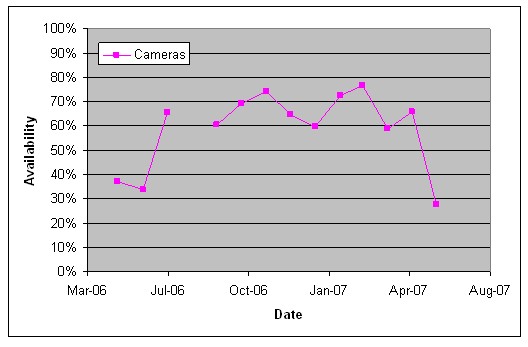
Figure 139. Availability of the Bridge Security Field Equipment
These camera failures decreased the effectiveness of the system by leaving some areas un-monitored. A camera failure could also increase the number of false alarms, if the failure resulted in a distorted image rather than a failed video feed.
12.1.5. Future Plans for the Bridge Security Monitoring System
When the planned operational period for the Bridge Security Monitoring System ended in May 2007, FDOT considered whether it would continue to operate the systems. If the agency continued to operate the Bridge Security Monitoring System, it identified two changes to the hardware configuration they would make to improve the system reliability and performance. First, FDOT planned to replace the digital video recorders located at the bridges with a video server. The agency felt that these devices were a frequent source of failure, and migrating to a video server would increase reliability. It would also allow FDOT to include the video data in its standard backup process. Second, FDOT planned on relocating much of the hardware (i.e., the video server and the video analysis hardware) from the field to the Deland office. This change would simplify maintenance, since the equipment would no longer be exposed to environmental stresses and site visits would not be required to perform repairs. This change would also protect the archived video images in case a bridge failure did occur-locating this equipment in the field meant that damage to the bridge would likely damage the equipment that archived the surveillance video.
12.1.6. Summary and Conclusions
FDOT demonstrated that a video monitoring system could be used to identify potential threats to a bridge. However, the cost of protecting the two bridges-more than $860,000 for design, deployment, and 2 years of operation-was high. Since the likelihood of attack at these specific bridges was relatively low, a complete HLS-CAM review would likely have identified more cost-effective ways to increase transportation security.
In addition, the effectiveness of the system was compromised by the high number of false alarms that occurred. In a security operations center with operators devoting full-time attention to video surveillance, such false alarms could be easily dismissed by operators and might be a minor nuisance. At the D5 RTMC, however, operators were primarily concerned with traffic operations and could not review and dismiss frequent bridge security alarms. In this type of environment, the acceptable number of false alarms is low. Given the uncontrolled environment around most bridges, it was not clear whether existing video analysis systems could provide a low enough level of false alarms to make the system useful without having full-time operators available to discount false alarms.
The Evaluation Team was also concerned with whether the system would provide an alert in sufficient time for steps to be taken to mitigate the effects of an attempt to damage the bridge. The explosion scenarios the system was designed to detect involved a rapid series of events, leaving little time to detect and respond to the threat. To reduce impacts of an attack, a warning must occur sufficiently in advance of an incident to allow responders to arrive at the scene, clear the area, and/or neutralize the threat. The Evaluation Team suspected that this would not be the case for the iFlorida Bridge Security Monitoring System.
In the process of deploying and using the Bridge Security Monitoring System, FDOT did identify several lessons learned that might benefit others wishing to deploy similar systems:
- The system design should include design of the video monitoring tests that will be applied. Many different types of tests were available for FDOT to use to detect threats and sound alarms. While the software made these tests easy to define, it was difficult to define them in such a way to reduce the number of false alarms. Special expertise not available at the DOT may need to be hired to perform the specialized calibration, testing, and validation.
- System testing should verify that the number of false alarms is not excessive. The high number of false alarms in the iFlorida Bridge Security Monitoring System meant that alarms were often ignored. Testing the number of false alarms, and adjusting the system until an acceptable number was generated, might have made the RTMC operators more responsive to alarms that did occur.
- The system design should include alarm plans for normal operations and other alarms plans that might be used during special circumstances, such as construction activities. RTMC operators noted that a number of common events, such as construction activities or a disabled vehicle on the bridge, would sometimes generate a large number of false alarms. The system did not include a convenient way to adjust the operating parameters when such situations occurred.
- The video processing and archiving equipment should be located away from the asset being protected, preferably in a climate-controlled environment. FDOT noted that, with the video archiving hardware deployed in the field, a catastrophe at the bridge would likely destroy the archived video. Archiving the video at a location separate from the monitored asset would protect the archived video from damage, so that it could be used to support post-catastrophe analyses. FDOT also believed that the equipment deployed in the field would have operated more reliably if deployed at the climate controlled environment of the Deland office.
12.2. LYNX Bus Security
FDOT viewed the LYNX Bus Security project as a technical proof of concept that would indicate the feasibility and cost of using a broadband wireless network to support transmission of surveillance video on mobile assets, such as a bus. This part of the evaluation report describes FDOT's experience in designing, deploying, and using the LYNX Bus Security system.
12.2.1. The LYNX Bus Security System
LYNX-the business name for the Central Florida Regional Transportation Authority-operates a public transportation system in Orlando. One part of the iFlorida Model Deployment established network connectivity between the FDOT ITS network and the LYNX Command Center. This provided LYNX with network connectivity to roadside locations in many areas in which it operated buses. The LYNX Bus Security project took advantage of this connectivity by deploying a wireless network along a 14-mile stretch of I-4 between Orlando and the Disney World attractions. This wireless network bridged the gap between LYNX buses and this roadside network. Buses that used this portion of I-4 were then equipped with security cameras and wireless equipment for transmitting video from these cameras to FDOT and LYNX.
12.2.2. Deploying and Using the LYNX Bus Security System
The deployment of this system occurred with few surprises and was completed in the fall of 2005. RTMC operators reported receiving high-quality video images from buses while on the instrumented portion of I-4. However, they found it difficult to consistently verify that the system was operating correctly. Buses were on the instrumented portion of I-4 at regular but infrequent intervals. RTMC operators periodically checked the system to see if video was present as a method for gauging whether the system was working. Without knowledge of when the buses were present, the lack of video could be caused by either the system working incorrectly or the fact that no buses were present on the instrumented portion of I-4.
As time went on, it became apparent that the system was not working reliably, and FDOT reported in May 2006 that the system had been out-of-service for several months. A planned demonstration in July 2006 was cancelled because of network errors, though it was not clear whether the errors were in the FDOT fiber or in the wireless network. Because the system did not include any diagnostic routines for monitoring system performance, the contractor used a series of network pings to identify where the loss of connectivity occurred. Even then, there was disagreement between FDOT and the contractor over whether the root cause was problems with the FDOT fiber or within the wireless network.
From that time forward, FDOT reported that the system failed to operate reliably. Without specific diagnostic tools or test procedures, no quantitative measures of the system reliability were available to the Evaluation Team. RTMC operators indicated that they had witnessed the system in operation and that it delivered high-quality video. Despite several attempts to do so, the Evaluation Team did not witness the system delivering LYNX Bus Security video.
12.2.3. Summary and Conclusions
At the time the LYNX Bus Security System was deployed, few extensive broadband wireless networks had been deployed and it was not clear that a wireless network could successfully transmit video from a mobile vehicle. The system successfully demonstrated that such a network could be created and that it could be used to transmit real-time video from mobile vehicles. FDOT also reported that the video transmission worked well, when the system was operational.
However, the system was rarely operational. Because the system did not include any diagnostic tools for monitoring system performance, quantitative data on the reliability of the system was not available. Several planned demonstrations of the system were cancelled when problems occurred, and FDOT often reported that the system was out of service. Also, the cost of the system was relatively high-about $640,000 for the initial deployment and for maintaining the system from its deployment date through May 2007. The result was a high-cost approach for providing network connectivity to a small number of buses.
Also, the rapid advance of technology has meant that this project, which was a cutting-edge application in 2003 when it was first considered, is no longer cutting-edge. A number of cities are now considering deploying broadband wireless networks on a much more extensive scale than that deployed in Orlando. Other approaches, such as cell modems, are being used to provide network connectivity to buses, and some of these approaches also provide sufficient bandwidth to support security video.
12.3. D5 RTMC Vulnerability Assessments
As part of the iFlorida Model Deployment, FDOT conducted a vulnerability assessment of the D5 RTMC. This section of the report describes the process used and lessons learned in conducting this assessment.
12.3.1. The Vulnerability Assessment Approach
The vulnerability assessment was performed to determine the potential weaknesses at the FDOT D5 RTMC and to suggest measures that would either eliminate the vulnerabilities or lessen the impact if vulnerabilities that cannot be eliminated are in fact exploited. An effort was made to identify vulnerabilities that might be common to TMCs so that results from the D5 RTMC VA could be used to reduce vulnerabilities at other TMCs.
The vulnerability assessment approach was centered on estimating the three risk factors listed in the following risk estimation equation:
[Risk] = [Threat] * [Consequence] * [Vulnerability]
The following four-step process was used to conduct the vulnerability assessment.
- Step 1 – Threat Characterization. The threat characterization determined the Threat value of the above equation. This step also provided an inventory of generalized threats/scenarios most likely to affect a TMC, such as use of explosives or a cyber-attack. The Threat value was obtained by determining the target attractiveness and the threat condition of the nation. The Threat value is a static value, meaning that a countermeasure will not reduce the value. Seven types of threat scenarios were considered: car bomb; large vehicle bomb; chemical, biological, or radiological attack; package bomb; armed attack; collateral damage; and cyber attack.
- Step 2 – Consequence Assessment. Based on the threat scenarios that were developed in step 1, potential consequences were estimated based on current conditions. These potential consequences were used to estimate the Consequence factor in the above formula. Five types of potential consequences were considered: fatalities and casualties, mission downtime or degradation, economic impact, downstream effects, and emergency management.
- Step 3 – Vulnerability Analysis. For each threat scenario, a set of predetermined vulnerability factors were used to generate the Vulnerability value of the equation.
- Step 4 – Countermeasure Analysis. This step involved the development of countermeasure packages and an assessment of the impact on the risk if a package were deployed. Each countermeasure package was considered and the Consequence and Vulnerability factors re-estimated, assuming that the countermeasure package was implemented.
The end result of the vulnerability assessment process was a list of vulnerabilities identified, a list of countermeasures that could be used to reduce those vulnerabilities, estimated costs of these countermeasures, and estimates of the impact on risk if each countermeasure were implemented. This allowed FDOT to identify for implementation those countermeasures that could decrease risk most cost effectively.
12.3.2. The Vulnerability Assessment
The main vulnerabilities observed during the vulnerability assessment were related to the inability to maintain a clear space around the building. Parking was adjacent to the building, including spaces adjacent to the external walls of the RTMC area of the building. Private property was close to the building on one side and separated from the facility by only a chain link fence. These factors are difficult to correct for an existing facility, and it was not feasible to correct them at the D5 RTMC.
| The design for a TMC should include standoff distances that help maintain a clear space around the building. |
Other observed vulnerabilities related to the failure for some staff to follow existing security procedures. For example, people sometimes entered the TMC by tailgating authorized personnel and people without an appropriate badge displayed were seldom challenged. The vulnerability assessment suggested that staff be trained in the security procedures for the facility and that FDOT take steps to emphasize the importance of following these procedures.
Three common problems were also discovered during the cyber-security review. A number of servers were identified that did not have the most recent security patches installed. Several servers were identified as running unnecessary services. (Since each service running on a server provides a potential entry point for cyber-attack, the fewer services running the better.) Some software systems were installed using the default password, and the password had not been updated. (Since default passwords are well known, they should be changed to prevent unauthorized users from accessing a system.) A second cyber-security review indicated that FDOT had corrected most of the vulnerabilities discovered during the initial cyber-security review.
12.3.3. Summary and Conclusions
The RTMC vulnerability assessment improved the security at the RTMC in several ways. The most obvious was that it identified several vulnerabilities that FDOT addressed. Several of these were believed likely to apply to many other TMCs:
- TMCs should be designed with sufficient standoff distances, making it more difficult for a potential attacker to approach the building.
- The importance of security and following security procedures should be emphasized to all TMC staff.
- Processes should be in place to ensure that security patches are applied to all servers and appropriate passwords are used.
At the D5 RTMC, the act of performing the vulnerability assessment increased awareness of security issues among FDOT and FHP staff. For example, the Evaluation Team noted that FDOT staff was more careful to ask to see IDs before visitors were allowed to enter the building and were more careful to ensure that background checks were performed.
A secondary benefit of the FDOT vulnerability assessment was that it helped satisfy FHP security requirements. In Florida, FHP was required to conduct vulnerability assessments at each FHP dispatch center. Because the FHP dispatch center is located at the RTMC, and the RTMC vulnerability assessment followed accepted guidelines for performing vulnerability assessments, FDOT expected that the its RTMC vulnerability assessment would satisfy the FHP vulnerability assessment requirements.
12.4. Daytona International Speedway Emergency Evacuation Plan
Another activity funded as part of the iFlorida Model Deployment was the development of an emergency evacuation plan for the Daytona International Speedway. This section of the report summarizes the results of that activity.
12.4.1. Background Information
The Daytona International Speedway committed to work with FDOT D5 and the transportation agencies of Volusia County to coordinate transportation activities necessary to support an emergency evacuation of the Speedway, both in terms of getting spectators out of the Speedway and public safety and law enforcement personnel in.
Each year, about 500,000 visitors come to the Daytona Beach area during Speedweek, 2 weeks of racing in February that culminates in the Daytona 500. In addition, the Pepsi 400, hosted on July 4th weekend, attracts over 200,000 visitors. Many of the visitors during these events stay in the Speedway's infield in motor homes, trailers, and tents. With so many people attending Speedway events, concerns existed about whether the Speedway could be efficiently evacuated if an event occurred. These concerns were increased because, in 2004, the Speedway was in the process of a significant remodeling of the Speedway infield area. These changes necessitated an updated evacuation plan for the Speedway.
The ITS infrastructure near the Speedway that supported traffic leaving the Speedway during an evacuation was also changing. Prior to the 2003, there was already close coordination between the Speedway and nearby transportation agencies-particularly, FDOT D5, Volusia County, the City of Daytona Beach, and the FHP-to manage traffic entering and exiting the Speedway. Volusia County and the City of Daytona Beach would modify signal timings to accommodate higher traffic flows towards the Speedway before a race and away from it afterwards. FDOT staff would stay at the Daytona Beach TMC to coordinate between the City of Daytona Beach, local law enforcement, FHP, and Road Rangers, and D5 would use its traffic management resources (e.g., 511, DMS) to help monitor and improve traffic flow.
During the period when the iFlorida infrastructure was being deployed, a significant expansion in ITS infrastructure near the Speedway was taking place. Traffic monitoring devices and DMSs were being installed on both I-4 and I-95 near the Speedway, and trailblazer signs were being deployed at a number of key intersections on arterials that might carry traffic during a Speedway evacuation or when an incident occurred on I-4 or I-95 near the Speedway. Figure 139 shows the locations of the dynamic message and trailblazer signs in the area around the Speedway. The development of the new Speedway evacuation plan provided an opportunity for the nearby transportation agencies to update their plans on how to use available resources to best manage Speedway traffic.
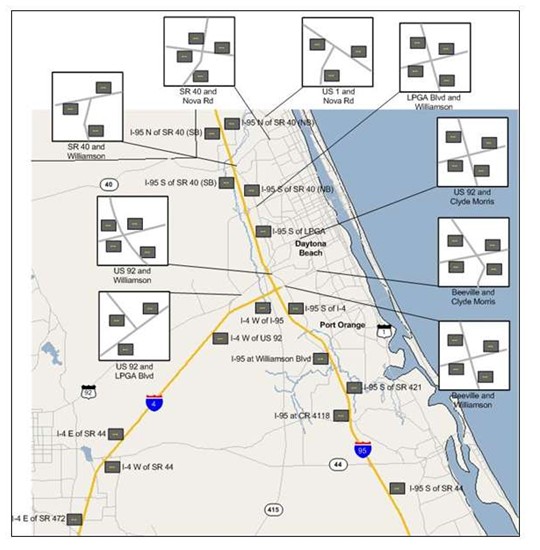
Figure 140. Dynamic Message Signs Near the Daytona International Speedway
12.4.2. The Evacuation Plan
The project began with a kick-off meeting on June 15, 2004, involving representatives from the Speedway corporation, FDOT, NASCAR, city and county police and fire, Daytona Beach Airport Authority, Embry-Riddle Aeronautical University, Florida State Troopers, and city and county Emergency Management agencies. The contractor developing the evacuation plan began by reviewing the planned changes and observing activities during the Pepsi 400. Based on this information, the contractor developed an emergency evacuation plan that focused primarily on evacuating spectators off the property and onto the roads. This plan included the following components:
- A concept of operations that described the organizations involved in an evacuation and their responsibilities as well as the relationship of the Speedway evacuation plan to other emergency plans and facilities.
- Pre-planned pedestrian evacuation routes for all sections of the facility, with assignment of responsibility to uniformed public safety personnel and vested event staff as necessary to direct evacuees to safety.
- Recommended public information and emergency instructions regarding the evacuation process.
A review of the plan identified the following key elements within it:
- Establish a joint command center. In order to evacuate attendees, a number of jurisdictions and organizations would need to be involved. The Speedway would need to direct attendees to their vehicles and manage traffic exiting parking facilities. The City of Daytona Beach and Volusia County would need to modify signal timings and police the evacuating traffic. FDOT and FHP would need to manage traffic on I-4 and I-95. Coordination of these activities would be simplified from a joint command center.
- Identify a route for ingress and egress of emergency response personnel. The Speedway evacuation plan designated a route linking the Speedway with the nearby Halifax Medical Center. This emergency ingress/egress route could be used for entry by emergency response personnel and for evacuation of injured to the medical center. It did not cross any pre-planned evacuation route to avoid conflicts between pedestrian evacuees and emergency service vehicles.
- Identify an off-site staging area for emergency response personnel. The plan identified a strategic off-site location to which supplemental response personnel would initially respond, and located this area on the emergency ingress/egress route.
- Establish pedestrian evacuation routes and procedures for managing pedestrian traffic on these routes. The plan established pedestrian evacuation routes, so that attendees could make it to their vehicles. Attendees would be expected to walk to their vehicles in a direction away from or around the evacuated area. Once in their vehicles, evacuees would be directed to drive out of the area, away from or around the evacuated area.
- Establish evacuation routes and procedures for managing vehicular traffic on local and state routes evacuating the Speedway area. Once vehicles departed from the available parking areas, traffic management services would be provided by the City, County and State, using currently established procedures and facilities.
- Review and update the evacuation plans annually. To accommodate changes that might occur either at the Speedway or in the local transportation network, the evacuation plans should be reviewed on an annual basis. It was recommended that a table top exercise be conducted biannually to help determine if modifications or enhancements are needed.
Although no Speedway evacuations occurred during the evaluation period, one event did occur that emulated some of the traffic disruption that might take place during a Speedway evacuation. On February 18, 2007, following a race at the Speedway, a motorist on I-4 was shot and killed and I 4 was closed for several hours during the investigation. The shooting occurred about one half mile east of the SR 44 exit on I-4, preventing all traffic from using I-4 to exit the Speedway. FDOT responded by changing DMS and trailblazer messages to establish detours on nearby arterials. The extensive signing helped drivers find and follow these alternate routes. FDOT also used its 511 system to provide information to travelers. The Speedway reported to FDOT that it had received numerous comments from Speedway attendees regarding the usefulness of the roadside signs in helping them find their way during this event.
12.4.3. Summary and Conclusions
The evacuation plan identified a number of features that should be established to facilitate evacuation of traffic from a venue site. The following list contains five of the key features:
- Identify a route for ingress and egress of emergency response personnel.
- Identify an off-site staging area for emergency response personnel.
- Establish pedestrian evacuation routes and procedures for managing pedestrian traffic on these routes.
- Establish evacuation routes and procedures for managing vehicular traffic on local and state routes evacuating the Speedway area.
- Review and update the evacuation plans annually.
An event that occurred on February 18, 2007, following a Speedway race resulted in significant congestion that tested the ability of FDOT to respond to the types of conditions that might exist during a Speedway evacuation. During this event, the availability of trailblazer signs on key routes leading from the Speedway allowed FDOT to establish alternate routes that helped Speedway attendees find their way despite the closure of I-4, the primary route taken by most westbound traffic after a Speedway event.
1 Information about the HLS-CAM is available at http://www.ndpci.us/.