10. Traveler Information Operations
A key part of the iFlorida Model Deployment was a significant increase in the amount of traveler information that was available both in Central Florida and statewide. In Central Florida, the previous 511 system, which provided traveler information only for I-4, was expanded to include all other limited access roads in Central Florida and several key arterials in the Orlando area. A traveler information Web site was developed, and the number of DMSs displaying traveler information was increased. Statewide, a new 511 system was established and a traveler information Web site was developed. Outside organizations also used traffic information gathered by FDOT to augment their traveler information-local television and radio broadcasts included more detailed traffic information and Internet content providers included Orlando traffic information on their maps.
This section of the report focuses on the Central Florida and Statewide 511 system and traveler information Web sites. It also briefly discusses uses of FDOT traffic information to support traveler information services provided by other organizations. Information about the use of DMSs for traveler information is discussed in Section 6 of this report.
10.1. iFlorida Traffic Monitoring and Traveler Information Services
The foundation of the iFlorida traveler information operations was the traffic data collection that provided the data used as traveler information. Before iFlorida, this data collection consisted primarily of loop detectors and cameras on I-4 in the Orlando area. FDOT used this data to provide 511 service for I-4. A Web site also provided access to the loop detector data, though the availability of this Web site was not well publicized and demand for the Web site was low.
As part of the iFlorida Model Deployment, FDOT deployed an extensive network of traffic monitoring devices in the Orlando area. This included an extension of the loop detector network on I-4 to I-95 east of Orlando, transponder-based travel time monitoring on the Florida Turnpike, the western end of SR 528, the northern and southern ends of SR 417 and seven high priority arterials, LPR-based travel time monitoring on US 192 and SR 520, micro-loop detectors on SR 528 from SR 520, and CCTVs at 12 key arterial intersections. FDOT also deployed a series of loop detectors and cameras on I-95 along the coast east of Orlando. OOCEA deployed a transponder-based travel time monitoring system on the four toll roads (SR 408, SR 417, SR 429, and SR 528) it managed in the Orlando area. Taken together, these deployments resulted in a comprehensive metropolitan traffic monitoring system. Figure 81 highlights the roads in the Orlando area for which traffic monitoring was in place after the iFlorida deployment was completed. (See section 1 for a more detailed summary of the iFlorida infrastructure and section 3 for information on the transponder-based travel time monitoring.)
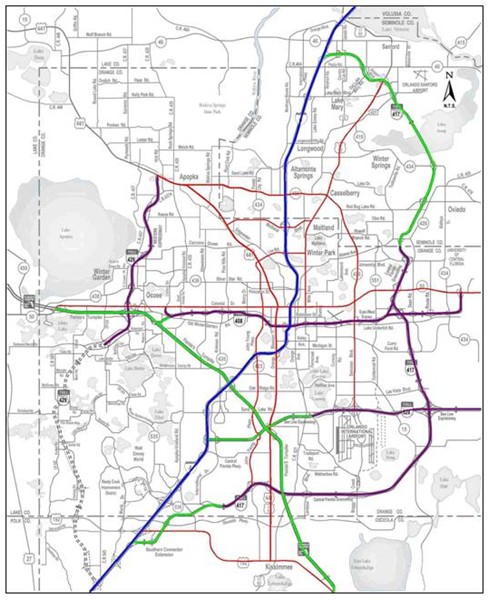
Figure 82. Orlando Metropolitan Area Traffic Monitoring
FDOT complemented these traffic monitoring capabilities with information about incidents obtained through an interface to the FHP CAD system (see section 5) and weather through an interface to a weather data provider (see section 11).
FDOT took advantage of this new information by expanding its Central Florida 511 system to cover all of the roads for which traffic data was available and creating a new Central Florida traveler information Web site. FDOT also posted travel time, congestion, and incident information on DMSs available along I-4 and I-95. In addition, outside organizations used traffic information gathered by FDOT to augment their traveler information-local television and radio broadcasts included more detailed traffic information and Internet content providers (e.g., Google™, MapQuest®, Traffic.com) included Orlando traffic information on their maps.
For statewide traffic information, FDOT relied primarily on incident information received through the FHP CAD interface. However, the agency did deploy a network of 25 traffic monitoring stations at locations scattered across the state. (See section 8 for information about statewide traffic monitoring.) FDOT used this information to support a statewide 511 system and a statewide traveler information Web site.
10.2. Central Florida Freeway Users
In February 2005, FDOT conducted a survey of 400 Central Florida drivers who used Central Florida freeways at least three times per week.1 This survey provided information about how the public used Central Florida freeways and the traveler information resources available to them. This section of the report summarizes results of that survey.
About three-fourths of the drivers surveyed typically used the freeway during either the morning or evening rush hour. As indicated in Figure 83, most of this freeway usage was work-related during the day, but not work-related at night.
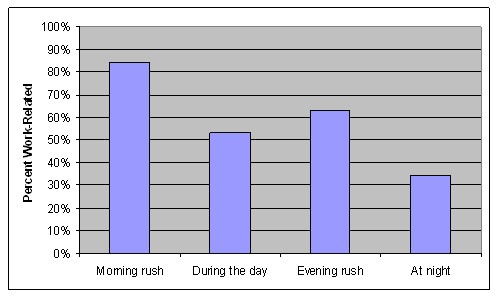
Figure 83. Percent of Freeway Users Whose Travel is Work Related
Almost all of these drivers (about 90 percent) used some source of traffic information, with most relying on radio and television-about 50 percent and 40 percent, respectively.2 (See Figure 84 for more details.) Only 3 percent indicated that they used 511 for traffic information, with another 2 percent indicating that they used a phone-based subscription service.
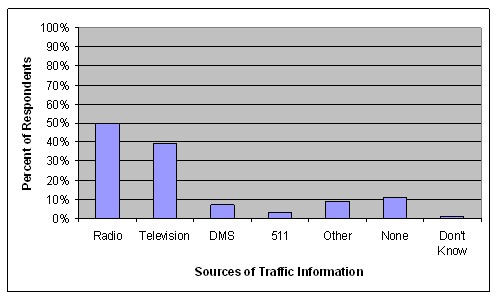
Figure 84. Sources of Traffic Information
While 50 percent of respondents indicated that they used the radio for traffic information, an even higher percentage (69 percent) indicated that they listen to radio traffic reports often (47 percent) or occasionally (22 percent). Almost all of those who had heard radio traffic reports (87 percent) found them either somewhat or very useful.
Of the drivers surveyed, most (82 percent) have a phone available while driving, though only 25 percent of these would be likely to use their phone to obtain traffic information. About one-fourth of the drivers surveyed were aware of the 511 service. Of those aware of the service, only 36 percent indicated that they had used the service (see Figure 85). Of those that used the service, about one-fourth classified themselves as frequent users. So, about 10 percent of all drivers surveyed reported having used 511, and about 3 percent classified themselves as frequent 511 users.3
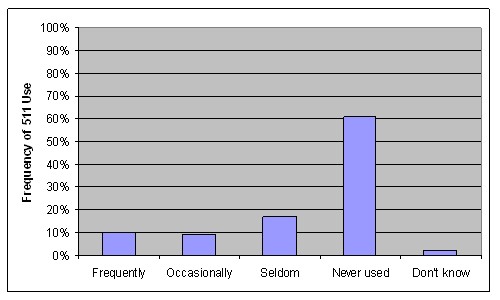
Figure 85. Frequency of 511 Usage for Those Aware of the 511 Service
Because the number of those surveyed who indicated that they had used the 511 service was small (only 40), no quantitative results on their usage preferences were produced. Some qualitative statements on usage patterns were noted:
- Most of the 511 users surveyed indicated that they called the service while on the road.
- Most of the 511 users surveyed indicated that they found the service useful and based travel plans on it.
- Few of the 511 users surveyed indicated that they use 511 to obtain more information about DMS postings.
Though only 18 percent of respondents indicated that they used Web sites for traffic information, an additional 30 percent indicated that they would use such a system if they knew that one was available.
When asked what additional traveler information they would like FDOT to provide to them, a large majority (68 percent) indicated they would like more information about alternate routes (see Figure 86). The preference for more information about alternate routes greatly outweighed the preference for the other options presented to the respondents.
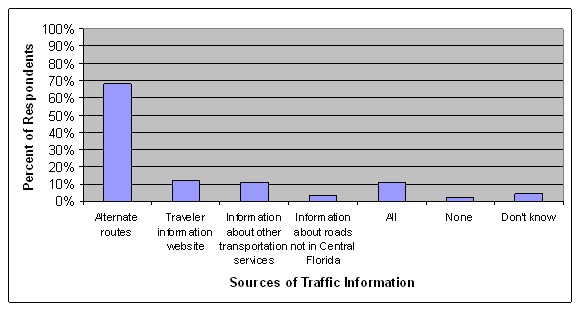
Figure 86. Most Preferred New Traveler Information Resources
10.3. The Central Florida 511 System
The Central Florida 511 system used speech recognition technology to interpret user commands and provide requested traveler information on 13 roads in the Orlando area. In general, the Central Florida 511 system provided travel times for pre-defined segments of road, though the travel time messages were replaced with other messages when incidents occurred. The system supported various types of summary messages that provided callers with alternate formats for traffic information and other features that could be used in special circumstances, such as a hurricane. FDOT monitored caller feedback on the system and continued to refine the 511 system based on the feedback it received.
Section 10.3.1 describes the features of the 511 system in more detail, and section 10.4 describes results related to the usage of this system.
10.3.1. The Characteristics of the Central Florida 511 System
The description of the Central Florida 511 system can be divided into three parts:
- The 511 road segments, which describes the roads covered by the 511 system,
- The 511 architecture, which describes how other parts of the iFlorida deployment supported 511 operations, and
- The 511 call tree, which describes the menu structure used in the 511 system.
Each of these is addressed below.
10.3.1.1. The Central Florida 511 Road Segments
| Limited the number of 511 segments for each road simplified the menu structure for choosing a segment. |
The Central Florida 511 system included all roads for which FDOT had traffic monitoring equipment deployed. The roads were divided up into sub-segments that were deemed an appropriate size for use in a 511 system. Dividing up the road into sub-segments was an important step for achieving a useful 511 system. FDOT noted that this division would result in a menu structure for the 511 system that was difficult to navigate; however, using a small number of long segments would result in traveler information with too little detail to be useful.
FDOT eventually selected a compromise approach between these two extremes. It used relatively long segments in the 511 menu structure-with some segments being more than 20 miles in length-but increased the level of detail by dividing most of these 511 segments into two sub-segments for the purpose of presenting the 511 information. Figure 86 depicts these 511 segments and sub-segments. Each box represents a 511 sub-segment, and the number in each box identifying the associated segment and sub-segment number.
| Dividing 511 segments into sub-segments for reporting travel times allowed more detailed travel time information to be presented. |
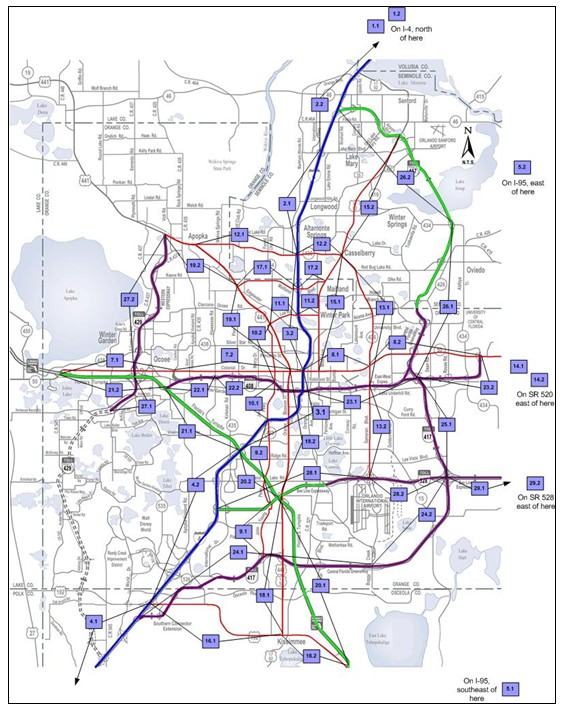
Figure 87. Central Florida 511 System Road Segments
For example, I-4 was divided into four 511 segments, with each segment divided into two sub-segments:
- Segment 4, I-4 from US 27 to the Turnpike, consisted of sub-segment 4.1 (I-4 from US 27 to US 192) and sub-segment 4.2 (I-4 from US 192 to the Turnpike).
- Segment 3, I-4 from the Turnpike to SR 436, consisted of sub-segment 3.1 (I-4 from the Turnpike to SR 50) and sub-segment 3.2 (I-4 from SR 50 to SR 436).
- Segment 2, I-4 from SR 436 to the St. John's River Bridge, consisted of sub-segment 2.1 (I-4 from SR 436 to Lake Mary Blvd.) and sub-segment 2.2 (I-4 from Lake Mary Blvd. to the St. John's River Bridge).
- Segment 1, I-4 from the St. John's River Bridge to I-95, consisted of sub-segment 1.1 (I-4 from the St. John's River Bridge to SR 44) and sub-segment 1.2 (I-4 from SR 44 to I-95).
When a segment was selected from the 511 menu, the 511 system provided traffic information separately for each sub-segment and direction of travel. For example, a caller that selected the I-4 from US 27 to the Turnpike segment might receive a message such as the following:
Travel times on I-4 eastbound. From US 27 to US 192, 15 minutes. From US 192 to the Turnpike, 15 minutes. On I-4 westbound, from the Turnpike to US 192, 10 minutes. From US 192 to US 27, 15 minutes.
10.3.1.2. The Central Florida 511 Architecture
Support for the Central Florida 511 system was divided into two parts: (1) generating and maintaining 511 messages, which was performed by the CRS, and (2) managing 511 calls and disseminating 511 messages. A schematic of this architecture is contained in Figure 88.
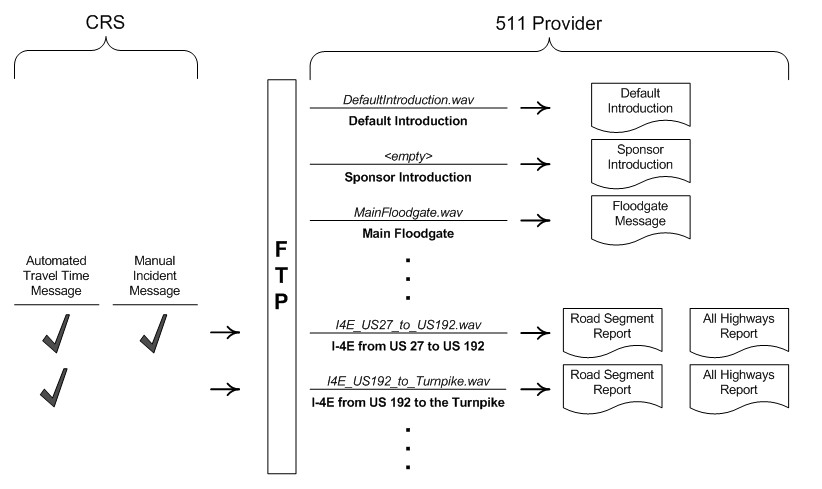
Figure 88. The Central Florida 511 Architecture
The functionality on the right-hand side of this figure was provided by the iFlorida 511 provider. A menu structure, known as a call tree, was defined, and a 511 user accessed 511 services by navigating through the call tree. (See the next section for more information on the Central Florida 511 call tree.) At certain points in the call tree, the 511 provider played messages to the 511 user, with each message being stored within the system in a Waveform audio format (WAV) file. FDOT could change the messages in the 511 system by replacing these WAV files. For example, changing the file I4E_US192_to_Turnpike.wav changed the message that was played when a 511 user requested the road segment report for I-4 from US 192 to the Turnpike.
The WAV files were changed by using a secure File Transfer Protocol (FTP) to transmit new WAV files to the 511 provider. Transferring a new WAV file I4E_US192_to_Turnpike.wav to the 511 provider would overwrite the previous file with the same name so that future requests to hear the road segment report for I-4 from US 192 to the Turnpike would play the new WAV file.
| Pre-recorded travel time messages for all road segments reduced message splicing and increased audio quality. |
The CRS software (represented by the left-hand side in the figure above) was responsible for managing and updating these WAV files. This software allowed RTMC operators to record 511 messages manually and associate those messages with specific road segments. When a manual message was recorded, it was sent to the 511 system as a WAV file and played when requested by the user. When no manual message was available for a road segment, the CRS software computed the travel time for that segment and submitted a pre-recorded travel time message to the 511 provider that was specific for that travel time. (FDOT considered pre-recording names for each road segment and numbers for possible travel times and splicing these pre-recorded phrases together to create a 511 travel time phrase. The agency chose to pre-record all combinations of road segments and travel times in order to avoid any loss in audio quality that might result from splicing together road segment names and travel times.)
| The use of FTP to update 511 messages allowed for continued 511 service even when the TMC management software failed. |
Although FDOT used the above approach for providing 511 service during part of the iFlorida operation period, problems with the CRS sometimes forced the agency to use more manual methods. Because the CRS miscalculated travel times for some road segments, FDOT disabled the feature to automatically produce travel times for these segments. In those cases, FDOT prepared WAV files and transmitted them manually via FTP to the 511 service provider for use in the 511 system. The same approach was used during CRS failures, including the final failure in May 2007, when FDOT stopped using the CRS. The availability of this alternate means of maintaining their 511 messages allowed the 511 system to operate reliably even when the CRS did not.
10.3.1.3. The Central Florida 511 Call Tree
The operation of the Central Florida 511 system was defined using a call tree, which is essentially a flow chart depicting the possible interactions with 511 users and the response taken by the system for each possible user selection. Figure 89 depicts a summary of the initial call tree proposed for the Central Florida 511 system in May 2005. (This figure depicts only the general structure of the 511 menu system. The actual call tree included many more details, such as features for verifying verbal requests from a user and resolving ambiguities when the system was uncertain how to interpret something said by the user.)
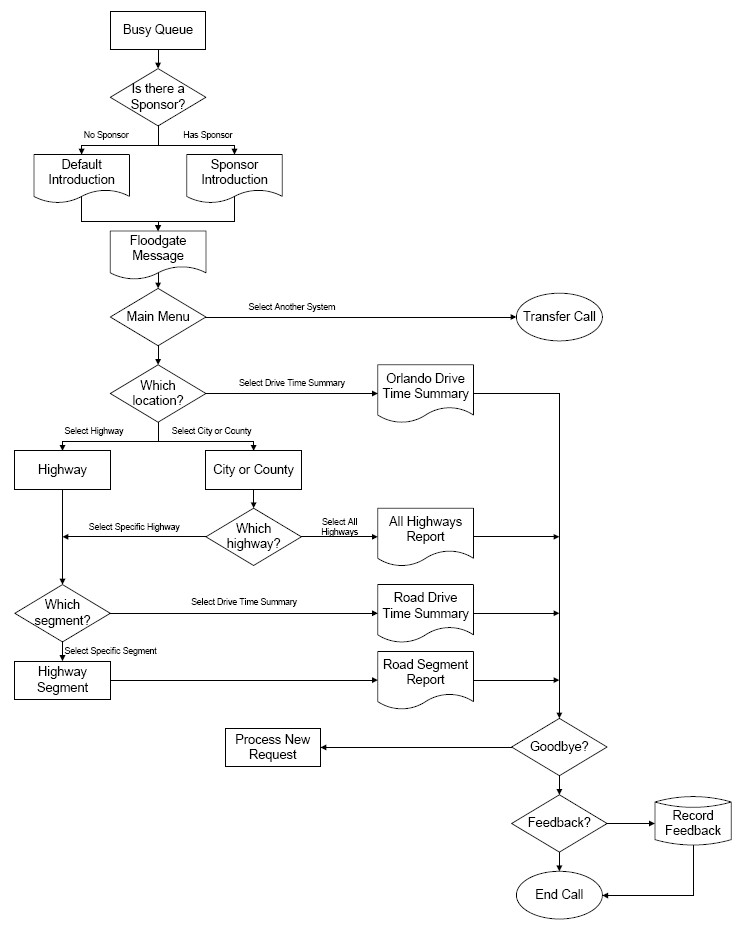
Figure 89. Central Florida 511 Call Flow Summary, May 2005
The following list describes some of the key features of this call tree:
Busy Queue. The Central Florida 511 system was designed to handle up to 255 simultaneous callers. Additional callers heard a message indicating that the system was busy and they should wait for the next available line. Users could also transfer from the Busy Queue to a different 511 system.
Introduction. The system played either a standard introduction or, if available, a sponsored introduction. The sponsored introduction feature gave FDOT the capability of crediting private sector sponsors that helped support the 511 system. This feature was not used during the iFlorida Model Deployment.
Main Menu. The main menu allowed the user to transfer to another system or to request traffic information. The other systems included other 511 systems in the area, as well as phone information systems for other nearby transportation organizations, such as LYNX, Port Canaveral, the Orlando International Airport, and the Orlando Sanford International Airport.
Orlando Drive Time Summary. This feature provided a brief summary of traffic conditions in Orlando. During the morning rush hour, it focused on inbound traffic coming into Orlando. At other times of day, it focused on outbound traffic.
Selecting a Highway. This menu option allowed a 511 user to select a highway for which they wanted to receive traffic information. FDOT supplied the 511 provider with a list of highways to use in the system, including a number of pseudonyms used for each highway and pronunciation guides for difficult-to-pronounce names.
Selecting a City or County. This menu option allowed a 511 user to select a city or county by name. FDOT provided the 511 provider with a list of county and city names. (All counties in the Orlando area were included, and all cities with a population above 6,000 residents.) When a city or county was selected, the user could either request information for all roads or select a single highway in that city or county.
Road Drive Time Summary. This feature provided a brief summary of traffic conditions on a particular road.
Road Segment Report. This feature provided traffic condition information for a segment of road. In general, this was the current travel time for that segment of road, though a custom message might be used if an incident or congestion occurred.
All Highways Report. This feature provided the road segment reports for all segments on the selected highway.
User Feedback. The user could leave feedback for FDOT's review.
| Monitoring feedback helped adapt the call tree to better meet user expectations. |
Other general features of the system were that it ended a call (after giving the user an opportunity to leave feedback) if the system did not understand four successive user requests, ended a call (after informing the user) if a call exceeded 10 minutes in length, and restarted a call where it left off if a user called back within 2 minutes of being disconnected.
As soon as the Central Florida 511 system went live in November 2005, FDOT began monitoring the user feedback daily. This allowed FDOT to identify ways to improve the system. For example, users began complaining about the complexity of the menu structure soon after the system went live. (The previous 511 system provided traveler information only for I-4, so a much simpler menu system was used.) In early 2006, FDOT simplified the call tree to make it easier for callers to access traffic information quickly. Over the following two years, FDOT made a number of additional improvements to the Central Florida 511 system:
| Monitoring user requests that could not be interpreted by the system allowed new phrases and pronunciations that should interpreted by the 511 system to be identified. |
- The content of several key menus (e.g., the main menu, the menu for selecting a city, county, or highway) was shortened significantly.
- The number of synonyms used to identify locations in the 511 system was increased. FDOT regularly monitored the 511 system to identify user statements that were not understood by the 511 system. When common synonyms were identified, FDOT would add them to the list of key words understood by the 511 system. In some cases, the 511 system was updated to better interpret local pronunciations of some words.
- The capability was added to state a flood gate message before providing traffic information. This message could be used when a significant incident existed that affected many roads in the Orlando area.
- The 511 system was updated to provide more sophisticated transfers to other systems, including better management of calls that could not be immediately transferred because the line to the receiving system was busy.
- The methods for processing a request to hear information about all highways in a city or county were modified to present different menu structures, depending on the number of highways in the selected city or county.
- The menu structure that clarified which of two highways a user mentioned when two interpretations were similar was removed from the system. Instead, the system suggested the highest rated option and asked the user to confirm it. If the user did not confirm the presented option, the system tried again, remembering that the presented highway was not the one of interest to the user.
- The menu structure for presenting traffic information when multiple segments were selected was changed to present, by default, drive time summaries. The user could also elect to hear the detailed segment-by-segment reports.
In August 2007, FDOT modified the menu structure so that a user could more easily request either travel times or drive time summaries. The "which location" decision point shown in Figure 88 was changed so that a user could specify either "summary" for a drive time summary or "travel time" for more detailed travel times.
| Travel time summaries were used in the 511 system to provide travel times for alternate routes between pre-defined locations. |
Beginning in early 2008, FDOT introduced a new feature to the Central Florida 511 system, called Travel Time Summaries, which provided travel time information along two or more alternate routes between locations in the Orlando area. First, FDOT identified six key locations that were common origins and destinations for trips and for which more than one route existed between the locations (see Figure 90). A user specified an origin and destination location, and the 511 system presented travel times for all of the alternate routes between the specified locations. For example, a user selecting Southside as the origin and Downtown as a destination was presented with travel times on two alternate routes between these locations, one via I-4 and the other via SR 417 to SR 408. The intention was to provide 511 users with information specifically tailored to help with trip planning by indicating which of the alternate routes available would provide the fastest travel time.
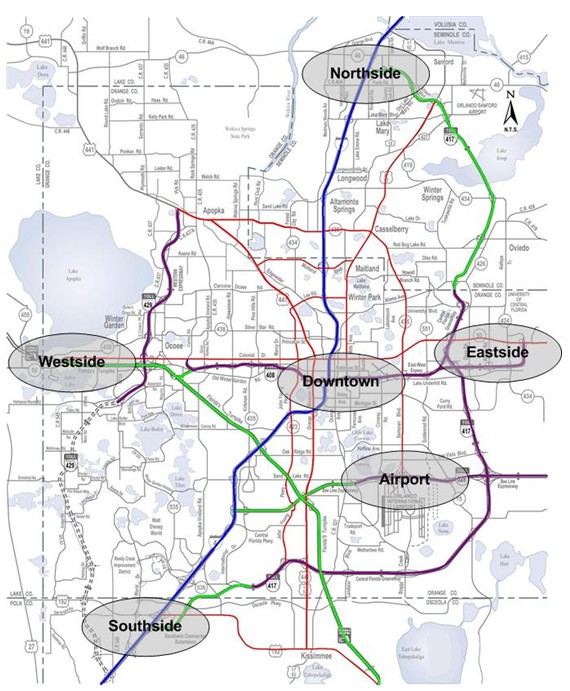
Figure 90. Locations Used for Central Florida 511 Travel Time Summaries
Throughout the period from November 2005, when the Central Florida 511 system went live, to early 2008, FDOT continued to work to find ways to make the system more useful.
10.4. Usage of the Central Florida 511 System
This section of the report presents results from the analysis of usage statistics for the Central Florida 511 system.
10.4.1. Overall Usage of the Central Florida 511 System
Prior to the start of iFlorida, the Orlando 511 system was already receiving nearly 5,000 calls per day, making it the third most frequently called 511 system in the United States behind the San Francisco and Southeast Florida 511 systems. The changeover from the previous 511 system in Orlando, which provided travel times only for I-4, to the more expansive Central Florida 511 system resulted in an apparent drop in the number of 511 calls received by the system, as depicted in Figure 91.
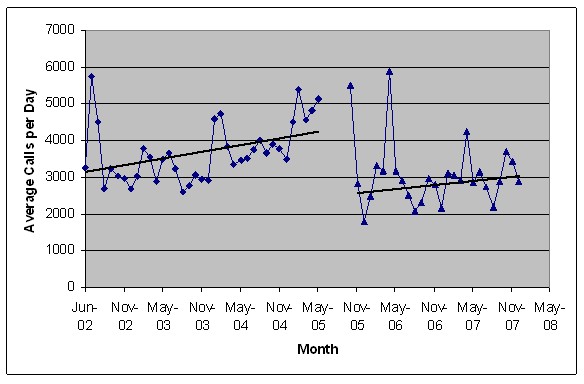
Figure 91. Average Number of Central Florida 511 Calls Per Day by Month
| Transitioning to a new 511 system may alienate existing users accustomed to the former system. |
This chart indicates a steep drop in call volumes, from about 5,000 calls per day in June 2005 to 3,000 calls per day in December 2005, though the trend lines indicate that a similar growth rate applied before and after the transition to iFlorida. (The trend line for the after iFlorida period excludes the data points for November 2005 and May 2005. The first was excluded because the transition to the new system and media coverage surrounding that transition resulted in increased usage. The second was excluded because widespread fires resulted in anomalously high usage that month.)
One cannot be certain that this drop was a direct result of the transition to the new system. It is possible that the approach used to tally the number of calls received changed because a new vendor implemented the new system. The publicity surrounding the unveiling of the 511 system in November 2005 could have resulted in a greater demand at the time of the event. A plot of the average number of calls per day by week (see Figure 92) during the first six months of operation of the new 511 system supports the conclusion that this drop was real.
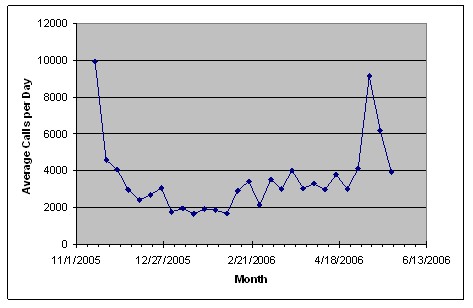
Figure 92. Average Number of Central Florida 511 Calls Per Day, 11/2005 Thru 5/2006
The number of calls per day in the first week of operation (i.e., while publicity was ongoing) was very high, but quickly dropped down to levels comparable to pre-iFlorida levels. The number of calls per day then consistently dropped during the first 12 weeks of operation before beginning to rise again in February 2006.4 At the same time, FDOT received a large number of complaints from previous users that indicated they were unhappy with the new system. Many of these complaints were related to the difficulties former users found in navigating the new menu structures and using the speech recognition features. It appears that the transition to the new 511 system resulted in a significant loss of former users of the 511 system.
Another period of particular interest was the period from May 2007 through September 2007. In May 2007, the CRS failed and FDOT could no longer automatically populate the Central Florida 511 system with travel time information. (See section 2 for more information on the failure of the CRS.) From that time until September 2007, when the SunGuide software that replaced CRS was capable of automatically populating 511 messages, FDOT set 511 messages manually. For I 4, FDOT continued to have access to raw loop detector data and traffic video, and RTMC operators used this information to set travel time messages. FDOT's access to traffic data for other roads was limited, and 511 messages for those roads were based primarily on historical travel times. One might have expected to see a significant drop in the number of 511 users because of the reduced quality of the travel time information available on the 511 system. This did not occur, as shown in Figure 93.
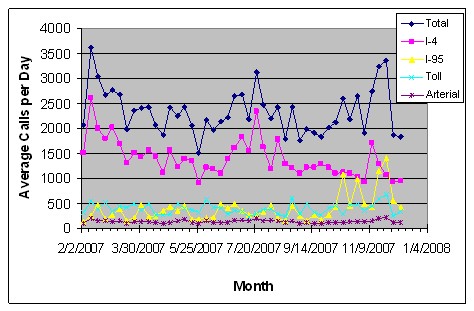
Figure 93. Average Number of Central Florida 511 Calls Per Day, 3/2007 Thru 12/2007
It is interesting to note the difference between the response of 511 users to the changes in November 2005 and those in May 2007. In November 2005, when FDOT made significant modifications to the menu structure and increased the quantity of available data, a large drop in the number of 511 calls occurred. In May 2007, when FDOT was forced to reduce the quality of the 511 data that was available, no such drop occurred.
| Most 511 calls are made while users are on the road. |
Another factor related to 511 usage was the source and timing of the 511 calls. Do travelers call 511 before departing or while on the road? One indirect measure of this was the proportion of 511 calls that were made from a wireless phone, as depicted in Figure 94. This figure indicates that between 60 and 70 percent of 511 calls originated from cell phones. (Note that this chart and the one that follows includes callers to both the Central Florida and Statewide 511 systems. The available data did not allow separate analysis for the two systems.)
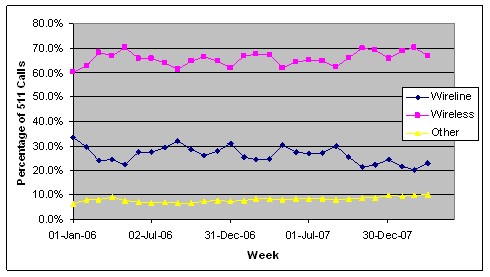
Figure 94. Percentage of iFlorida 511 Calls from Wireless Phones
While it is possible that these cell phone users are calling 511 before starting to drive, a survey of 400 Central Florida freeway drivers5 indicated that most 511 users call the service while on the road. Since 90 percent of 511 users make two or fewer call per week (see section 10.4.4), the conclusion regarding the number of users making calls was likely applicable to the number of calls, as well. The combination of observations, while not conclusive, strongly implied that most 511 calls were made while drivers were already on the road.
While the percentage of 511 calls that were made from cell phones was typically between 60 and 70 percent, the percentage was much higher on days when 511 usage was high, as shown in Figure 95.
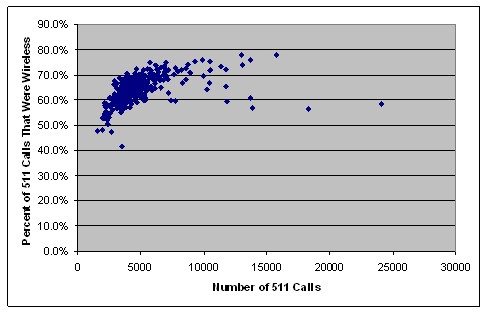
Figure 95. Percentage of 511 Calls from Cell Phones by the Number of Calls Per Day
The implication is that, on most days where 511 usage was high, drivers in cars were using cell phones to call 511 in order to obtain additional information about unusual traffic conditions of which they were already aware. The six anomalous points, points with usage above 10,000 calls per day and percent of calls that were wireless below 65 percent, all occurred in May 2007 when large brush fires caused road closures in the Orlando area. During that period, travelers were apparently calling the 511 service to obtain information on road closures before departing.
While the above results depict the general trends in usage of the Central Florida 511 usage, there were also important variations by day of the week and from day to day. Figure 96 depicts the average number of calls by day of the week for the Central Florida 511 system for the period from January 1, 2006, through February 2, 2008. This chart indicates that, in Orlando, 511 usage was much higher on Fridays than on other days of the week.
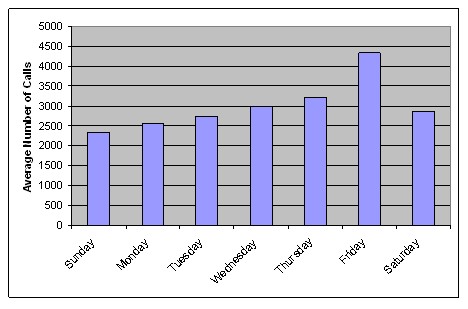
Figure 96. Average Number of Central Florida 511 Calls by Day of the Week
Usage also differed by time of day, as shown in Figure 97. Weekday call volumes showed a strong peak from about 4:00 p.m. until 6:00 p.m., corresponding to the afternoon rush hour. Saturday and Sunday call volumes were spread more evenly throughout the day.
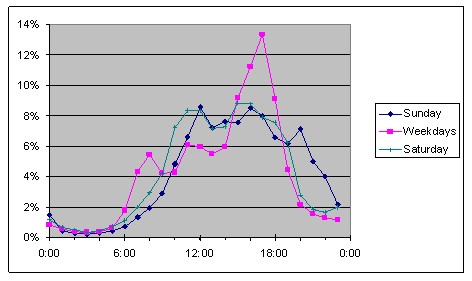
Figure 97. Percentage of iFlorida 511 Calls by Time of Day
Usage also varied from day-to-day, even on the same day of the week, as shown in Figure 98. This figure shows the percentage of days (Tuesday, Wednesday, and Thursday only) during the period from January 1, 2006, through February 23, 2008, for which different daily call volumes were achieved.
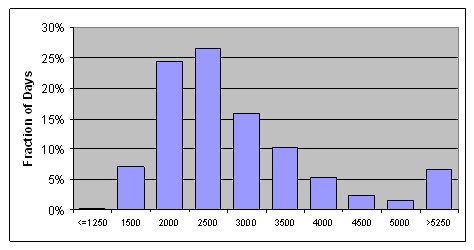
Figure 98. Fraction of Days by Number of Calls; Tuesday, Wednesday, and
Thursday
This chart implies that the Central Florida daily 511 usage could be divided into two groups, one comprising about 94 percent of the days, which followed a unimodal distribution,6 and the other group comprising the remaining 6 percent of the days, which were high usage outliers. These outliers are often associated with an event that results in higher-than-average usage. It was suspected that these days of high usage were related to specific events that occurred on those days. Partial support for that hypothesis comes from an examination of these high usage days.
| About 5 percent of days had much higher than usual 511 call volumes, and those days often occurred in conjunction with unusual traffic incidents. |
For example, 10 of the 15 days in this category in Figure 97 occurred in May and early June 2006, when brush fires were causing closures of roads in Central Florida, including I-95, SR 520, and SR 528. The demand for information about these road closures was apparent in the types of information requested by 511 callers, as shown in Table 14.
| 511 Request | Apr-06 | 4/20/2006 | 5/3/2006 | 5/4/2006 |
|---|---|---|---|---|
| I-4 | 2,077 | 4,457 | 2,587 | 2,245 |
| I-95 | 129 | 102 | 1,216 | 722 |
| SR-408 | 119 | 109 | 110 | 78 |
| SR-528 | 49 | 72 | 730 | 795 |
| Florida's Turnpike | 86 | 81 | 112 | 71 |
| SR-50 | 25 | 39 | 94 | 149 |
| US-17/92 (Mills) | 30 | 42 | 45 | 36 |
| OBT (US-441 / US-17 / US-92) | 32 | 53 | 35 | 27 |
| SR-417 | 43 | 86 | 63 | 30 |
| US-192 | 26 | 34 | 38 | 28 |
| SR-520 | 16 | 22 | 280 | 234 |
| SR-436 | 17 | 28 | 16 | 34 |
| SR-423 | 9 | 23 | 7 | 8 |
| Maitland Blvd. (SR-414) | 7 | 23 | 6 | 8 |
| SR-429 | 8 | 13 | 6 | 9 |
In this table, the first column indicates a highway for which the Central Florida 511 system could provide traffic information. The April 2006 column is the average number of daily requests for the Tuesdays, Wednesdays, and Thursdays in April 2006. The other columns list the number of requests on the day indicated. Note that on May 3 and 4, 2006, most of the additional requests for information were concentrated on the roads that were subject to closure because of smoke from the fires. Similar usage patterns existed for the other days in May and early June when usage was high and road closures due to brush fires were a threat.
A different event explained the high usage on April 20, 2006, where the additional 511 requests were concentrated on I-4. A review of the time of those requests (see Figure 99) indicates that a large increase in requests began to occur between 9:00 a.m. and 10:00 am. A review of the DMS message logs indicated that a crash occurred at about 9:30 a.m. on I-4 westbound near Lee Road. Messages were posted on two DMSs, one located at SR 436 and one located west of Lake Mary Boulevard. The sign at Lake Mary Boulevard continued to display information about this crash until 11:20 am. A review of travel speeds on I-4 westbound shows speeds of less than 20 mph over an approximate 1.5 mile portion of I-4 lasting from about 9:30 a.m. until nearly noon. Traffic volumes in the westbound direction also dropped dramatically, from more than 1,800 vehicles per lane per hour to about 350 vehicles per lane per hour. The location and time extent of the increased 511 usage seemed to correspond with travelers seeking information about this crash and the resulting congestion.
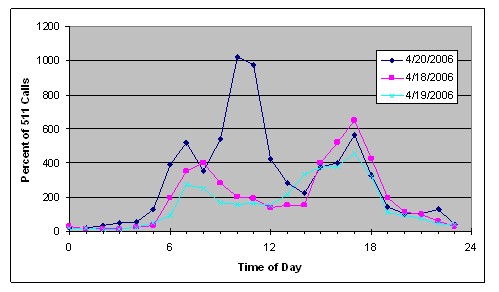
Figure 99. Central Florida 511 Usage by Time of Day for 4/20/2006
| A significant percentage of the drivers of vehicles impacted by an incident appeared to call the 511 system. |
Comparing the number of 511 calls that occurred on April 20 with the average number of calls on April 18 and 19 indicated that, during the 3 hour period from 9:00 a.m. until noon, this crash generated an additional 2,235 calls over normal call volumes. The normal traffic volume for the westbound section of I-4 during this period would be about 14,000 vehicles. These 2,235 calls to 511 represented about 16 percent of the vehicles that were likely directly impacted by the delays caused by this crash.
A review of other days with much larger than average 511 call volumes revealed a similar pattern. On March 9, 2006, about 3,000 more calls came in to the 511 system than on previous days, with the highest call volumes occurring between 8:00 a.m. and 4:00 p.m. and between 7:00 p.m. and 9:00 p.m. On that day, DMSs reported crashes on I-4 in Orlando from 9:24 a.m. until 11:43 a.m. (eastbound near SR 408), from 10:56 a.m. until 11:32 a.m. (eastbound near Orange Blossom Trail), and from 8:08 p.m. until 8:52 p.m. (eastbound near Fairbanks Avenue). A review of congestion on I-4 indicated unusually severe congestion between about 9:00 a.m. and 3:00 p.m. and between about 7:00 p.m. and 9:00 p.m., correlating well with the increased 511 usage pattern. These 3,000 calls represent about 19 percent of the vehicles that were likely directly impacted by the delays caused by these crashes.
One interpretation of this result is that about 15 percent of drivers who observed unusual congestion related to the incident called 511 for additional information about traffic conditions.
10.4.2. The Duration of Central Florida 511 Calls
The duration of the 511 calls was another useful metric for assessing the performance of the system. This metric is important in two ways. First, the value of this metric impacts the number of simultaneous call that will occur during operations-for the same number of calls, longer calls will generate more simultaneous calls. This metric also measures the quality of the service provided to the caller, in that a caller is better served if they receive more traffic information in less time. Figure 100 depicts the average duration of Central Florida 511 calls for each month from November 2005 through April 2008. (In computing this average, calls of length less than 15 seconds were excluded from the average as these calls were too short for the caller to receive traveler information. These calls averaged between 6 and 8 percent of all calls throughout this period. Calls of length greater than 5 minutes were also excluded because FDOT periodically made very long calls to test system operations. These calls were rare, at about 0.1 percent of all calls.)
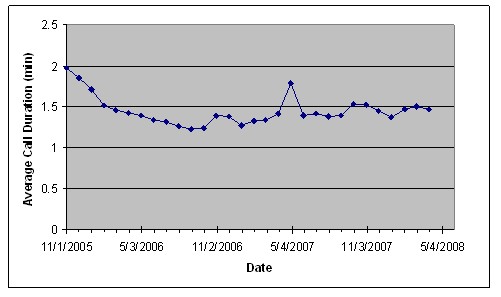
Figure 100. The Average Duration of Central Florida 511 Calls
The evolution of the call durations is depicted in Figure 101. Soon after the deployment, the calls showed a wide range of durations, perhaps because callers were spending more time experimenting with the new 511 features. By March 2006, the call durations began to cluster around the median of about 70 seconds.
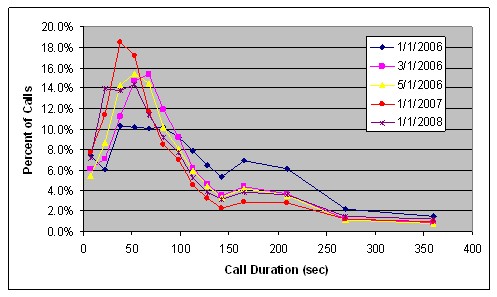
Figure 101. Distribution of 511 Call Durations
This median is, in part, explained by the results of Figure 101, which depicts the distribution of call durations on March 26, 2008, according to the number of traffic information messages received by the caller. The average call duration of Figure 102 is between the distributions for callers receiving one and two traffic information messages.
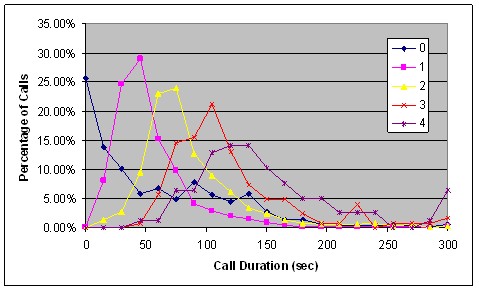
Figure 102. Call Duration by Number of Traffic Information Messages Received
This figure also provides information about the time required for users to obtain traffic information from the Central Florida 511 system-it took about 50 seconds to receive the first traffic information message from the system and about 30 seconds for each additional traffic information message.
10.4.3. Information Requested from the Central Florida 511 System
One of the new features of the Central Florida 511 system was the inclusion of many additional roads in the system. Figure 103 depicts the average number of Central Florida 511 requests per day by the type of road for which the request was made for each month from December 2005 through March 2008.
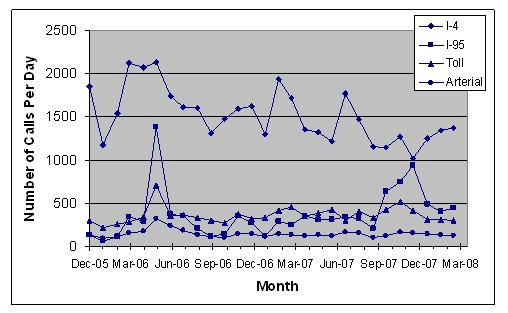
Figure 103. Number of Central Florida 511 Requests by Type of Road
Figure 104 depicts the same data, but presented as a stacked area chart showing the percentage of the requests for each type of road.
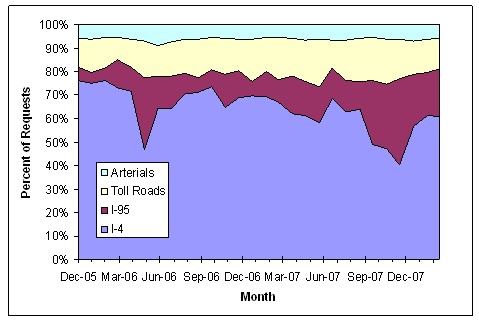
Figure 104. Percentage of Central Florida 511 Requests by Type of Road
| 511 users made few traffic information requests for arterials. |
Note that few requests were made for information on arterial traffic conditions, averaging less than 150 requests per day, and the number of these requests did not seem to increase over time. There was apparently little demand for this type of traveler information. Requests for traffic information on limited access roads was more frequent, averaging a combined total of 300 requests per day for the 5 toll roads, over 400 requests per day for I-95, and around 1,300 requests per day for I-4. The number of requests for I-4 information decreased with time, while the number of requests for information about I-95 and the toll roads increased over time. The requests for arterial traveler information showed little change over this period.
The number of requests for traffic information also varied from segment to segment within these roads. Table 15 lists this variation for the 511 calls made during three days in early 2008. As might be expected, the most requested segments were those near central Orlando (e.g., the portion of I-4 from the Florida Turnpike to SR 426, the portion of SR 408 from I-4 to SR 50).
| Road | Percentage of 511 Requests | |||
|---|---|---|---|---|
| Segment 1 | Segment 2 | Segment 3 | Segment 4 | |
| I-4 | 13% | 65% | 13% | 9% |
| I-95 | 76% | 18% | 5% | 0% |
| Turnpike | 30% | 61% | ||
| SR 408 | 24% | 76% | ||
| SR 417 | 25% | 30% | 45% | |
| SR 528 | 36% | 64% | ||
| US 17/92 | 98% | 2% | ||
To put these numbers in perspective, a recent estimate put the number of daily trips taken on I-4 as 1.53 million.7 Assuming that each request for traffic information on I-4 is made in conjunction for preparing for a trip that might include I-4, the fraction of total trips on I-4 for which 511 is used to help plan the trip was less than 0.1 percent. While the Central Florida 511 system may have helped users of the system avoid using I-4 when traffic conditions on I-4 are poor, it did little to relieve congestion on I-4-there simply were not enough users of the system to have a significant impact on congestion.
| The percent of I-4 travelers using the 511 system for information on I-4 traffic is very small-too small to have a measurable impact on traffic conditions and congestion. |
Over the course of the evaluation, FDOT also introduced several different ways to access 511 information. Initially, the system used two types of informational messages: floodgates were used to provide information to all callers (e.g., during a hurricane) and segment reports were used to provide information about selected segments of road (e.g., a portion of I-4). If a user requested information about an entire road, the information was provided by concatenating together a series of segment reports. Later, FDOT added other formats for this data. Drive time summaries provided summary information about traffic conditions for vehicles traveling towards Orlando in the morning and away from Orlando in the afternoon. Link summaries provided a summary of traffic conditions for an entire road. Road floodgates were used to provide information to all users that requested information about a particular road. Table 16 lists the number of 511 requests fulfilled by the Central Florida 511 system on the last Wednesday of each month, beginning in January 2007. These results indicated that most Central Florida 511 users received segment reports when they called the 511 system.
| Date | Floodgate | Link Floodgate | Segment Report | Link Summary | Drive Time Summary |
|---|---|---|---|---|---|
| 1/31/2007 | 0 | 0 | 2,140 | 1,008 | 26 |
| 2/28/2007 | 0 | 0 | 2,747 | 1,032 | 17 |
| 3/28/2007 | 5 | 0 | 2,110 | 783 | 14 |
| 4/25/2007 | 0 | 0 | 2,502 | 753 | 26 |
| 5/30/2007 | 0 | 0 | 2,380 | 742 | 24 |
| 6/27/2007 | 0 | 0 | 5,203 | 715 | 118 |
| 7/25/2007 | 2,734 | 0 | 3,610 | 519 | 0 |
| 8/29/2007 | 2,650 | 5 | 3,439 | 596 | 0 |
| 9/26/2007 | 2,245 | 0 | 2,562 | 0 | 0 |
| 10/31/2007 | 4,702 | 0 | 5,339 | 0 | 0 |
| 11/28/2007 | 2,980 | 31 | 2,769 | 0 | 0 |
| 12/26/2007 | 402 | 21 | 9,679 | 0 | 0 |
| 1/30/2008 | 0 | 0 | 2,005 | 0 | 0 |
| 2/27/2008 | 0 | 0 | 1,640 | 0 | 0 |
| 3/26/2008 | 0 | 3 | 2,412 | 0 | 0 |
| 4/30/2008 | 35 | 0 | 2,033 | 56 | 0 |
| Caller requests to regional 511 systems may focus on traveler information, with few callers requesting transfers to other 511 systems. |
Another new feature of the Central Florida 511 system was the ability to transfer the call to other traveler information systems, such as the Statewide 511 system, other regional 511 systems, and information systems for local transit agencies and airport authorities. Figure 105 depicts the percentage of Central Florida 511 calls that were transferred to one of these other systems during the call. Transfers from the Central Florida 511 system were relatively uncommon-only about 6 percent of calls into the Central Florida 511 system later transferred into another system.
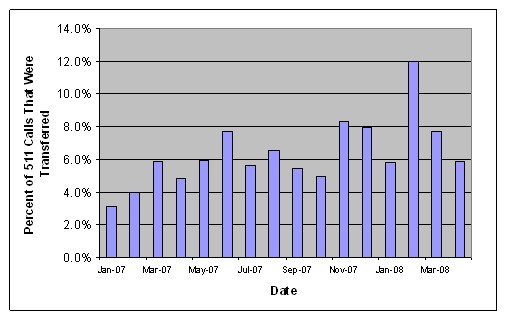
Figure 105. Percent of Central Florida 511 Calls that Were Transferred
Another feature of the Central Florida 511 system was to allow users to register their phone number with the system so that the 511 system could present traveler information specifically tailored to that individual user. The users could select from several pre-defined types of trips (called profiles), such as "To School" or "From Work." For each profile, the user defined the specific segments for which he or she would want traffic information. If the user defined a single profile, then the system would automatically play the traffic reports associated with that profile if the user called. If multiple profiles were defined, the user stated the profile name to select among the defined profiles.
| The My Florida 511 system, a personalized 511 system, required fewer commands to access traffic information and provided callers with traffic information more quickly. |
The My Florida 511 approach had the potential to improve 511 service in two different ways. First, it could allow 511 users to reach their desired traffic information more quickly by reducing the number of menu selections that were required. Second, it could result in fewer errors in interpreting voice input by the users, since the user would be selecting from a small set of profiles rather than a larger set of roads, cities, or counties.
A few examples of My Florida 511and non- My Florida 511 calls will exemplify these potential advantages. First, consider a My Florida 511 call with a single profile from March 26, 2008. This call followed the sequence of events:
- (0 sec into call) 511 system announced the default introduction and stated "I see that you saved a profile: 'To Home.' "
- (3 sec into call) 511 system stated "Report 1," then read then the traffic report for the portion of I-4 identified as part of the "To Home" profile.
- (37 sec into call) The 511 user hung up and the call ended.
Note that the user began to receive traffic information within 3 seconds of making the call without having to make a single menu selection. Less than 10 percent of the call time was spent providing introductory information, with more than 90 percent of the time spent providing traffic information. An example of a My Florida 511call with more than one profile from March 26, 2008, followed this sequence of events:
- (0 sec into call) 511 system announced the default introduction and stated "OK. I see that you have saved profiles. Do you want to hear about: 'From Work' or 'To Home'?" and waited for input from the user.
- (16 sec into call) The user stated his or her preference, and the 511 system began stating the traffic reports associated with the selected profile. The system stated "Report 1," then read the traffic report for one segment of I-4.
- (46 sec into call) The system stated "Report 2," then read the traffic report for another segment of I-4.
- (71 sec into call) The user hung up and the call ended.
In this case, the user made a single menu choice and received traffic information for two road segments. The first 16 seconds of the call (about 22 percent of the call time) were spent making that menu choice, with the remaining 55 seconds (about 78 percent of the call time) spent providing traffic information.
For comparison, a call made on the same day by a non-My Florida 511user followed this sequence of events:
- (0 sec into call) 511 system announced the default introduction and main menu, then waited for input from the user.
- (9 sec into call) The user stated "Highways." Then, the 511 system asked, "Which city, county or highway would you like information for? To hear a summary report, say 'summary report,' or, if you want to know your travel time, say 'travel time.' If you want to hear a driving time summary, say 'summary.' You can say 'help' or press the star key to hear the list of highways we cover." The system then waited for input from the user.
- (16 sec into call) The user stated, "I-4," and the 511 system responded, "Say 'south' for 27 to the Turnpike. Say 'Orlando' for the Turnpike to 436. Say 'north' for 436 to the St Johns River Bridge. Say 'Volusia' for the St Johns River Bridge to I-95. Or say 'All' to hear them all." The system then waited for input from the user.
- (24 sec into call) The user stated "Orlando." Then, the 511 system stated the segment report for that portion of I-4 and waited for input from the user.
- (39 sec into call) The user hung up and the call ended.
Note that it required 24 seconds before the user began to receive traffic information for a single segment of road, and about 62 percent of the call was spent making menu choices with only 38 percent of the call spent receiving traffic information. The average time for all calls made on February 27, 2008, to receive the first traffic information was 9.3 seconds for My Florida 511 callers and 28.6 seconds for all other callers.
| The percent of calls made by by My Florida 511 users, a personalized 511 service offered by FDOT, did not increase over time. |
Although more than 4,000 users have signed up for the My Florida 511, only about 2 percent of Central Florida 511 calls are currently made by My Florida 511 users, as shown in Figure 106.
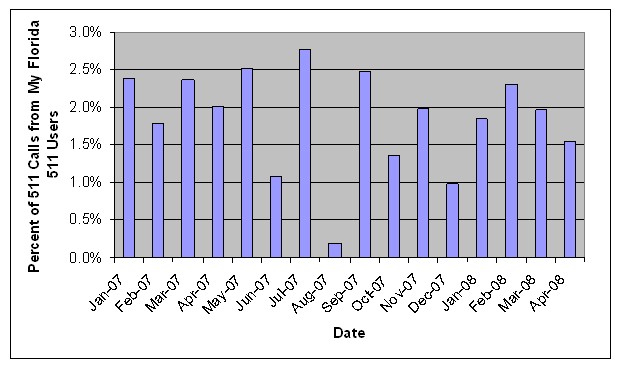
Figure 106. Percent of Central Florida 511 Users that are My Florida 511 Users
It is interesting to note that, despite the increasing number of people who registered for the My Florida 511 service, the percentage of calls made by My Florida 511 users did not increase over time. This implied that existing My Florida 511 users discontinued using the service at about the same rate as other users newly signed up for the My Florida 511 service.
10.4.4. Usage Patterns of 511 Users
The data archived by FDOT also allowed the evaluation team to explore the 511 usage patterns of individual 511 users. The 511 system archived detailed information from each 511 call received, assigning a unique identifier to each caller based on the phone number from which the call was made.8 This data was used to explore how 511 callers used the system.
The first analysis focused on the question of how often 511 users called the system: did users call the system frequently (i.e., as might be done if a user called the 511 system every day on their way to work) or infrequently (i.e., as might be done if a user called the 511 system only after becoming aware of unusual traffic conditions)? Figure 107 depicts the number of Central Florida 511 calls made per 511 user for those users that called the week of March 9, 2008. (This analysis was restricted to calls lasting at least 20 seconds.) During this week, about 74 percent of the 511 calls were from users that made only one 511 call that week, with an additional 16 percent making two calls during the week. Only 10 percent of 511 users-1,134 users-made more than 2 calls per week. Only 268 users made 5 or more calls per week, as might be expected for a traveler using 511 every day during their work commute. The average number of calls during the week per 511 user was 1.5.
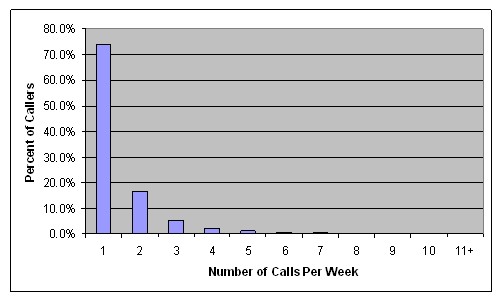
Figure 107. Number of Calls Per Week by Central Florida 511 Users, 3/9/2008 thru 3/15/2008
This pattern of infrequent use is also supported by Figure 108, which depicts the number of callers according to the number of days called during the week of March 9, 2008. Almost 90 percent of callers called on only a single day that week, with 795 callers making calls on two different days and 433 callers making calls on three or more different days. This result provided further indication that few Central Florida 511 callers used the system as part of their daily trip planning process.
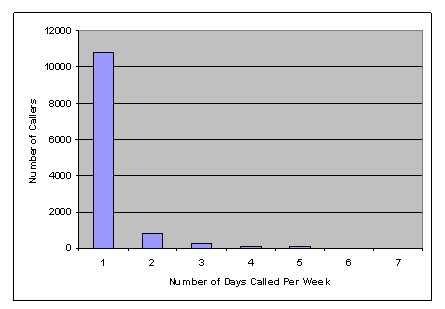
Figure 108. Number of Days Called per Week for Central Florida 511 Users
The following two charts, Figure 109 and Figure 110, provide more detailed information about the 511 users that did use the system frequently. Both of these charts depict the number of frequent Central Florida 511 users each week (labeled "Callers" in the charts), using two different definitions for a frequent user. In Figure 108, a frequent user is one that called the 511 system at least three times in a week and called on at least two different days. In Figure 109, a frequent user called at least 4 times on at least three different days. In these charts, the "added" line represents 511 callers that called frequently in a given week, but did not call frequently in the preceding week. The "dropped" line represents those that had called frequently in the preceding week, but did not call frequently in the given week. The "new" line represents the number of frequent users in the indicated week that had not previously been frequent users - it was the first time that caller had used the 511 system frequently. The "continued" line represents the number of frequent users in the indicated week that were frequent users in the previous week.
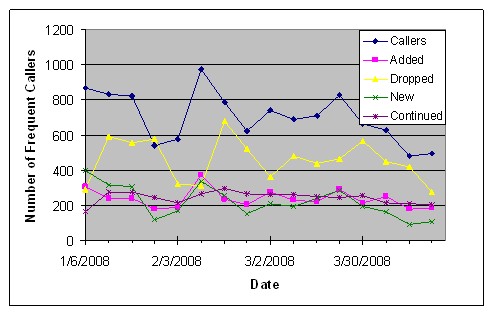
Figure 109. Frequent Central Florida 511 Callers, Those Making 3 Calls Per Week on 2 Different Days
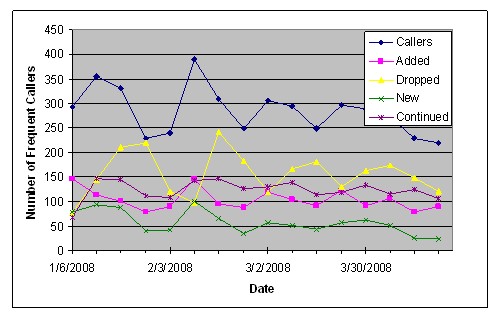
Figure 110. Frequent Central Florida 511 Callers, Those Making 4 Calls Per Week on 3 Different Days
| Very few 511 users appeared to regularly use the system as part of their daily commute planning. |
These charts show not only the number of frequent callers -between 600 and 800 using the former definition and around 300 using the latter-they also show the changeover in frequent users from week-to-week. If the 511 system was attracting callers to use the system frequently each week and consistently from week-to-week, one would expect the "callers" line to increase over time, the "continued" line to be nearly as large as the "callers" line, and the "dropped" line to be small. The fact that this was not the case indicated that the iFlorida system was not good at retaining frequent callers. Using the looser definition of a frequent user (Figure 108), about 65 percent of frequent users during one week were not frequent users the following week. Using the more stringent definition of frequent users, an average of 57 percent of frequent users during one week were not the next. In other words, most of those classified as frequent users in these figures were not consistently so. Taken together, this information suggested that very few Central Florida 511 users make regular use of the system as part of their daily trip planning.
10.4.5. Phone Lines Required to Support the 511 Service
One of the key design objectives for the Central Florida 511 system was ensuring the system could handle the number of calls that it might receive. The system was designed with a number of features intended to ensure this objective would be met:
- The system could handle a large number of simultaneous calls. The number of 511 calls that the system could handle simultaneously was specified by the number of ports available to the system. Initially the system was configured with 255 ports, although this number was modified as operations continued.
- If the number of simultaneous calls exceeded the number of ports, the excess calls were placed in a queue. While in the queue, the callers received a message indicating that their call would be processed as soon as a line was available.
- FDOT could quickly reconfigure the system to play only a floodgate message to callers, which would reduce the length of calls and free space for new calls more frequently. For example, this feature might be used during a hurricane evacuation when a very large number of callers might be expected.
Because the 511 call volume did not exceed the number of ports available to FDOT, the features for handling excess calls were not used. Figure 111 depicts the maximum number of ports required each day versus the daily call volume for that day. The middle line shown is a curve fit for the mean peak number of lines used, with the bottom and top lines being curve fits for the 5th and 95th percentiles around these means.
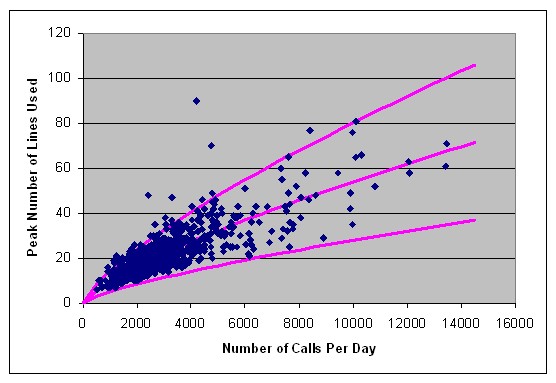
Figure 111. Peak Number of Lines Used Versus Number of Calls Per Day
Note that one of the challenges FDOT faced in designing the 511 system was anticipating the number of ports necessary to handle the expected 511 call volume. This chart provides some guidance in doing so. For example, one would expect 19 ports to handle a day with 2,500 calls about half the time. Increasing the number of ports to 28 would handle a day with 2,500 calls about 95 percent of the time. However, Figure 97 on page 156 indicates that, if the average number of calls per day is expected to be about 2,500, call volumes may exceed twice that value on about 5 percent of days, with even larger call volumes on some days. Designing the system to handle these peak days would require a larger number of ports.
10.4.6. The Performance of the Speech Recognition System
One of the new features of the iFlorida 511 system over its predecessor was the use of voice recognition to process menu selections by 511 users. (The system supported both voice recognition and touch tone entries, though most menu texts emphasized the use of spoken word for selecting menu options.) This section of this report explores the effectiveness of the speech recognition.
Soon after starting Central Florida 511 operations, comments FDOT received on the 511 system indicated that users were frustrated with the effectiveness of the speech recognition system. Many callers complained that the system frequently could not interpret or misinterpreted them when they provided spoken input to the system.
FDOT responded by manually reviewing call archives to identify enhancements that could be made to the 511 system. This resulted in FDOT improving the system by simplifying the menu structure and increasing the number of words recognized by the 511 system to include commonly used synonyms for roads and locations.9 Later, FDOT established the My Florida 511 program, which could provide traffic information to some callers without requiring any input at all. Despite these efforts, the frequency with which caller inputs could not be interpreted by the 511 system remained high, as shown in Figure 112. In this figure, the "rejected" line refers to the percentage of calls for which the 511 system rejected user input at least one time and the "aborted" line refers to the percentage of calls for which the 511 system stopped waiting for user input at least one time. (Some of these aborts occurred after the system finished providing traffic information and were expected.) The "either" line refers to the percentage of calls for which either of these events occurred.
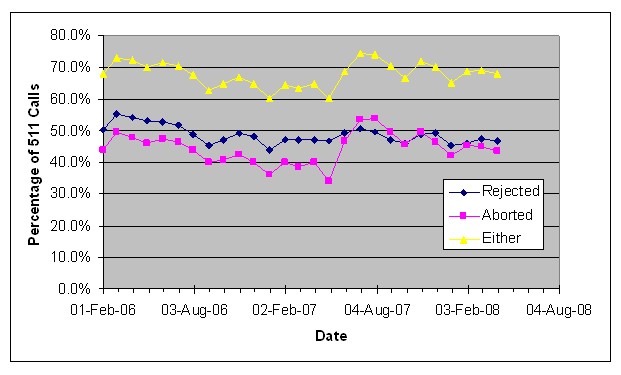
Figure 112. Effectiveness of the iFlorida 511 System Speech Recognition
Early in the deployment, more than 50 percent of calls included at least one case of rejected input during the call. As FDOT refined the 511 system, this percentage dropped slightly, reaching about 46 percent in 2008. A more detailed analysis of all calls from selected days indicated that the ratio of user input that was accepted by the system to user input rejected by the system was about 6-to-1. In other words, about one out of seven efforts by the user to provide input to the system was rejected. Since the average call required several user inputs to complete, the failure rate of one in seven resulted in the high percentage of calls that included rejected user input. Despite efforts in this area, a large number of iFlorida 511 callers continued to experience problems with the system rejecting their spoken inputs to the system.
| 511 implementers should consider establishing and monitoring metrics on the effectiveness of the speech recognition used in their 511 system. |
The difficulty with navigating the menu structure could explain the large percentage of calls during which the caller did not receive detailed traffic information, as shown in Figure 113.
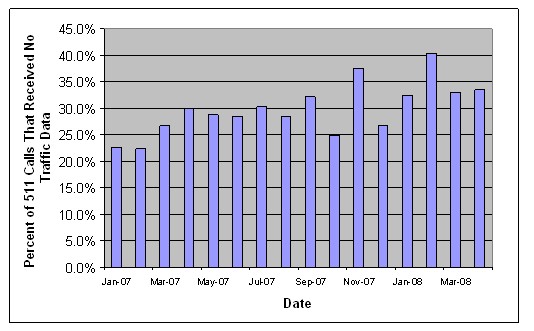
Figure 113. Percent of 511 Calls Without Traffic Information
Over the period shown, about 29 percent of Central Florida 511 calls did not result in the caller receiving any traffic information. In about one-third of these calls, the 511 system did not process any requests from the users-either the caller did not make any requests, or background noise was such that the system did not recognize that the caller had made a request. That leaves about 18 percent of the calls for which the 511 system attempted to interpret input from the caller, but did not end up providing the caller with traffic information.
Having input rejected by the 511 system had a negative impact on whether a caller succeeded in obtaining traffic information. This is demonstrated in Table 17. In this table, the columns indicate the number of caller inputs accepted by the system and the rows indicate the number of caller inputs rejected. The values indicate the percentage of the calls with the indicated number of accepted and rejected inputs that resulted in the caller receiving traffic information. Note that when the number of accepted inputs was less than three, few callers received traffic information. This is because most calls required at least two inputs to access traffic information. (My Florida 511 calls can obtain traffic information with no inputs.) Once the number of accepted inputs reached three, most callers received traffic information, though the fraction of callers that received traffic information dropped as the number of rejected inputs increased.
| Inputs Rejected | Inputs Accepted | |||||
|---|---|---|---|---|---|---|
| 0 | 1 | 2 | 3 | 4 | 5+ | |
| 0 | 5% | 34% | 87% | 94% | 78% | 89% |
| 1 | 0% | 10% | 41% | 86% | 85% | 92% |
| 2 | 0% | 5% | 24% | 83% | 75% | 85% |
| 3 | 0% | 0% | 13% | 56% | 81% | 83% |
| 4 | 0% | 0% | 0% | 71% | 71% | 81% |
| 5+ | 13% | 0% | 0% | 27% | 73% | 86% |
Cognizant of the impact that rejected caller inputs had on the ability of the 511 system to provide callers with traffic information, FDOT continuously searched for ways to tweak the menu structure or supplement the dictionary of words understood by the system so as to increase the system's ability to understand caller requests. As shown in Figure 112 on page 172, these steps had only a small positive impact on the system performance.
However, one enhancement made by FDOT that did result in fewer rejections of user input was the My Florida 511 program. (See section 10.4.3 for more information on this program.) In many cases, My Florida 511 users could receive traffic information without making any user inputs. If inputs were required, the inputs were restricted to the names of a small number of "profiles" previously defined by the caller. A review of 511 calls made by My Florida 511 users indicated a higher percentage of calls in which the system provided traffic information though no input was required and a lower rate of rejection when input was required.
For example, of the 46 My Florida 511 calls made to the Central Florida 511 system on March 26, 2008, callers received traffic information during 43 of those calls. Table 18 shows the number of Central Florida 511 calls during which callers received traffic information for My Florida 511 users according to the number of caller inputs accepted and rejected.
| Inputs Rejected | Inputs Accepted | |||||
|---|---|---|---|---|---|---|
| 0 | 1 | 2 | 3 | 4 | 5+ | |
| 0 | 12 of 12 | 9 of 9 | 4 of 4 | 1 of 1 | 2 of 2 | 0 of 1 |
| 1 | 0 of 0 | 2 of 2 | 2 of 2 | 1 of 1 | 0 of 0 | 2 of 2 |
| 2 | 0 of 0 | 1 of 1 | 1 of 1 | 0 of 0 | 0 of 0 | 2 of 3 |
| 3 | 0 of 0 | 0 of 0 | 0 of 0 | 1 of 1 | 0 of 0 | 0 of 0 |
| 4 | 0 of 0 | 0 of 0 | 0 of 0 | 0 of 0 | 0 of 0 | 1 of 1 |
| 5+ | 1 of 1 | 0 of 0 | 0 of 0 | 0 of 1 | 0 of 0 | 1 of 1 |
Although many My Florida 511 callers experienced problems with the 511 system rejecting their input, almost all callers did receive traffic information during their calls. Because the percentage of 511 calls made by My Florida 511 users was only a small fraction of the total 511 calls received, better system performance for these users resulted in only small improvements in overall system performance.
10.5. The Statewide 511 System
The Statewide 511 system was operated by the same vendor that supported the Central Florida 511 system, and shared many if its characteristics. The roads covered by the Statewide 511 system are those highlighted in Figure 114 and included all Interstate highways in the state as well as other key toll roads and state highways.
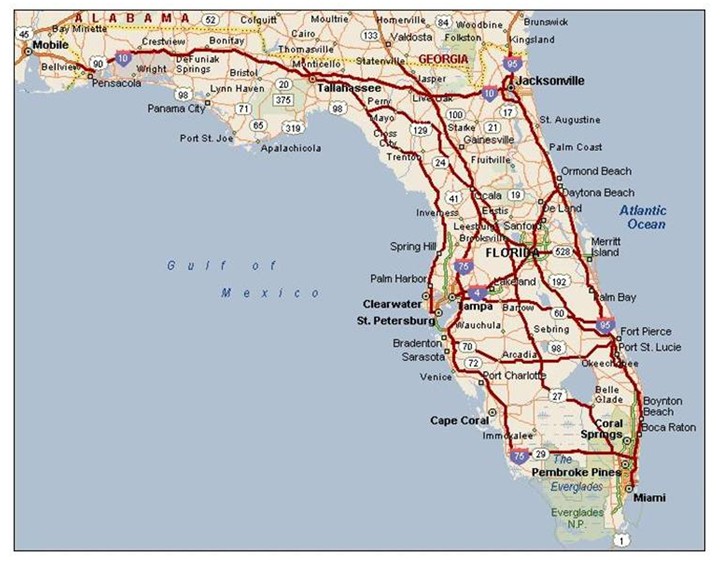
Figure 114. Statewide 511 System Roads
As with the Central Florida 511 system, these roads were divided into segments, so that a caller selected a road segment of interest by first specifying a road, then specifying a specific segment of that road. (A caller could also select a city or county and a road, in which case the segments of the road within or near the selected city or county would be selected.) The same architecture as for the Central Florida 511 system was used to update the messages for the Statewide 511 system (see Section 10.3.1.2). A similar call tree structure was also used (see Section 10.3.1.3), though some of the changes made after the initial system was deployed (e.g., travel time summaries, drive time summaries) did not apply to the Statewide 511 system.
There was one important difference between the two systems: the traffic information available for the segments in the Statewide 511 system was limited. The original concept for the Statewide 511 system identified three primary sources of statewide traffic information:
- A statewide collection of traffic monitoring stations, called the Statewide Monitoring System, provided access to real-time speed, volume, and occupancy data and traffic video. (See Section 8 for more information).
- An interface with the FHP-CAD system provided access to incident information. (See Section 5 for more information).
- Construction reports provided access to information on construction activities. (FDOT organized a method for districts and counties across the state to submit reports on construction activities to FDOT D5 for inclusion in statewide traveler information.)
These plans also called for the Statewide 511 system to cover all the roads that were part of the Florida Intrastate Highway System (FIHS), a total of almost 4,000 miles that included all Florida Interstate highways, the Florida Turnpike, a number of urban expressways, and major interregional and intercity arterial highways.
| Populating the Statewide 511 system with high quality traffic information was challenging. |
As FDOT explored the information available to support statewide traveler information services, the agency realized that it could not ensure that they had reliable traffic information on many of the roads that constituted the FIHS. The Statewide Monitoring System provided traffic information at 25 points across the state along Interstate highways. FHP was not responsible for responding to incidents on all parts of all the roads on the FIHS, and the FHP-CAD system would not contain information on incidents to which FHP did not respond. Because of these concerns, FDOT reduced the scope of the Statewide 511 system to those roads shown in Figure 114.
Even when limited to these roads, it was difficult for FDOT to ensure that the Statewide 511 system contained complete and up-to-date traffic information. In the Orlando area, FDOT D5 had an extensive network of traffic monitoring devices and traffic video surveillance in place, as well as close working relationships with all of the organizations in the area responsible for responding to incidents that might occur. When an incident occurred in the Orlando area, FDOT could often directly observe it and, if not, knew who to contact to get more information about the incident. This gave FDOT access to detailed information needed to populate the Central Florida 511 system with up-to-date traffic information. This level of detail was not available to FDOT D5 for incidents that occurred in other locations.
10.6. Usage of the Statewide 511 System
This section of the report presents results from the analysis of usage statistics for the Statewide 511 system.
10.6.1. Overall Usage of the Statewide 511 System
The Statewide 511 system was newly deployed as part of the iFlorida Model Deployment, so did not have a previous history of usage. The usage rates for this system after it went live in November 2005 are depicted in Figure 115. As with the Central Florida 511 usage rates, usage rates for the Statewide 511 system were initially high but quickly dropped to much lower levels. The high initial usage was likely due to the publicity associated with the iFlorida unveiling. These high usage levels quickly dropped off after the unveiling and continued to drop throughout the evaluation period. (The linear trend line shown in this figure was computed using data beginning in January 2006 so as to omit the effects of the unveiling.)
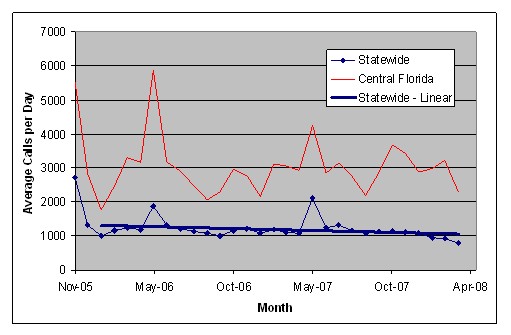
Figure 115. Average Number of Statewide 511 Calls Per Day by Month
The exceptions to this trend occurred in May 2006 and May 2007, when brush fires resulted in many road closures. In May 2006, fires in Central Florida resulted in closures of I-95, and 511 requests for information on I-95 resulted in the increased 511 usage for that month. In May 2007, fires occurred near the Georgia border and resulted in closures of I-10 and I-75, resulting in increased 511 requests for those roads during that month.
Figure 116 depicts how the number of calls varied by the day of the week. As with Central Florida 511, usage was higher on Fridays than on other days of the week.
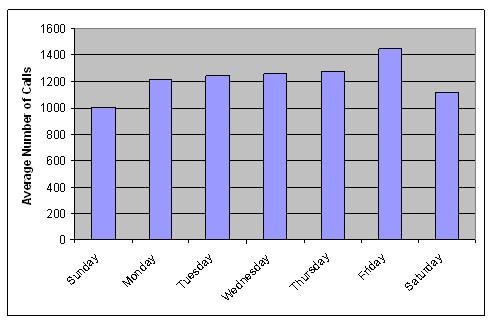
Figure 116. Average Number of Statewide 511 Calls by Day of the Week
The variation by time of day for Statewide 511 calls is shown in Figure 117. The weekday peak occurred during afternoon rush hour, with the weekend peak being more spread throughout the day.
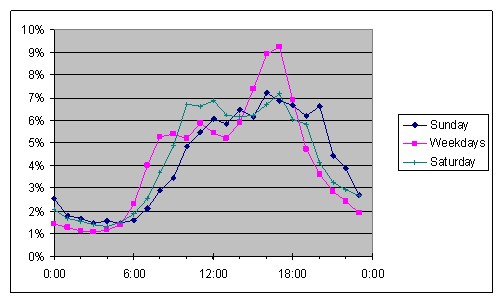
Figure 117. Percentage of Statewide 511 Calls by Time of Day
Usage also varied from day-to-day, even on the same day of the week, as shown in Figure 118. This figure shows the percentage of days (Tuesday, Wednesday, and Thursday only) during the period from January 1, 2006, through April 26, 2008, for which different daily call volumes were experienced. Comparing this chart with Figure 98 on page 159 shows that the Statewide 511 system showed less day-to-day variation in call volume than was exhibited by the Central Florida 511 system.
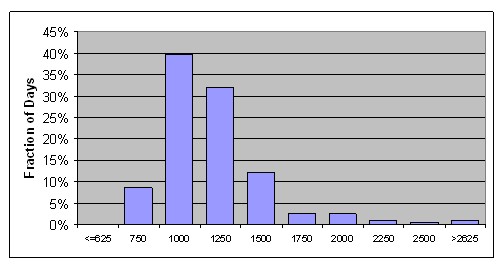
Figure 118. Fraction of Days by Number of Calls: Tuesday, Wednesday, and Thursday
10.6.2. The Duration of Statewide 511 Calls
The average duration of Statewide 511 calls was about 1.5 minutes long throughout much of the operation period, as indicated in Figure 119. (Calls of duration less than 15 seconds were excluded from the average as these calls were too short for the caller to receive traveler information. A large fraction of Statewide 511 calls, ranging from 30 to 40 percent of all calls for most months, fell into this category. Calls of duration greater than 5 minutes were also excluded because FDOT periodically made very long calls to test system operations. These calls were rare, typically less then 0.1 percent of all calls.) The average call duration was about 1.5 minutes in most months. The longer average duration in May 2007 appeared to be related to callers requesting information about brush fire-related road closures in North Florida.
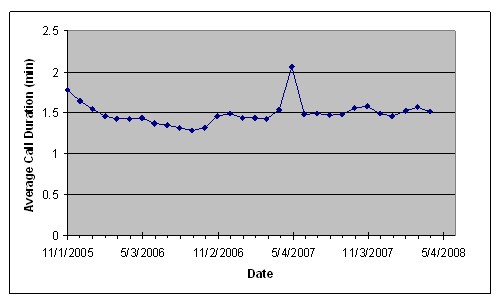
Figure 119. The Average Duration of Statewide 511 Calls
The evolution of the call duration profiles is depicted in Figure 120.
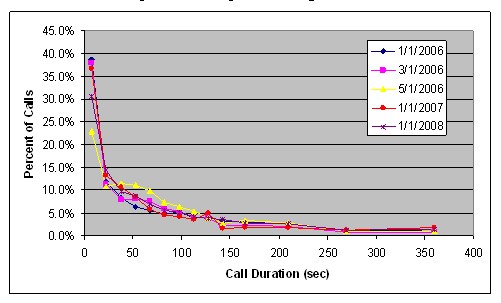
Figure 120. Distribution of Statewide 511 Call Durations
The large number of calls with short duration was likely related to ways callers made use of the Statewide 511 system, as explored in the next section.
10.6.3. Information Requested from the Statewide 511 System
The Statewide 511 system, like the Central Florida 511 systems, could provide traveler information for many different roads across the State. Figure 121 depicts the average number of Statewide 511 requests per day by the type of road for which the request was made for each month from January 2006 through April 2008. As with the Central Florida 511 system, most requests were concentrated on the Interstate Highways, particularly I-75 and I-95. In most months, requests for information on these two Interstate Highways accounted for more than 70 percent of Statewide 511 requests. The two primary exceptions occurred in May 2007 and January 2008 when brush fires caused closures of other state roads.
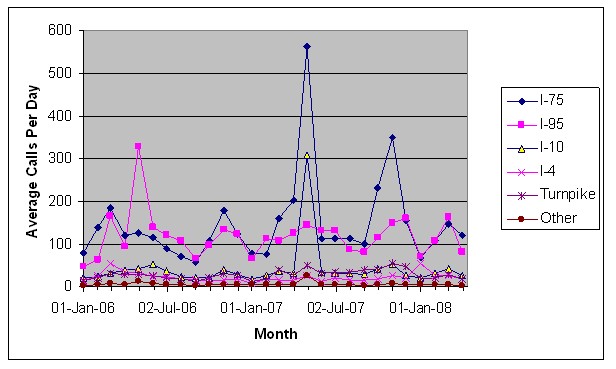
Figure 121. Average Number of Statewide 511 Requests Per Day by Type of Road
| In most months, relatively few callers requested traffic information from the Statewide 511 system. |
All in all, there were few requests for traveler information from the Statewide 511 system. In part, this was because fewer calls were made to the Statewide 511 system relative to the Central Florida 511 system; the former system averaged about 1,000 calls per day while the latter averaged more than 3,000 calls per day. Other reasons were that many Statewide 511 callers did not request any information from the system when they called and other callers used the Statewide 511 system primarily as a gateway to other 511 systems (see Figure 122).
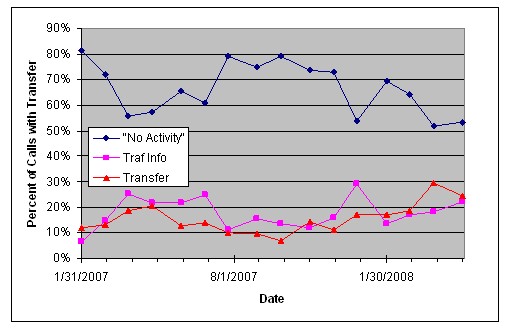
Figure 122. Caller Activity for Statewide 511 Calls
As indicated, most Statewide 511 callers did not receive any information from the system, either because they hung up without requesting any information or the system could not interpret the requests made by the callers. Among the remaining callers, about as many requested transfers to another traveler information system as requested traveler information from the Statewide 511 system. (For comparison, nearly two-thirds of Central Florida 511 callers obtained traveler information and only about 8 percent requested transfers to another traveler information system.)
10.6.4. Usage Patterns of Statewide 511 Users
As shown in Figure 123, which considers calls made during the week of March 9, 2008, most users (77 percent) called the Statewide 511 system only once per week. As with the Central Florida 511 system, about 10 percent of users (251 users) made more than two calls per week. The average number of calls per user during the week was 1.5.
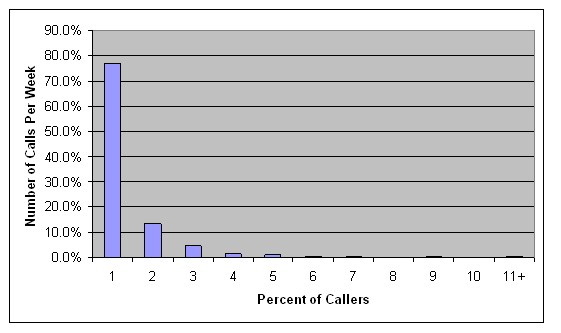
Figure 123. Number of Calls Per Week for Statewide 511 Users, 3/9/2008 to 3/15/2008
This pattern of infrequent use is also supported by Figure 124, which depicts the number of callers according to the number of days called during the week (for the week of March 9, 2008). Just over 90 percent of callers called on only a single day that week, with 215 callers (almost 6 percent) making calls on two or more different days. The usage frequency for users of the Statewide 511 system was very similar to that of Central Florida 511 users.
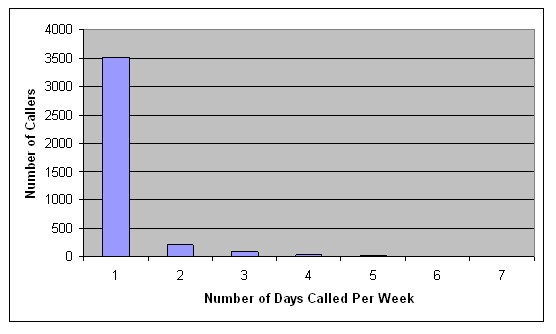
Figure 124. Number of Days Called per Week for Statewide 511 Users
Of those who were frequent users during any week, most were not frequent users in the following week. The next two charts provide information about users that frequently called the Statewide 511 system. For this analysis, two definitions of frequent callers were used. In Figure 125, a frequent caller was defined as a user that called the 511 system at least three times in a week and called it on at least two different days. In Figure 126, a frequent caller called at least 4 times on at least three different days. (Section 10.4.4 includes a description of how to interpret this type of chart.)
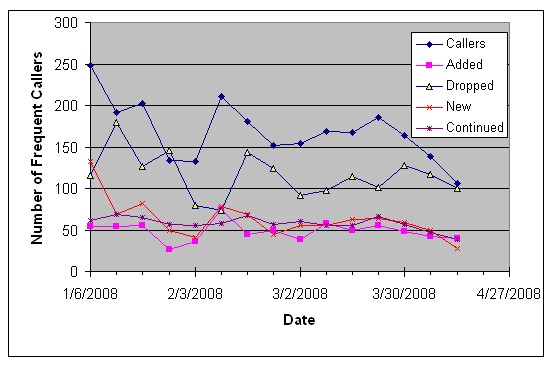
Figure 125. Frequent Statewide 511 Callers, Those Making 3 Calls Per Week on 2 Different Days
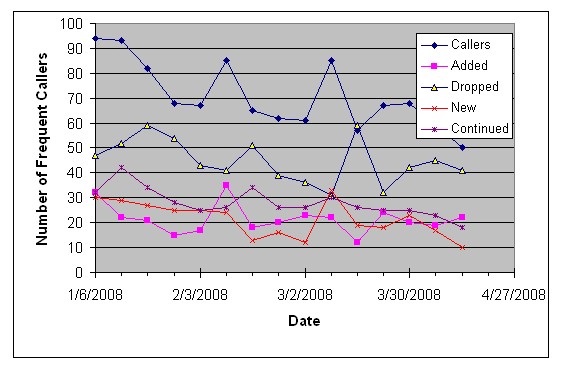
Figure 126. Frequent Statewide 511 Callers, Those Making 4 Calls Per Week on 3 Different Days
If the 511 system was attracting callers to use the system frequently and consistently, one would expect the "callers" line to increase over time, the "continued" line to be nearly as large as the "callers" line, and the "dropped" line to be small. The fact that this is not the case indicates that the iFlorida 511 system was not good at retaining frequent callers. For the Statewide 511 system, only about 150 users called at least three times per week on two different days. (About 70 users called at least four times per week on three different days.) As with the Central Florida 511 system, the number of frequent callers was relatively small and few of these were frequent callers week after week.
10.7. The iFlorida Traveler Information Web site
The iFlorida traveler information Web site (http://www.fl511.com) was a new capability introduced by the iFlorida. (A Web site was previously available that provided travel time information for a portion of I 4, though the availability of this Web site was not advertised and it was little used.) This Web site provided six types of functionality to users:
- Statewide and Central Florida maps displayed traffic information for the roads covered by iFlorida.
- The roads were color-coded (red, yellow, or green) to indicate current traffic conditions on the road.
- Icons were placed to indicate the position of incidents (e.g., crashes, severe weather, road construction) on those roads.
- A travel time calculator estimated travel times between key intersections on the iFlorida network in Orlando.
- A web page provided links to other Web sites that provided access to still images and video from traffic cameras.
- A web page listed the messages currently displayed on DMSs managed by the CRS.
- A web paged listed information about construction activities on iFlorida roads.
- A web page provided links to other traveler information Web sites.
The look and feel of the maps in this system is depicted in Figure 127 (the statewide traveler information map) and Figure 128 (the travel time calculator map).
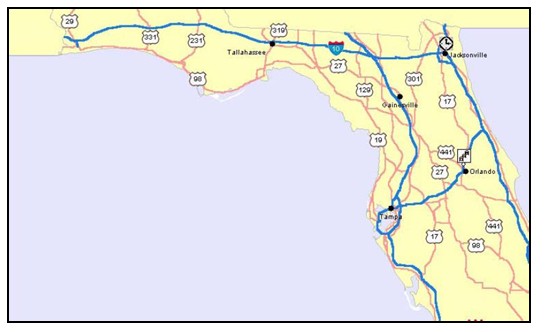
Figure 127. CRS Statewide Traveler Information Map
| Reviewing mock ups of highly graphical user interfaces, such as map interfaces, before starting development of the interface can help ensure that the resulting interface is esthetically pleasing. |
Soon after the Web component of the CRS software was released, FDOT expressed dissatisfaction with the quality of the interface. FDOT felt that the maps contained too little detail and did not allow the users enough flexibility in moving around the maps. (The maps did not allow panning and supported only two zoom levels.) FDOT staff, like many others, had come to expect map quality similar to what was available from map servers available over the Internet. The limited flexibility of these maps also caused some functional problems. For example, incident icons for closely spaced incidents could overlap, making it difficult to click on them in order to obtain additional information.
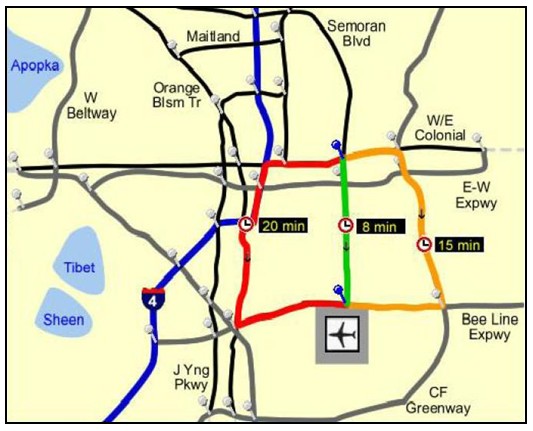
Figure 128. CRS Central Florida Travel Time Calculator Map
When FDOT replaced the CRS, the agency opted to take advantage of Google™ mapping services to support its traveler information maps. This meant that the FDOT traveler information maps included all of the same detail and capabilities as were included in Google™ map. The updated traveler information maps are depicted in Figure 129 and Figure 130. There were two benefits of leveraging these internet map server capabilities. First, the cost was low because map management features were provided at no cost by the internet map server. Second, the features and capabilities were high because they took advantage of the features of these map servers.
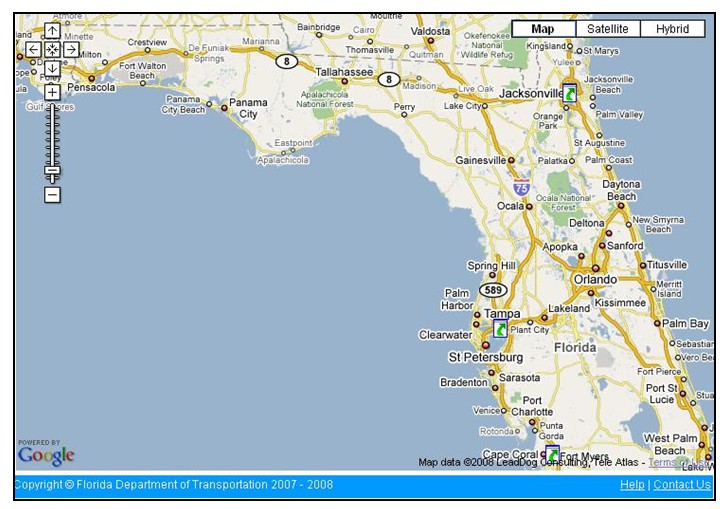
Figure 129. SunGuide Statewide Traveler Information Map
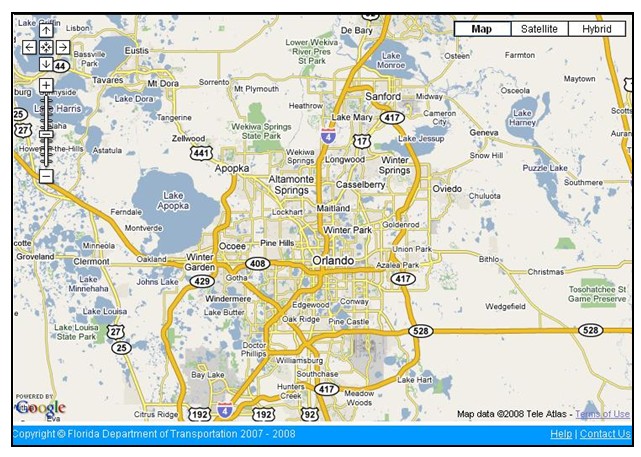
Figure 130. SunGuide Central Florida Traveler Information Map
The challenges FDOT faced with the CRS and the arterial travel time network also impacted the traveler information Web site. For example, roads on the traveler information maps were often color-coded gray because no travel time data was available and the travel time calculator sometimes suggested circuitous routes between nodes when no travel time data was available.
10.7.1. Usage of the Traveler Information Web site
The CRS requirements specified that a "usage monitoring system will provide information on CRS-Web usage patterns for different parts of the Internet Web site" and that "parameters to be tracked shall be proposed at the design stage." The CRS design document specified that Windows® Internet Information Services (IIS) would be used to provide this functionality. This decision limited the amount of information that was available about Web site usage.
| The Web site requirements should include details about the types of tracking information that should be maintained about Web site users. |
For example, IIS does not record information about individual sessions of individual users. Instead, it records information about each Web request made by the user's Web browser, and each Web page typically consists of numerous Web requests. Downloading the main iFlorida map pages involved more than 30 such requests-a main page request, 2 Java® script pages, a style sheet, 5 graphic files related to page headers and footers, 6 graphic files related to the box around the map, the map image, 6 graphic images related to tabs, and 10 icon files. In the IIS logs, the user is identified only by IP address. The same IP address may apply to multiple users, and a user during multiple sessions will likely have the same IP address. All of these factors together limit the information that can be gleaned from IIS logs regarding Web site usage.
The evaluation team used the following approach to estimate from the IIS logs information about the number of users and the number of times users accessed the Web site. Each IP address that accessed the Web site was treated as a separate user. Once a user accessed the Web site, all additional requests from the same IP address were treated as a single session until ten minutes had elapsed between requests from this IP address. The next request, if any, from the same IP address was treated as a new session from the same user.
Figure 131 depicts the average number of users and sessions per day (averaged over 1-month periods), where users and sessions were defined via the methods above. For the year 2006, this indicates that around 620 users per day generated about 1,500 visits per day to the iFlorida traveler information Web site, for about 2.4 visits per day per user. For comparison, users of the Central Florida and Statewide 511 systems called about 4,000 times per day. More people used the 511 systems, though users of the traveler information Web site visited it more often each day. The peak usage occurred during the brush fires in May 2006.
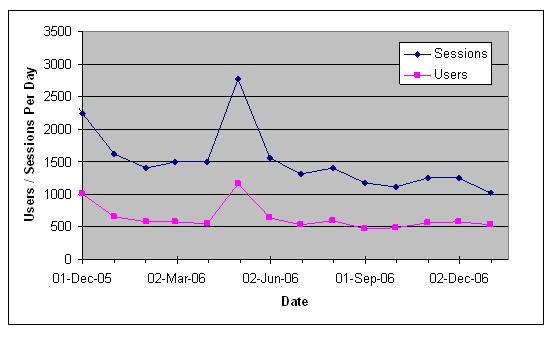
Figure 131. Average Number of iFlorida Web site Users and Sessions per Day
Most of these users had only one session per week, as shown in Figure 132, though a small number of users had a very large number of sessions per week.
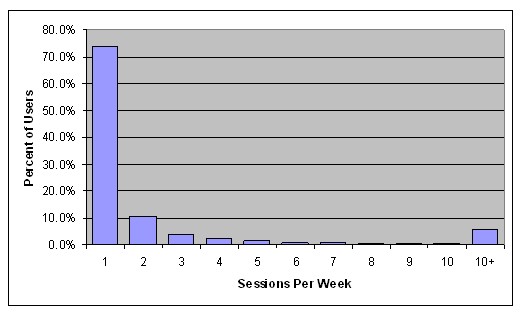
Figure 132. Number of Sessions per Week for iFlorida Web site Users
The number Web site sessions varied little from day to day (see Figure 133).

Figure 133. Average Number of iFlorida Web site Sessions by Day of the Week
The Web site usage throughout the day, as shown in Figure 134, was more evenly distributed than 511 usage (compare to Figure 97).
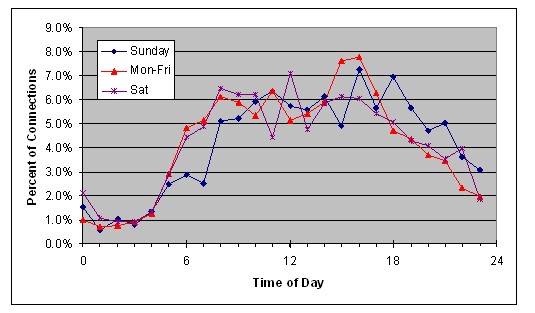
Figure 134. Percentage of iFlorida Web site Sessions by Time of Day
Figure 135 shows that the number of sessions per day varied from day to day, with the number of sessions on most days clustering about the mean of 1,500 per day, but with a cluster of high-usage days. This is similar to the distribution observed for 511 calls.
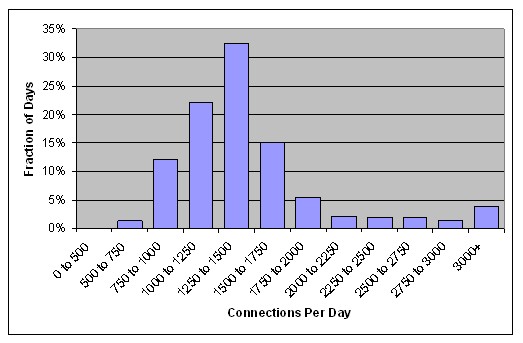
Figure 135. Fraction of Days by Number of Sessions
10.8. Other Sources of Traveler Information
The traffic data gathered by FDOT to support its own traveler information services also found its way to other organizations that provided traffic information to the public. Local television stations used FDOT traffic video in their news reports, and local radio stations began to broadcast more detailed traffic reports. One television station began to offer automated email or text message alerts to registered users so they could obtain customized traffic information along a specified route at a specific time of day. National providers of traffic information, such as Traffic.com, Google™ , MSN™, and others, obtained FDOT traffic information and made that data available to their users. Thus, iFlorida traffic information was available to the public through a number of services outside of those specifically provided by FDOT.
| Traffic data collected by FDOT was the basis for traveler information services provided by both regional and national traffic information providers. |
10.9. Summary and Conclusions
By one measure, the iFlorida traveler information operations were a significant success. An extensive network of traffic monitoring equipment was deployed and used to provide traveler information via 511, the Internet, and electronic signs. Taken together, the Central Florida and Statewide 511 systems received about 4,000 calls per day, and the Web site received more than 1,000 visits per day. That represented nearly 2 million visits to the iFlorida 511 and Internet traveler information services per year. This data was also picked up by both local media and national distributors of traffic information, so traveler information reached the public through both public-sector (i.e., 511 and the iFlorida Web site) and private-sector channels.
Other measures pointed out some of the limitations of the iFlorida traveler information operations. A sharp decline in the number of Central Florida 511 calls occurred soon after FDOT made the transition to the new 511 system, and the growth rate in the number of callers for the new system appeared to be lower than the growth rate before iFlorida was deployed. In fact, the number of 511 requests for traffic information on I-4 continued to decline throughout the observation period, with this decline offset by additional requests for information on I-95 as traffic monitoring systems for I 95 was brought online. Only about 20 percent of the traffic information requests were for toll roads or arterials, the two other types of roads for which traffic information was available after iFlorida. Because of the large increase in the scope of roads covered by the 511 system, an increase in 511 usage was expected. This did not occur.
A more detailed analysis indicated that there were few 511 callers who regularly used the system for pre-trip planning. During a typical week, less than 300 users of the Central Florida 511 system made at least 4 calls during the week on at least three different days-a frequency that might indicate they were regularly using the system for trip planning. Of these 300 frequent 511 users, most did not qualify as frequent users during the following week. Instead of proactively using the 511 system for trip planning, it appeared that the system was being used reactively to obtain information about unusual traffic conditions that were observed once a traveler was on the road. This supposition was further supported by the observation that high 511 call volumes tended to occur in conjunction with incidents that occurred and that the fraction of calls made from cell phones increased when 511 call volumes were high.
One counter example to this general pattern occurred in May 2006 when brush fires caused numerous road closures in Central Florida. In that case, high call volumes occurred without a corresponding increase in the fraction of calls that were from cell phones, suggesting that travelers were using 511 to determine if roads were closed before departing. Even in this case, callers were using 511 in a reactive manner-already aware that brush fires were causing road closures, travelers were apparently calling 511 to determine if specific roads were closed to help them plan their trips.
This observation may be important in two ways. First, it could impact the type of information that will be most beneficial to 511 callers. If most callers were using the system proactively to determine the best route to take before departing, the system messages should focus on route travel times. If most callers were using the system reactively to obtain more information about known problems and determine how to respond to them, the system messages should provide more detailed information about specific problems and, perhaps, suggest alternate routes around them.
Second, it could impact how the expected benefits of a 511 system should be estimated. One approach that has been used to estimate 511 benefits is to estimate travel time savings that a caller might experience if he or she regularly used the system to determine the best departure time for a trip and/or the best route to take. An underlying assumption of this approach is that travelers would call the 511 system regularly as part of their trip planning process. Observations during this evaluation identified few such 511 users. If most 511 users call only after becoming aware of-and possibly enter a queue related to-a traffic problem, then the benefits of the 511 system will be related to how well the system allows users to circumvent traffic problems once on the road rather than how well it helps them plan trips ahead of time. Perhaps the 511 system should even be tailored more towards such users, providing more information specifically designed to help travelers approaching incident-induced congestion. For example, the system could provide information about the location of the incident, where congestion ends, the expected time-extent of the congestion, suggested detour routes, etc.
Other observations made in evaluating the iFlorida traveler information operations are summarized in the following list:
- Few callers took advantage of traveler information available for Orlando arterials and toll roads. About 80 percent of the requests for traffic information from the Central Florida 511 system were for I-4 and I-95, with requests for information on toll roads and arterials composing about 15 and 5 percent of calls, respectively.
- The voice recognition system was not very effective. The 511 system rejected about one in seven times the system believed a caller had uttered a command, the system rejected the command. Because most calls required the user to make several commands to reach the desired information, almost 50 percent of calls included at least one case where the system rejected a user utterance.
- Very few Central Florida 511 users could be classified as frequent users of the system. In a typical week, less than 300 users called the system at least four times during the week on at least three different days. Of the users that called frequently in a given week, less than half called frequently in the following week.
- Obtaining accurate traffic information for the Statewide 511 system was challenging. FDOT found that the Statewide Monitoring System, a system of 25 traffic monitoring sites deployed around the state, was too sparse to support Statewide 511 traffic information needs. The interface with the FHP CAD system provided useful information about incidents across the state, though this data did not always include as much information as desired for 511 (e.g., expected delay). Also, jurisdiction for responding to incidents on some parts of iFlorida roads were with other organizations, in which case information about incidents on those parts of roads might not be included in the FHP CAD system. FDOT did find that 511 users would sometimes leave comments reporting on incidents that were not included in the 511 system.
- FDOT was dissatisfied with the traveler information Web site map interface provided by the CRS contractor. When a new contractor was hired to replace the failed CRS, this contractor used Google™ mapping services to support the iFlorida traveler information Web site. (Similar capabilities are available from other internet map servers.) This meant that the iFlorida Web site traveler information maps included all of the capabilities of Google Maps™.
Based on FDOT's observed experiences with traveler information operations during the iFlorida deployment, the following lessons can be derived for the benefit of other users who wish to implement or modify a 511 system:
- Plan for maintaining the 511 system when other equipment fails. Early in the iFlorida deployment, equipment failures meant that travel time measurements were often unavailable for arterials, in which case the system explicitly stated that fact. At times, a caller was presented with up to four successive "The travel time from A to B is unavailable" messages. Later, FDOT modified the system so that it would simply omit segments for which travel times were unavailable.
- Plan for maintaining the 511 system when other systems fail. When the CRS failed, it eliminated FDOT's tool for maintaining 511 messages. Because File Transfer Protocol (FTP) was used to transmit those messages to the 511 service provider, FDOT could manually use FTP to manage the 511 messages. This allowed the agency to continue to provide the 511 service while replacement software for the CRS was being developed
- Consider the needs of existing users when changing the 511 menu structure. FDOT received a number of complaints from existing 511 users about the new menu structure when it first released the new 511 system. These complaints might have been avoided if FDOT had continued to support the old menu structure while providing access to new features via new menus.
- Monitor user feedback for suggestions on how to improve the 511 service. Early feedback on the iFlorida 511 system indicated callers were dissatisfied with the complexity of the menu structure. Callers also sometimes reported on specific commands that were not understood by the system. Monitoring this feedback helped FDOT identify the need to simplify the menu structure and to add additional words to the lexicon of commands understood by the system.
- Allowing callers to customize their 511 requests resulted in more efficient 511 calls. My Florida 511 users required fewer commands to access traffic information and obtained traffic information more quickly than other 511 users.
- Document specific requirements for the types of tracking information that should be maintained about Web site users. The requirements for the iFlorida Web site included very general requirements for tracking Web site usage. The approach used by the CRS contractor for tracking Web site usage, IIS log files, limited the level of detail with which this Web site usage could be tracked.
In addition to identifying these lessons, the evaluation team developed a number of metrics for assessing iFlorida traveler information operations. This metrics, listed below, may be useful for other organizations in monitoring the performance of their 511 systems.
- Number of 511 calls and Web site sessions per day.
- Peak number of simultaneous calls and Web site sessions.
- Number of requests for specific types of traveler information, including transfers to other traveler information service providers.
- Average duration of 511 calls, the time require to reach desired traveler information, the percent of users that receive traveler information, and the percent of call time during which a caller is receiving traveler information, along with analogous measures for Web site usage.
- The number of frequent callers and the percentage of calls they generate.
- The number of incident-related calls.
- The percentage of user utterances that are rejected by the system and the percentage of calls that include rejected utterances. (The evaluation team noted several other measures related to the effectiveness of the speech recognition system, but did not compute them for this evaluation. Among those measures were the percentage of user utterances that are misunderstood by the system and the percentage of user utterances rejected or misunderstood broken out by the user's position in the call tree.)
1 iFlorida Evaluation Telephone Survey, prepared for FDOT in March 2005.
2 Respondents were allowed to indicate more than one source of traffic information, so the percentages do not sum to 100 percent.
3 Section 10.4.4 contains results on frequent users gathered from 511 call logs that indicated few 511 callers were frequent 511 users. This likely resulted from a difference in how the term "frequent user" was interpreted. In section 10.4.4, a frequent user was defined as one that called the 511 system several days per week. These two results can be reconciled if those surveyed considered frequent usage to refer to lower levels of 511 usage.
4 The usage spike in May 2006 was related to a series of large fires that resulted in many road closures. This topic will be addressed later in this report.
5 iFlorida Evaluation Telephone Survey, March 2005.
6 A Gamma distribution fit to this data had a mean of 2,579 and a standard deviation of 742.
7 Central Florida Commuter Rail Transit Environmental Assessment, March 2007. Analysis of FDOT data performed for this evaluation estimated about 7.5 million average daily vehicle miles traveled for the portion of I-4 covered by the Central Florida 511 system. If the average trip length were about 4.9 miles, the two estimates would agree exactly. The vehicle miles traveled data indicates 1.53 million is a reasonable estimate for the daily number of trips.
8 Because this identifier was based on the caller's phone number, it did not in all cases uniquely identify a caller. If a single caller makes 511 calls from several different phones, the analysis that follows will treat the calls from each phone as a different caller. If multiple callers make calls through a private branch exchange (PBX), all of the calls may appear to originate from a single phone number and will be treated as a single caller in the analysis that follows.
9 The evaluation team noted that the addition of a large number of synonyms could have both positive and negative impacts on the effectiveness of 511 speech recognition. Positive impacts would come about because the system might understand a wider variety of phrases used by callers to identify locations for which traffic information is desired. Negative impacts would come about because of the increased potential for a spoken phrase to match more than one phrase within the 511 system.