Appendix A. Toll Tag Reader Level of Service
This appendix presents information about the level of service of the toll tag readers. During iFlorida operations, three types of failures affected toll tag reader operations: (1) a reader produced fewer toll tag reads than expected, (2) a reader did not provide the toll tag information to the toll tag server in a timely manner, and (3) the clock on the reader was not synchronized with the clock on the toll tag server. The first type of failure can be measured by comparing the number of reads in archived data to the expected number of reads. Because the iFlorida system did not include processes to monitor whether the toll tag reader clock was synchronized, it is difficult to differentiate between the second and third types of failure based on the archived data - both types of failure result in a discrepancy between the time when a toll tag was read and the time stamp when the toll tag server received the data. The second two types of failure can be measured together by computing the latency, which is the difference between the time when the toll tall tag server received a toll tag reading and when that reading was made. Specifically, the archived toll tag data was evaluated to compute the following two measures:
- The number of reads generated by each reader was reviewed and a normal range established for each day of the week. A Level of Service for Tag Reads (LOSReads) was assigned as follows. If the number of reads is above the minimum of the normal range, then LOSReads was set to 1. Otherwise, the following formula was applied.
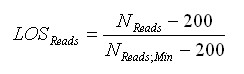
In this formula, NReads is the number of reads at the reader and NReads;Min is the minimum of the normal range. This formula provides a measure of whether the reader was generating as many reads as usual and enough to support travel time operations. A value of 0 indicated that the reader was generating less than 200 reads per day – deemed insufficient for real-time travel time estimation. A value of 1 indicated that the reader was operating normally and generating as many reads per day as usual. Values in between indicated that the reader was generating fewer than the usual number of reads per day.
- The latency of the reads was examined and a Level of Service for Latency (LOSLatency) was assigned as follows. If the average latency was less than 2 minutes or the number of reads with a latency of less then 2 minutes was greater than the minimum of the normal range for the number of reads, then LOSLatency was set to 1. If the average latency (Lavg) was greater than 20 minutes, then LOSLatency was set to 0. Otherwise, the following formula was used:
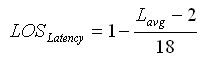
A value of 0 indicated that the reader lag time 12 greater than 20 minutes - deemed insufficient for real-time travel time estimation. A value of 1 indicated that the reader was operating with a lag of less than 2 minutes. Values in between indicted that the reader lag was between 2 and 20 minutes, with smaller numbers indicating a longer lag.
A Reader Level of Service (LOSReader) measure was computed as the product of these two measures. If LOSReader is 1, it indicates that the number of reads is operating at least as well as expected. (For example, the number of reads is within the expected range and the average latency is less than 2 minutes.) Lower levels of service occur if the reader is not producing as many reads as expected (i.e., LOS is less than 1) or the reads do not arrive at the toll tag server in a timely manner, so are not useful for computing real-time travel times.
The above definitions define daily measures of the level of service of a toll tag reader. The level of service over a period of time is computed as the average level of service for the days in that period. The level of service for a collection of readers is defined as the average level of service across those readers.
Another factor that affected the performance of the system was the number of duplicate reads that occurred at a toll tag reader. (For the purpose of this assessment, a duplicate read is defined as one where the toll tag read matches another tag read at the same reader in the previous five minutes.) The percent of duplicate reads (i.e., the number of duplicate reads divided by the total number of reads) was also computed.
The fact that the number of toll tag reads varies throughout the day can also impact the effectiveness of a toll tag reader in supporting travel time operations. For example, a reader that produces a large number of reads per hour during peak hours may produce very few reads during off-peak hours. Two measures of this factor were produced. The peaking minimum (PeakMin) was the ratio of the number of reads that occurred during the hour when the fewest reads were made to the average hourly reads per day. The peaking maximum (PeakMax) was the ratio of the number of reads that occurred during the hour when the most reads were made to the average hourly reads per day.
The following measures were used to summarize the operational performance of each toll tag reader.
- The normal range of reads per day for weekdays, Saturdays, and Sundays.
- The average number of reads per day for weekdays, Saturdays, and Sundays, with the average taken over all days for which the number of reads per day was in the normal range.
- The percentage of reads that were duplicates, with the percentage computed over all days for which the number of reads per day was in the normal range.
- The average values for PeakMin and PeakMax, where the average was taken over all days for which the number of reads per day was in the normal range.
- The average LOSReads and the percentage of days for which the LOSReads was above 0.8, 0.9, and 0.95.
- The average LOSLatency and the percentage of days for which the LOSLatency was above 0.8, 0.9, and 0.95.
- The average LOSReader and the percentage of days for which the LOSReader was above 0.8, 0.9, and 0.95.
- The number and percentage of months for which LOSReader is above 0.8, 0.9, and 0.95 and the average level of service.
Because of the strong difference in the level of service before and after the readers studied in the previous section began operating reliably in January 2007, two different sets of these measures were used to differentiate between the average level of service that was found for a reader and the level of service that was found once the reader began reliable operations. To do this, the first month for which the average level of service was above 0.9 was identified and called the First Month of Reliable Service. Each of the measures listed above was computed for the first eight months of 2007 and for the entire time after the First Month of Reliable Service (FMORS).
The following tables list the level of service measures for each of the iFlorida toll tag readers, with each table listing values for readers on a specific road. The first column of the table identifies the reader location, the first month of reliable service for that reader, and the peaking minimum and maximum. The next two columns list the normal range for the number of reads per day for Sundays only, Weekdays only, and Saturdays only, as well as the percent of the reads that were duplicates. The last seven columns list information about the reader level of service, with the first of these columns indicating the type of data on each row, the next three columns listing level of service information for the period from 1/1/2007 to 8/31/2007, and the final three columns listing level of service information for the period from the first month of reliable service to 8/31/2007. The first row in these columns lists the average level of service for these periods, with the other three rows listing the percentage of days for which the level of service was equal to or above 0.5, 0.9, and 1.0, respectively.
| Reader (FMORS) (PeakMin/PeakMax) | Normal Range of Operations | Level of Service | |||||||
|---|---|---|---|---|---|---|---|---|---|
| Category | Tag Reads | Category | 1/1/2007 to 8/31/2007 | Since Reliable | |||||
| LOSReads | LOSLatency | LOSReader | LOSReads | LOSLatency | LOSReader | ||||
| SR 50 @ SR 91 East (February) (0.05 / 2.17) | Sunday | 7,900 to 10,900 | Average | 0.95 | 0.97 | 0.95 | 0.89 | 0.93 | 0.89 |
| SR 50 @ SR 91 East (February) (0.05 / 2.17) | Weekdays | 7,900 to 10,900 | >0.5 | 96% | 97% | 96% | 90% | 93% | 90% |
| SR 50 @ SR 91 East (February) (0.05 / 2.17) | Saturday | 7,900 to 10,900 | >0.9 | 94% | 97% | 94% | 86% | 93% | 86% |
| SR 50 @ SR 91 East (February) (0.05 / 2.17) | Duplicates | 4.50% | 1 | 94% | 97% | 94% | 83% | 93% | 83% |
| SR 50 @ SR 429 East (January 2006) (0.07 / 2.63) | Sunday | 500 to 3,500 | Average | 0.97 | 1 | 0.97 | 0.84 | 0.86 | 0.84 |
| SR 50 @ SR 429 East (January 2006) (0.07 / 2.63) | Weekdays | 500 to 4,400 | >0.5 | 97% | 100% | 97% | 84% | 86% | 84% |
| SR 50 @ SR 429 East (January 2006) (0.07 / 2.63) | Saturday | 500 to 4,500 | >0.9 | 93% | 100% | 93% | 83% | 86% | 83% |
| SR 50 @ SR 429 East (January 2006) (0.07 / 2.63) | Duplicates | 14.40% | 1 | 92% | 100% | 92% | 82% | 86% | 82% |
| SR 50 @ SR 408 Exit 1 East (January 2006) (0.05 / 2.17) | Sunday | 7,900 to 10,900 | Average | 0.7 | 0.71 | 0.7 | 0.81 | 0.84 | 0.81 |
| SR 50 @ SR 408 Exit 1 East (January 2006) (0.05 / 2.17) | Weekdays | 7,900 to 10,900 | >0.5 | 70% | 71% | 70% | 80% | 84% | 80% |
| SR 50 @ SR 408 Exit 1 East (January 2006) (0.05 / 2.17) | Saturday | 7,900 to 10,900 | >0.9 | 69% | 71% | 69% | 78% | 84% | 78% |
| SR 50 @ SR 408 Exit 1 East (January 2006) (0.05 / 2.17) | Duplicates | 8.20% | 1 | 69% | 71% | 69% | 78% | 84% | 78% |
| SR 50 @ SR 423 East (January 2006) (0.07 / 2.27) | Sunday | 1,000 to 3,000 | Average | 0.95 | 0.97 | 0.95 | 0.94 | 0.98 | 0.94 |
| SR 50 @ SR 423 East (January 2006) (0.07 / 2.27) | Weekdays | 2,300 to 3,900 | >0.5 | 95% | 97% | 95% | 94% | 98% | 94% |
| SR 50 @ SR 423 East (January 2006) (0.07 / 2.27) | Saturday | 1,500 to 4,500 | >0.9 | 94% | 97% | 94% | 90% | 98% | 90% |
| SR 50 @ SR 423 East (January 2006) (0.07 / 2.27) | Duplicates | 7.20% | 1 | 94% | 97% | 94% | 90% | 98% | 90% |
| SR 50 @ US 441 East (January 2006) (0.10 / 1.95) | Sunday | 1,000 to 2,500 | Average | 0.95 | 0.97 | 0.95 | 0.78 | 0.87 | 0.78 |
| SR 50 @ US 441 East (January 2006) (0.10 / 1.95) | Weekdays | 4,300 to 5,900 | >0.5 | 95% | 97% | 95% | 78% | 87% | 78% |
| SR 50 @ US 441 East (January 2006) (0.10 / 1.95) | Saturday | 2,000 to 3,000 | >0.9 | 94% | 97% | 94% | 71% | 87% | 71% |
| SR 50 @ US 441 East (January 2006) (0.10 / 1.95) | Duplicates | 12.40% | 1 | 82% | 97% | 82% | 64% | 87% | 64% |
| SR 50 @ I-4 East (January 2006) (0.14 / 1.87) | Sunday | 2,000 to 4,000 | Average | 0.95 | 0.97 | 0.95 | 0.79 | 0.84 | 0.79 |
| SR 50 @ I-4 East (January 2006) (0.14 / 1.87) | Weekdays | 5,400 to 7,400 | >0.5 | 96% | 97% | 96% | 79% | 84% | 79% |
| SR 50 @ I-4 East (January 2006) (0.14 / 1.87) | Saturday | 3,500 to 5,500 | >0.9 | 94% | 97% | 94% | 75% | 84% | 75% |
| SR 50 @ I-4 East (January 2006) (0.14 / 1.87) | Duplicates | 5.50% | 1 | 94% | 97% | 94% | 68% | 84% | 68% |
| SR 50 @ US 17/92 East (April 2006) (0.12 / 1.98) | Sunday | 4,800 to 6,500 | Average | 0.92 | 0.95 | 0.92 | 0.65 | 0.81 | 0.65 |
| SR 50 @ US 17/92 East (April 2006) (0.12 / 1.98) | Weekdays | 4,800 to 6,500 | >0.5 | 93% | 95% | 93% | 64% | 81% | 64% |
| SR 50 @ US 17/92 East (April 2006) (0.12 / 1.98) | Saturday | 4,800 to 6,500 | >0.9 | 90% | 95% | 90% | 59% | 81% | 59% |
| SR 50 @ US 17/92 East (April 2006) (0.12 / 1.98) | Duplicates | 11.70% | 1 | 80% | 95% | 80% | 52% | 81% | 52% |
| SR 50 @ SR 436 East (February 2006) (0.09 / 2.07) | Sunday | 7,900 to 10,900 | Average | 0.98 | 1 | 0.98 | 0.9 | 0.94 | 0.9 |
| SR 50 @ SR 436 East (February 2006) (0.09 / 2.07) | Weekdays | 7,900 to 10,900 | >0.5 | 98% | 100% | 98% | 89% | 94% | 89% |
| SR 50 @ SR 436 East (February 2006) (0.09 / 2.07) | Saturday | 7,900 to 10,900 | >0.9 | 97% | 100% | 97% | 86% | 94% | 86% |
| SR 50 @ SR 436 East (February 2006) (0.09 / 2.07) | Duplicates | 5.50% | 1 | 95% | 100% | 95% | 80% | 94% | 80% |
| SR 50 @ SR 417 East (March 2006) (0.09 / 2.06) | Sunday | 1,500 to 3,000 | Average | 0.97 | 1 | 0.97 | 0.94 | 0.99 | 0.93 |
| SR 50 @ SR 417 East (March 2006) (0.09 / 2.06) | Weekdays | 2,000 to 6,000 | >0.5 | 98% | 100% | 98% | 96% | 99% | 96% |
| SR 50 @ SR 417 East (March 2006) (0.09 / 2.06) | Saturday | 3,000 to 5,500 | >0.9 | 93% | 100% | 93% | 85% | 99% | 84% |
| SR 50 @ SR 417 East (March 2006) (0.09 / 2.06) | Duplicates | 5.40% | 1 | 93% | 100% | 93% | 80% | 99% | 80% |
| SR 50 @ SR 408 (Exit 23) East (January 2006) (0.10 / 2.17) | Sunday | 2,000 to 5,000 | Average | 0.96 | 0.98 | 0.96 | 0.95 | 0.97 | 0.95 |
| SR 50 @ SR 408 (Exit 23) East (January 2006) (0.10 / 2.17) | Weekdays | 2,200 to 6,000 | >0.5 | 95% | 98% | 95% | 96% | 97% | 95% |
| SR 50 @ SR 408 (Exit 23) East (January 2006) (0.10 / 2.17) | Saturday | 2,000 to 5,500 | >0.9 | 95% | 98% | 95% | 93% | 97% | 93% |
| SR 50 @ SR 408 (Exit 23) East (January 2006) (0.10 / 2.17) | Duplicates | 2.00% | 1 | 95% | 98% | 95% | 92% | 97% | 92% |
| SR 50 @ SR 408 (Exit 23) West (February 2006) (0.09 / 2.26) | Sunday | 8,000 to 10,000 | Average | 0.98 | 0.99 | 0.98 | 0.87 | 0.91 | 0.87 |
| SR 50 @ SR 408 (Exit 23) West (February 2006) (0.09 / 2.26) | Weekdays | 11,100 to 13,700 | >0.5 | 98% | 99% | 98% | 88% | 91% | 88% |
| SR 50 @ SR 408 (Exit 23) West (February 2006) (0.09 / 2.26) | Saturday | 10,000 to 12,500 | >0.9 | 96% | 99% | 96% | 83% | 91% | 83% |
| SR 50 @ SR 408 (Exit 23) West (February 2006) (0.09 / 2.26) | Duplicates | 2.60% | 1 | 94% | 99% | 94% | 58% | 91% | 58% |
| SR 50 @ SR 417 West (September 2006) (0.07 / 2.25) | Sunday | 2,500 to 4,000 | Average | 0.77 | 0.88 | 0.77 | 0.75 | 0.87 | 0.75 |
| SR 50 @ SR 417 West (September 2006) (0.07 / 2.25) | Weekdays | 2,600 to 5,500 | >0.5 | 77% | 88% | 77% | 78% | 87% | 78% |
| SR 50 @ SR 417 West (September 2006) (0.07 / 2.25) | Saturday | 3,000 to 5,000 | >0.9 | 72% | 88% | 72% | 63% | 87% | 63% |
| SR 50 @ SR 417 West (September 2006) (0.07 / 2.25) | Duplicates | 0.80% | 1 | 72% | 88% | 72% | 61% | 87% | 61% |
| SR 50 @ SR 436 West (February 2006) (0.06 / 2.44) | Sunday | 2,000 to 3,500 | Average | 0.73 | 0.97 | 0.73 | 0.81 | 0.93 | 0.81 |
| SR 50 @ SR 436 West (February 2006) (0.06 / 2.44) | Weekdays | 3,800 to 5,700 | >0.5 | 62% | 97% | 62% | 77% | 93% | 77% |
| SR 50 @ SR 436 West (February 2006) (0.06 / 2.44) | Saturday | 3,000 to 5,000 | >0.9 | >61% | >97% | >61% | 73% | 93% | 73% |
| SR 50 @ SR 436 West (February 2006) (0.06 / 2.44) | Duplicates | 0.20% | 1 | 61% | 97% | 61% | 67% | 93% | 67% |
| SR 50 @ US 17/92 West (March 2006) (0.11 / 2.19) | Sunday | 2,500 to 5,000 | Average | 0.94 | 0.96 | 0.94 | 0.83 | 0.91 | 0.83 |
| SR 50 @ US 17/92 West (March 2006) (0.11 / 2.19) | Weekdays | 5,200 to 7,500 | >0.5 | 94% | 96% | 94% | 84% | 91% | 84% |
| SR 50 @ US 17/92 West (March 2006) (0.11 / 2.19) | Saturday | 3,500 to 6,000 | >0.9 | 92% | 96% | 92% | 74% | 91% | 74% |
| SR 50 @ US 17/92 West (March 2006) (0.11 / 2.19) | Duplicates | 9.20% | 1 | 91% | 96% | 91% | 66% | 91% | 66% |
| SR 50 @ I-4 West (January 2006) (0.13 / 1.91) | Sunday | 1,000 to 3,000 | Average | 0.89 | 0.92 | 0.89 | 0.85 | 0.88 | 0.85 |
| SR 50 @ I-4 West (January 2006) (0.13 / 1.91) | Weekdays | 2,000 to 3,500 | >0.5 | 89% | 92% | 89% | 85% | 88% | 85% |
| SR 50 @ I-4 West (January 2006) (0.13 / 1.91) | Saturday | 1,500 to 3,000 | >0.9 | 89% | 92% | 89% | 82% | 88% | 82% |
| SR 50 @ I-4 West (January 2006) (0.13 / 1.91) | Duplicates | 8.70% | 1 | 89% | 92% | 89% | 81% | 88% | 81% |
| SR 50 @ US 441 West (January 2006) (0.09 / 2.25) | Sunday | 4,300 to 5,900 | Average | 0.9 | 0.96 | 0.9 | 0.82 | 0.94 | 0.82 |
| SR 50 @ US 441 West (January 2006) (0.09 / 2.25) | Weekdays | 500 to 1,100 | >0.5 | 90% | 96% | 90% | 81% | 94% | 81% |
| SR 50 @ US 441 West (January 2006) (0.09 / 2.25) | Saturday | 4,300 to 5,900 | >0.9 | 88% | 96% | 88% | 80% | 94% | 80% |
| SR 50 @ US 441 West (January 2006) (0.09 / 2.25) | Duplicates | 0.40% | 1 | 88% | 96% | 88% | 80% | 94% | 80% |
| SR 50 @ SR 423 West (January 2006) (0.10 / 2.21) | Sunday | 1,000 to 3,500 | Average | 0.94 | 0.97 | 0.94 | 0.94 | 0.96 | 0.94 |
| SR 50 @ SR 423 West (January 2006) (0.10 / 2.21) | Weekdays | 1,800 to 4,700 | >0.5 | 95% | 97% | 95% | 96% | 96% | 95% |
| SR 50 @ SR 423 West (January 2006) (0.10 / 2.21) | Saturday | 1,500 to 3,500 | >0.9 | 88% | 97% | 88% | 90% | 96% | 89% |
| SR 50 @ SR 423 West (January 2006) (0.10 / 2.21) | Duplicates | 7.50% | 1 | 87% | 97% | 87% | 89% | 96% | 88% |
| SR 50 @ SR 408 Exit 1 West #N/A (0.06 / 2.12) | Sunday | 7,900 to 10,900 | Average | 0.52 | 0.7 | 0.52 | 0.69 | 0.77 | 0.69 |
| SR 50 @ SR 408 Exit 1 West #N/A (0.06 / 2.12) | Weekdays | 7,900 to 10,900 | >0.5 | 51% | 70% | 51% | 69% | 77% | 69% |
| SR 50 @ SR 408 Exit 1 West #N/A (0.06 / 2.12) | Saturday | 7,900 to 10,900 | >0.9 | 44% | 70% | 44% | 64% | 77% | 64% |
| SR 50 @ SR 408 Exit 1 West #N/A (0.06 / 2.12) | Duplicates | 1.20% | 1 | 44% | 70% | 44% | 60% | 77% | 60% |
| SR 50 @ SR 429 West (January 2006) (0.08 / 2.12) | Sunday | 4,000 to 5,500 | Average | 0.94 | 1 | 0.94 | 0.71 | 0.91 | 0.71 |
| SR 50 @ SR 429 West (January 2006) (0.08 / 2.12) | Weekdays | 6,900 to 9,400 | >0.5 | 95% | 100% | 95% | 67% | 91% | 67% |
| SR 50 @ SR 429 West (January 2006) (0.08 / 2.12) | Saturday | 5,000 to 7,000 | >0.9 | 87% | 100% | 87% | 60% | 91% | 60% |
| SR 50 @ SR 429 West (January 2006) (0.08 / 2.12) | Duplicates | 12.10% | 1 | 72% | 100% | 72% | 41% | 91% | 41% |
| SR 50 @ SR 91 West (January 2006) (0.09 / 2.59) | Sunday | 7,900 to 10,900 | Average | 0.99 | 1 | 0.99 | 0.87 | 0.89 | 0.87 |
| SR 50 @ SR 91 West (January 2006) (0.09 / 2.59) | Weekdays | 7,900 to 10,900 | >0.5 | 100% | 100% | 100% | 88% | 89% | 88% |
| SR 50 @ SR 91 West (January 2006) (0.09 / 2.59) | Saturday | 7,900 to 10,900 | >0.9 | 98% | 100% | 98% | 85% | 89% | 85% |
| SR 50 @ SR 91 West (January 2006) (0.09 / 2.59) | Duplicates | 1.50% | 1 | 96% | 100% | 96% | 81% | 89% | 81% |
The previous table provided values for the level of service of the individual toll tag readers positioned along Colonial Drive (SR 50). The following formula uses those measures to estimate a measure for the level of service of a toll tag travel time segment.
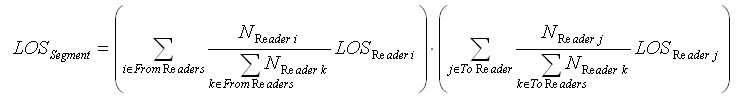
In this formula, NReader i is the average number of reads per day for Reader i, one of the readers at the from or to node for the travel time segment, and LOSReader i is the level of service for that reader, as previously defined. This formula will return a value of 1 if all of the readers associated with the segment have level of service equal to 1, a 0 if all of the readers at either the from or to node have level of service equal to 0, and otherwise return a value in between these two extremes.
The following measures of the level of service of the toll tag segments were derived from this measure:
- The average value of LOSSegment over a specified period of time. This gave an indication of the general level of operation of a segment over that period of time.
- The percentage of days for which LOSSegment was at least 0.5 over a specified period of time. This gave an indication of the fraction of time that travel times were being produced for the segment, though at a significantly reduced level of service.
- The percentage of days for which LOSSegment was at least 0.9 over a specified period of time. This gave an indication of the fraction of time that the travel time system was operating effectively for the indicated segment.
- The percentage of days for which LOSSegment was at least 1.0 over a specified period of time. This gave an indication of the fraction of time that the travel time system was operating as expected for the indicated segment.
These measures are tallied in Table 20 for two different periods of time. The period from January 1, 2007 through August 31, 2007 covers the latest period for which complete tag reader information was available to the evaluation team. During the early part of that year, the system was operating effectively, though the performance dropped of dramatically later in the year. The period from March 1, 2007 through March 31, 2007 is a period of time during which the toll tag reader was operating well.
| Travel Time Segment | January 1, 2007 thorugh August 31, 2007 | March 2007 | ||||||
|---|---|---|---|---|---|---|---|---|
| Average | Percent >0.5 | Percent >0.9 | Percent = 1.0 | Average | Percent >0.5 | Percent >0.9 | Percent = 1.0 | |
| SR 50 East from SR 91 to SR 429 | 0.93 | 93 | 89 | 88 | 1.00 | 100 | 100 | 100 |
| SR 50 East from SR 429 to SR 408 | 0.70 | 70 | 68 | 68 | 1.00 | 100 | 100 | 100 |
| SR 50 East from SR 408 to SR 423 | 0.69 | 69 | 68 | 68 | 1.00 | 100 | 100 | 100 |
| SR 50 East from SR 423 to SR 441 | 0.95 | 94 | 94 | 94 | 1.00 | 100 | 100 | 100 |
| SR 50 East from SR 441 to I-4 | 0.95 | 95 | 94 | 94 | 1.00 | 100 | 100 | 100 |
| SR 50 East from I-4 to US 17/92 | 0.95 | 94 | 94 | 87 | 1.00 | 100 | 100 | 100 |
| SR 50 East from US 17/92 to SR 436 | 0.91 | 91 | 89 | 79 | 0.87 | 87 | 84 | 81 |
| SR 50 East from SR 436 to SR 417 | 0.96 | 97 | 90 | 88 | 0.98 | 100 | 90 | 90 |
| SR 50 East from SR 417 to SR 408 | 0.94 | 95 | 90 | 90 | 0.98 | 100 | 90 | 90 |
| SR 50 West from SR 408 to SR 417 | 0.75 | 75 | 70 | 68 | 0.85 | 84 | 74 | 71 |
| SR 50 West from SR 417 to SR 436 | 0.55 | 46 | 44 | 44 | 0.30 | 10 | 10 | 10 |
| SR 50 West from SR 436 to US 17/92 | 0.69 | 58 | 57 | 55 | 0.37 | 13 | 13 | 13 |
| SR 50 West from US 17/92 to I-4 | 0.89 | 88 | 88 | 85 | 1.00 | 100 | 100 | 97 |
| SR 50 West from I-4 to SR 441 | 0.87 | 87 | 83 | 93 | 1.00 | 100 | 133 | 100 |
| SR 50 West from SR 441 to SR 423 | 0.90 | 93 | 81 | 79 | 0.99 | 100 | 97 | 90 |
| SR 50 West from SR 423 to SR 408 | 0.51 | 50 | 42 | 40 | 0.63 | 52 | 35 | 32 |
| SR 50 West from SR 408 to SR 429 | 0.52 | 50 | 44 | 41 | 0.63 | 52 | 35 | 35 |
| SR 50 West from SR 429 to SR 91 | 0.93 | 93 | 87 | 71 | 1.00 | 100 | 100 | 94 |