Traffic Analysis Toolbox Volume V:
Traffic Analysis Toolbox Case Studies – Benefits and Applications
3.0 Regional Transportation Plans and Programs
Large-scale planning efforts will clearly benefit from using the right traffic analysis tools. The questions to be answered in these efforts are basic ones: should the roadway be treated as an expressway or an arterial? How many lanes will be required? What's the best form of control for the intersections? Specially designed traffic analysis tools focus on the answers to these questions without getting lost in the costly and time-consuming details of operational and design considerations that will come later. Many such tools have been developed and can be effectively applied within the realms of sketch planning and travel demand modeling. The table below introduces two real-world case studies presented in the remainder of this chapter to demonstrate the benefits that can be achieved through the proper application of traffic analysis tools in regional transportation plans and programs.
| Type of Analysis | Real-World Case Study |
|---|---|
| 3.1 Sketch Planning | West Egan Drive Corridor Study Juneau, Alaska |
| 3.2 Travel Demand Modeling | City-Wide Transportation System Plan Tualatin, Oregon |
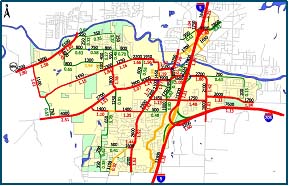
3.1 Sketch Planning Case Study – Corridor Refinement Study
Sketch planning traffic analysis tools are often used in regional transportation planning to analyze the impacts of regional growth trends on the transportation infrastructure. These tools can quickly and effectively evaluate the adequacy of roadway networks and intersections. As such, they also help in developing regional plans.
West Egan Drive Corridor Study – Juneau, AK
Key Benefits
- Clear and adequate information to formulate alternatives
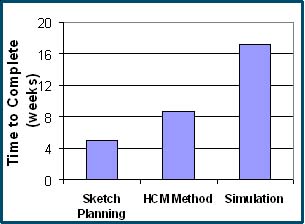
- Less engineering time required than for other types of analysis
- Equal consideration of all stakeholder proposals to be specifically considered
Other Considerations
- Output from sketch planning analysis tools should be supplemented with other more detailed analysis procedures prior to final design and implementation concept design alternatives.
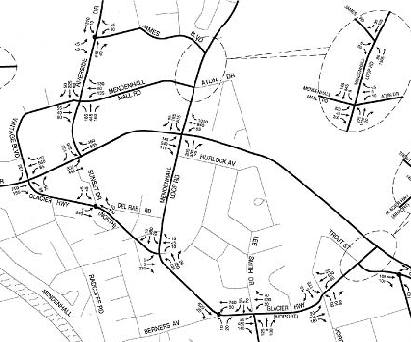
The use of the sketch planning traffic analysis tools provides basic intersection volume-to-capacity ratios and planning level intersection operational results.
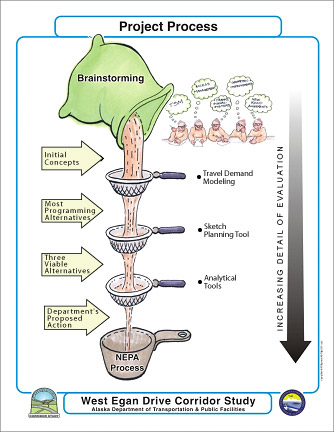
With the help of these tools, numerous alternatives can be analyzed quickly and cost effectively. This allows alternatives to be discarded early in the process, with more concentrated efforts of analysis on the most viable alternative. Hence, these traffic analysis tools ensure efficient use of limited project resources.
3.2 Travel Demand Modeling Case Study – Regional Plan Refinement
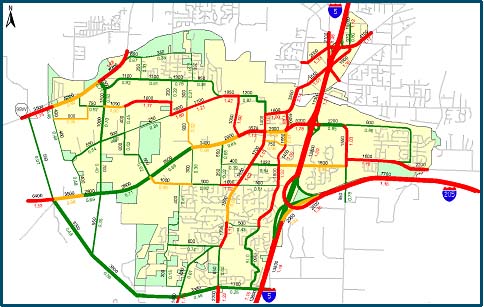
A regional travel demand model was used to help create a blueprint for the future transportation system in Tualatin, Oregon. Travel demand models are especially useful for this kind of activity because they take clear and direct account of the key factors that can be managed and controlled – population, employment, land use, and system characteristics. Alternative growth visions for the community were evaluated according to their impacts on congestion and quality of service.
Transportation System Plan (TSP) – Tualatin, OR
Key Benefits
- Predicted how Tualatin's transportation system will be affected by land use, demographics, and system improvements.
- Documented and quantified the benefits of future improvements.
Other Considerations
- This type of model should be regularly updated and calibrated.
Travel demand models can also be used to predict the traffic-related effects of alternative transportation policies and projections. Their ability to quantify the impacts of a particular policy or proposed improvement on congestion, infrastructure investment requirements, access to all modes, and quality-of-life issues can help to inform the decision-making that leads to the final adopted plan.
Travel demand models do not work at a level of detail that is sufficient to design and construct the identified improvements, but they provide the essential input other traffic analysis tools will need when the design effort is underway.
Informed decision makersTualatin's key decision-makers (City Council and Planning Commission) were kept updated through regular briefings that included colorful graphics from the travel demand model, showing the effects of various policy options on key performance measures like roadway volume and congestion levels. |