2.0 Corridor Definitions and Profiles
This section defines the corridors, identifies the sources and methods for collecting data on the corridors, and presents the profile for each corridor. The profiles discuss existing conditions and trends in demographics, economics, health resources, and education resources. In addition, this section discusses the extent of existing telecommunications backbone facilities in each corridor. The information contained in this section is a summary of a more detailed analysis contained in Task 3: Corridor Profiles document generated as part of this study.
2.a. Corridor Locations and Study Areas
Section 5507 of SAFETEA-LU identified three interstate system corridors for study. These corridors are described briefly below.
- I-20 Corridor – Interstate Highway 20 (I-20) extends 1,535 miles across the southeastern United States, from western Texas to Interstate 95 in South Carolina. This study is concerned with the 542 miles of I-20 that passes through Louisiana, Mississippi, and Alabama. The study corridor encompasses a 25-mile buffer on each side of the interstate highway.
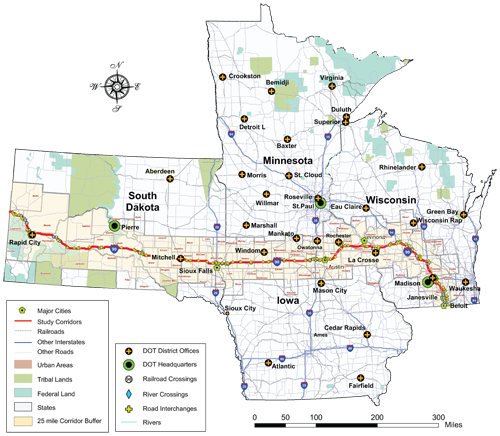
- I-90 Corridor – Interstate Highway 90 (I-90) is the northernmost east-to-west, coast-to-coast interstate highway in the United States, extending from Seattle, Washington to Boston, Massachusetts. This study focuses on the 843-mile portion of I-90 that passes through South Dakota, southern Minnesota, and central and western Wisconsin. The study corridor, which encompasses a 25-mile buffer on each side of the interstate highway, also includes portions of northern Iowa.
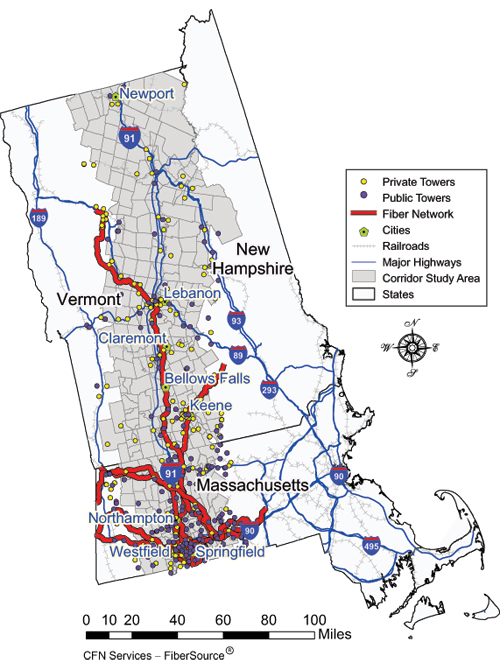
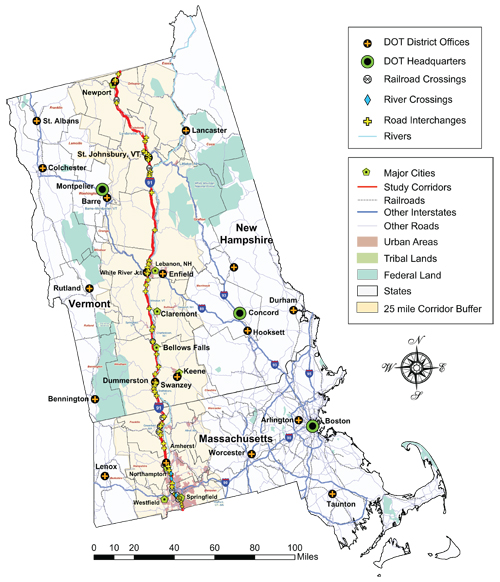
- I-91 Corridor – Interstate Highway 91 (I-91) extends from New Haven, Connecticut at Interstate 95 to Derby Line in Vermont at the Canadian border and runs north and south through the states of Connecticut, Massachusetts, and Vermont. The focus of this study is on the 242-mile portion of the corridor that spans the length of Massachusetts and Vermont. Portions of western New Hampshire also are included in the 25-mile buffer defining the corridor study area.
Study area boundaries for each corridor were established using a 25-mile buffer zone on each side of the interstate highway routes, with the boundaries of the analysis area based on census block group boundaries. This buffer zone represents the approximate area that would most stand to benefit from access to HST backbone along the interstate highway alignments. In some cases, this buffer zone included areas in neighboring states (i.e., Iowa and New Hampshire) that do not actually contain any segments of the interstate highway under consideration.
While the focus of the study is on providing HST to low-density rural areas of the country, each of the corridors also encompasses multiple urbanized areas (UZA), defined by the Census Bureau as an urban nucleus of at least 50,000 people meeting certain density thresholds. Because these urbanized areas are considered to be more likely to already be well-served by HST providers, and because the nature of benefits and needs may vary significantly for urbanized versus rural areas, statistics are presented separately for urbanized versus non-urbanized areas as well as for the corridor as a whole. (Rural portions of the corridor are defined for the purposes of this study to include what the Census defines as “urban clusters” – that is, settlements with at least 2,500 but less than 50,000 persons. See http://ers.usda.gov/Briefing/Rurality/WhatIsRural/ (accessed August 30, 2007) for a discussion of definitions of rural versus urban areas.) Nevertheless, the urbanized areas are considered an integral part of this study, given that the corridor communications technologies will integrate with existing and planned systems in these urban areas.
2.b. Data Collection and Management
The study team used a Geographic Information System (GIS) framework to facilitate the assembly, analysis, reporting, and evaluation of a wide range of information on demographics, economics, health and education resources, and land use. GIS can facilitate the integration of data across disparate sources and provide the ability to query data using both spatial and non-spatial properties. A GIS framework provides a convenient method for visualizing attributes and characteristics of the corridors in this study.
The various corridor data collected and analyzed include:
- Demographic and socioeconomic data from the 2000 U.S. Census, examined at a Census Block Group level. Key profiling indicators included race and ethnicity, age and gender distributions, income levels, educational attainment, disability status, and employment status;
- County-level year 2005 population estimates and State-level population projections through 2030 from the U.S. Bureau of the Census;
- Economic data from the 2002 U.S. Economic Census and the Bureau of Labor Statistics (BLS), including the number of businesses and total employment by industry, examined at a county level;
- Locations and population of urban centers in the corridors;
- Locations of Federal and Tribal lands;
- Locations and characteristics of institutions that are potential key telecommunications users, including hospitals, trauma centers, and other medical facilities; primary, secondary, and postsecondary schools; and libraries;
- The locations of State DOT facilities, including headquarters and district offices as well as operations centers; and
- Existing transportation and telecommunications infrastructure, including major roads, river crossings, railroads, and wireless communications towers.
Figures 7, 8, and 9 show the defined corridor areas.

2.c. I-20 Corridor
Demographics
The total population of the corridor in 2000 was 2,909,000, of which 54 percent was outside of the corridor’s urbanized areas (UZAs). The non-urban population includes 665,400 people in Alabama, 471,000 people in Mississippi, and 418,500 people in Louisiana.
Outside of the urban areas, the population density was the lowest of the three corridors, averaging 427 people per square mile. The few areas outside the UZAs where the population is higher (between 1,033 and 2,746 people per square mile) tend to be the county seat, or areas with a heavy tourism/recreation base such as Demopolis, Alabama.
Between 1990 and 2000, the corridor experienced some population increase, primarily within and near the UZAs. Population change in rural areas was variable. County population estimates for 2005 indicate that the greatest population growth is continuing to occur in proximity to UZAs.
Whites make up 63 percent of the I-20 corridor population, while Blacks represent approximately 35 percent. American Indians, Asians, and other races collectively make up less than 2 percent of the population. Approximately 1 percent of the total population in the I-20 Corridor is Hispanic (of any race). The Mississippi-Choctaw Indian Reservation is the only reservation in the corridor and has four areas of land within the Mississippi portion of the study area.
Economics
The top three industries in the I-20 Corridor by the percent of population employed are health care (14.0 percent), manufacturing (13.6 percent), and retail (13.5 percent). The portions of Alabama and Mississippi located within the corridor have a similar profile to that of the overall corridor. Health care, retail, and manufacturing industries are the top three categories, with health care industries employing the most people. The portion of Louisiana that is within the corridor does not have as much manufacturing employment as in the other two States of the corridor, and has higher employment numbers in the tourism industry. The I-20 Corridor has higher percentages of people employed in health care, retail, and manufacturing than the national average.
Unemployment rates for two States in the I-20 Corridor are the highest of the three corridors in the study. (Recent unemployment data was not available at the corridor level, so State-level data are reported.) While Alabama’s statewide rate was 4 percent in 2005, which is below the national average of 5.5 percent, rates in Louisiana and Mississippi were well above the average, at 7.1 percent and 7.9 percent, respectively. For Louisiana and Mississippi the more than two-point increase from 2000 was likely influenced by the hurricanes of 2005.
Health Resources
The I-20 Corridor includes 64 medical centers, typically clustered around the urban centers, with a few substance abuse treatment centers and uncategorized facilities located in the non-urbanized areas. Two trauma centers are located in the I-20 Corridor: one at the University of Alabama at Birmingham and one at Louisiana State University (LSU) Health Sciences Center in Shreveport. Both are Level 1 facilities. (A trauma center is a hospital equipped to perform as a casualty receiving station for the emergency medical services by providing the best possible medical care for traumatic injuries 24 hours a day, 365 days per year. There are four distinct levels of trauma care: Level 1 through Level 4. Certification as a Level 1 trauma center requires a full range of specialists and equipment available 24 hours a day, the admission of a minimum required annual volume of severely injured patients, a program of research, leadership in trauma education and injury prevention, and referral resources for communities in neighboring regions community outreach. A Level 2 trauma center works in collaboration with a Level 1 center to provide comprehensive trauma care.)
A number of telemedicine programs were identified in the I-20 Corridor. For example, LSU’s Medical Informatics and Telemedicine Program supports clinical telemedicine services for various health care providers. The program works in conjunction with the Louisiana Rural Health Access Program to improve health care access for indigent and uninsured people in rural areas. LSU also works with other medical institutions to determine where rural telemedicine services could enhance access to care and efficiency of care delivery. The University of Mississippi Medical Center (UMC) facilitates a program known as TelEmergency, which trains and places specially trained family nurse practitioners in rural emergency departments, who work under the direct clinical supervision of emergency physicians at UMC via a telemedicine video link.
Education Resources
There are 821 elementary and secondary schools located in the I-20 Corridor of which 44 percent are located outside of UZAs. There are 80 postsecondary educational institutions in the corridor, 26 located outside of UZAs. These include public schools such as the University of Alabama at Birmingham, the University of Alabama at Tuscaloosa, several campuses of the Louisiana Technical College, and the University of Mississippi at the Medical Center (Jackson, Mississippi), as well as a variety of private colleges and universities.
There are 212 libraries in the I-20 Corridor, of which the majority (125) are located outside of UZAs. Libraries in the rural part of the corridor tend to exist along major transportation corridors, especially in smaller population centers.
2.d. I-90 Corridor
Demographics
As of 2000, the total population of the I-90 Corridor was almost 2 million, of which 67 percent was outside of UZAs. The non-urban population of the Corridor includes 258,600 people in South Dakota, 368,800 in Minnesota, 79,500 in Iowa, and 627,000 in Wisconsin.
The average population density outside of the UZAs is 847 persons per square mile. Non-urban population density decreases toward the western end of the corridor, averaging only 478 persons per square mile in South Dakota, compared to 808 in Wisconsin, and 1,098 in Minnesota. There are some areas outside of the UZA and well past the urban fringes that have a relatively high density. Mountain Lake and Wells, Minnesota are examples of such places, representing cities and larger towns that are too small to qualify as urban, yet contain a significant population.
Population in the I-90 Corridor has increased overall between 1990 and 2000. From the geographic trend in the corridor, it is evident that much of the increase in those years has occurred on the urban fringes of Madison, Wisconsin and of Rapid City and Sioux Falls, South Dakota. Year 2005 population estimates at a county level suggest that this trend is continuing.
Whites make up 93 percent of the corridor population, while Blacks make up 2 percent. Asians, American Indians, and other races make up less than 5 percent of the population. Hispanics (who may be of any race) make up 5 percent of the population. Five American Indian reservations overlap the I-90 Corridor study area, including the Crow Creek, Lower Brule, Pine Ridge, Winnebago, and Yankton Indian Reservations. This corridor has the largest number of reservations of the three corridors in the study, and contains the largest number of American Indians (26,200 per the 2000 census).
Economics
In 2005, the States within the I-90 Corridor had lower unemployment rates than the national average of 5.5 percent. Unemployment rates in 2005 were 4.7 percent in Wisconsin, 4.0 percent in Minnesota, 4.6 percent in Iowa, and 3.9 percent in South Dakota.
The top three industries in the I-90 Corridor are manufacturing (18.4 percent of the corridor employed population), health care (17.8 percent), and retail (14.7 percent). Examining the corridor by State, health care ranges from 13 to 25 percent of the population employed. Wisconsin has the smallest percentage of people employed in the health care industry, while Minnesota has the highest percentage. Iowa has the highest percentage of people working in manufacturing, while South Dakota has the lowest. Retail employment is fairly consistent across the four States. The I-90 Corridor has higher percentages of people employed in health care, retail, and manufacturing than the national average.
Health Resources
There are 105 medical facilities in the I-90 Corridor, of which 47 are located outside of an UZA. Thirty-two facilities in the corridor are mixed focus with a mental health orientation, and 66 are substance abuse facilities, most are located in or near an UZA. There are 4 trauma centers in the I-90 Corridor, all in UZAs. Wisconsin has 1 Level 1 trauma center at the University of Wisconsin-Madison and 1 Level 2 trauma center at the Gundersen Lutheran Medical Center in La Crosse. The other 2 trauma centers are Avera McKennan Hospital and Sanford USD Medical Center, both Level 2 centers located in Sioux Falls, South Dakota. The trauma hospitals and other medical facilities in the I-90 Corridor are typically affiliated with larger hospitals as part of four larger, regional care networks. For example, Avera McKennan Hospital is part of the Avera Health network, which has 229 facilities in the five-State region of South Dakota, North Dakota, Minnesota, Iowa, and Nebraska. The Sanford Health System, the umbrella organization for Sanford USD Medical Center, also serves this five-State region.
Various telemedicine programs were identified within each of the four major medical networks serving the corridor. For example, Sanford Health systems and Avera Health network both use video technology for telemedicine, distance learning, and video conferencing. Gundersen Lutheran uses video and HST to share information on vital statistics, symptoms, and other case details, as well as for conducting consultations and virtual office visits. Organizations like Gunderson Lutheran also provide oncology service, such as chemotherapy, to rural communities, with the assistance of video conferencing.
Educational Resources
There are 824 elementary and secondary schools in the I-90 corridor. 76 percent of all elementary and secondary schools in the corridor are located in or within 10 miles of an UZA; 366 are located outside of an UZA. There are 49 postsecondary educational institutions in the I-90 Corridor, 33 of which are located in an UZA. (Post-secondary institutions include public and private two-year colleges, four-year colleges, community colleges, technical schools, and universities (offering advanced degree programs).) Some of the larger postsecondary institutions in this corridor include the University of Wisconsin-Madison, the Mayo Medical School, Rochester Community and Technical College, La Crosse Lutheran Hospital Medical School, and Northern Iowa Community College. Distance learning courses at the university level are available through the University of Wisconsin system.
The I-90 Corridor contains 254 library facilities, 33 in the UZAs and 221 in the rural parts of the corridor. Outside of clusters in the urban areas, the libraries are typically located along major road corridors, especially in the larger cities and towns.
2.e. I-91 Corridor
Demographics
The total population of the I-91 Corridor in 2000 was 1,082,000, of which 41 percent was outside of UZAs. The non-urban population in the I-91 Corridor includes 254,700 people in Massachusetts, 174,700 in New Hampshire, and 210,200 in Vermont.
The average population density outside of the UZAs is 720 persons per square mile. Population growth from 1990 to 2000 in the corridor ranged from 0 to 9.2 percent at a county level. Most stable was the Springfield UZA (Hampden County) in Massachusetts, with a 0 percent change. The greatest population change was a population increase of 9.2 percent in Orleans County, Vermont. Many of the areas showing the highest percentage increase in population are located away from the urban cores and away from the immediate highway corridor.
Whites make up 89 percent of the corridor population, while Blacks make up 4 percent. American Indians and Asians each make up 1 percent or less. The remaining 4 percent is made up of people identifying as an “other” race, not specifically identified by the Census Bureau. Approximately 7 percent of the total population in the corridor is Hispanic (may be of any race). There are no American Indian Reservations located in the corridor.
Economics
All three States in the I-91 Corridor had unemployment rates in 2005 below the national average of 5.5 percent: 4.8 percent in Massachusetts, 3.5 percent in Vermont, and 3.6 percent in New Hampshire.
The top three industries in the I-91 Corridor (Employment data are for the Massachusetts and New Hampshire portions of the corridor only. Employment data by industry for the State of Vermont was unavailable) are health care (18.4 percent of the corridor employed population), retail (15.3 percent of the corridor population), and manufacturing (14.1 percent of corridor population). The I-91 Corridor has higher percentages of people employed in health care, retail, and manufacturing than the national average.
Health Resources
The I-91 corridor includes 51 hospitals or other medical treatment facilities, of which 30 are located outside of UZAs. The largest hospitals are Baystate Medical Center in Springfield, Massachusetts and Dartmouth-Hitchcock Medical Center in Lebanon, New Hampshire. Both are Level 1 trauma centers. Most community hospitals are affiliated with the larger hospitals as part of a care network; for example, Franklin Medical Center is affiliated with Baystate, which in turn is part of the Tufts New England Medical Network, and a number of the corridor hospitals are part of the Dartmouth-Hitchcock Alliance. One hospital in Springfield, Vermont is affiliated with Fletcher-Allen Medical Center in Burlington. Another major facility is the White River Junction Veterans’ Administration Medical Center, which provides general services to approximately 94,000 military veterans. The corridor also is served by various community health centers; nursing homes, mental health, and substance abuse facilities; and private practices. Many of the private practices include only a single doctor. Often these practices are affiliated with the larger service networks.
Various telemedicine programs were identified within each of the three major medical networks serving the corridor. For example, through its teletrauma program, Fletcher Allen surgeons have direct video access to the emergency rooms of community hospitals and are available to consult on cases 24-hours a day, 7 days a week. Baystate and Franklin Medical Center are both designated as primary stroke treatment centers, and make use of telemedicine technologies to assist in stroke diagnosis and treatment. Dartmouth-Hitchcock is using telemedicine for video consults, and transmission of radiology images, and streaming video for learning services, among other applications.
Educational Resources
There are 391 elementary and secondary schools in the corridor, of which 233 are located outside of UZAs. There are 40 postsecondary schools, including 22 in Massachusetts, 10 in New Hampshire, and 8 in Vermont. Some of the largest include Amherst College, Hampshire College, and the University of Massachusetts – Amherst in Massachusetts; Dartmouth College in Hanover, New Hampshire; and Vermont Law School in South Royalton, Vermont. Twenty-four of the 40 postsecondary schools in the I-91 Corridor are located outside of an UZA.
Of the 276 libraries that exist in the corridor, the vast majority (245) are located outside of UZAs.
2.f. Existing Telecommunications
Backbone in Corridors
Telecommunications backbones already have been constructed throughout the United States by both private entities and public agencies. Within the study corridors, the private-sector construction of fiber optics cables along the interstate highway rights-of-way has been limited to Louisiana and Wisconsin. Market forces in the 1990s, however, generally resulted in the private construction of long-haul optical fiber cable routes roughly parallel to the corridors on different types of rights-of-way such as pipelines, secondary roads, railroads, and private easements to achieve the needed connectivity. These high-level presentations provide a glimpse of private sector HST investments in the area.
Some State agencies have constructed telecommunications backbones within corridor rights-of-way to serve ITS and safety needs, as detailed below:
- I-20 – Optical fiber is installed along I-20 around Jackson, Mississippi for use by the Mississippi DOT. The Louisiana Department of Transportation and Development (LaDOTD) has access to private sector optical fiber along I-20 between Shreveport and Monroe, through four access points. Louisiana also has eight microwave towers on I-20. The Alabama DOT has installed fiber on I-20 in the Birmingham area for their ITS needs and in the Tuscaloosa area for use by the State and city.
- I-90 – In Wisconsin, optical fiber is installed where I-90 and I-94 are coincident. There are six conduits, including one occupied by Wisconsin DOT 36-count fiber optic cable and one by an AT&T 288-count fiber optic cable. The other four conduits are empty. In Minnesota, there currently is no fiber optics installed on I-90 although there are 800 MHz microwave towers installed on or near I-90. In South Dakota, fiber optic cable has been installed in a three-mile section of I-90 near Sioux Falls and a 100-mile section between Spearfish and Wall. There is a pending installation request for a section of fiber optic infrastructure near Mitchell, South Dakota.
- I-91 – The Massachusetts Highway Department has released a request for proposals (RFP) to install optical fiber along I-91 through Massachusetts and I-291 in Springfield. The project will include six conduits, where four have been designated for future use and may be leased out. The private sector partner chosen to perform the work will be required to pull optical fiber through the empty conduits with the intent to provide high-speed communications to local communities along the corridor. In Vermont, the Agency of Transportation has a funding source of $10 million to support an optical fiber project traversing the State along I-91 and is using that funding to complete the environmental and permitting process. Once that work is complete, the agency will issue an RFP for a public-private partnership to build out the communications network.
Research was conducted to provide a sense of the level of private sector deployment of fiber optic and tower infrastructure in the vicinity of the corridors. Macro-level information was provided to the study team by a private clearinghouse maintaining this information. Figures 10, 11, and 12 show existing fiber optic and tower locations in the defined corridors owned and operated by one or more private communications providers. In addition to interstate highway ROW, these communications facilities most likely run along frontage road systems and railroad lines or where ever the private provider could secure access.
Figure 10: I-20 Existing Private Provider Fiber Networks and Tower Infrastructure
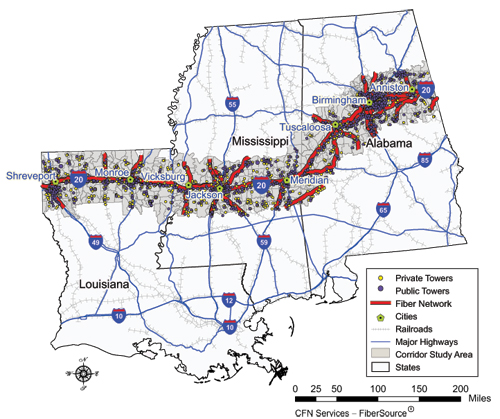
Figure 11: I-90 Existing Private Provider Fiber Networks and Tower Infrastructure
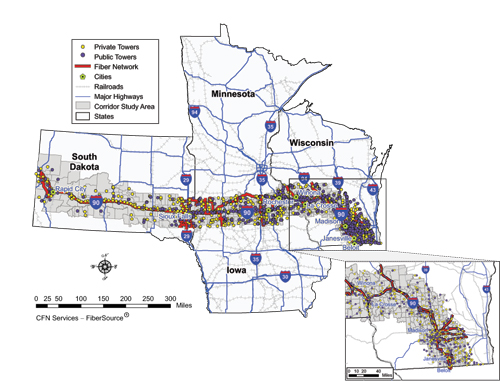
Figure 12: I-91 Existing Private Provider Fiber Networks and Tower Infrastructure