Comprehensive Truck Size and Weight Limits Study - Modal Shift Comparative Analysis Technical Report
Appendix B: Modal Shift Project Plan/Schedule
B.1 Objective
The U.S. USDOT Comprehensive Truck Size and Weight Limits Study - Volume II: Modal Shift Comparative Analysis will provide estimates of the changes in a base case of modal freight activity under existing Federal truck size and weight regulations that might be expected to occur as a result of changes in Federal truck size and weight regulations. In order to estimate these changes in freight activity, FHWA will first establish a base case using commodity flow data for each mode being considered in the analysis. The base case will reflect modal shares of total base-year freight volumes and vehicle miles of travel (VMT) by truck configuration by commodity and origin-destination under current Federal truck size and weight limits. After the base case is established, the team will consider several scenario cases of changes in Federal truck size and weight regulations. The scenario cases will be determined by the USDOT. For each of the scenarios considered, the team will estimate changes in freight transportation activity, including:
- Shifts of truck freight tonnage from the base case configuration to a scenario configuration. These shifts are referred to as intra-modal shifts.
- Shifts of truck travel from lower class highways to higher class highways due to easing of more restrictive Federal size and weight regulations in the base case than State regulations applicable off the Interstate System.
- If a scenario's parameters include a more restricted highway network for the alternative configuration(s) being examined, shifts of truck travel from lower class highways to higher class highways due to shifts in truck volumes to scenario configurations that are allowed only on the more restricted highway network than base case configurations.
- Shifts of freight tonnage transported by a non-highway mode (e.g., rail, water) in the base case to truck in a scenario. These shifts are referred to as inter-modal shifts.
The shifts described above will be reflected in a change from the base case to the scenario case in the volume of truck travel (measured as VMT) and the distribution of that VMT by truck configuration, highway functional class, and gross vehicle weight. These changes in trucking activity, along with any commensurate changes in rail, water, and other freight activity, will be used in other tasks to estimate scenario impacts on highway safety, traffic operations, infrastructure wear and tear, energy consumption, the environment, and on the economy. Specifically, impacts will be estimated as the difference between impacts from base case movements by various freight modes and impacts from scenario case activity.
B.2 Approach
Each case (the base case and each scenario case) will be analyzed through a series of subtasks to estimate total logistics costs for each shipping alternative being considered for each freight flow in the analysis. The subtasks include:
- Determining freight flow data by commodity, origin-destination, and mode;
- Estimating shipment size for each shipping alternative;
- Establishing truck flow assignment to various highway networks;
- Assigning freight to highway equipment, including: body type, configuration, and payload;
- Calculating total highway travel by body-type, configuration, highway network and vehicle operating weight;
- Calculating base case transportation costs from origin to destination for each shipping alternative;
- Calculating base case non-transport logistics costs for each shipping alternative;
- Calculating scenario transportation costs from origin to destination for each shipping alternative
- Calculating scenario non-transport logistics costs for each shipping alternative
- Assigning freight to shipping alternatives based on total logistics costs; and
- Evaluating base case and scenario case freight volumes on highway infrastructure, safety, environment, energy consumption, and the economy.
Figure B1 on the following page illustrates the mode shift methodology. Each step is explained in detail following Figure B1.
Figure B1: Mode Shift Methodology
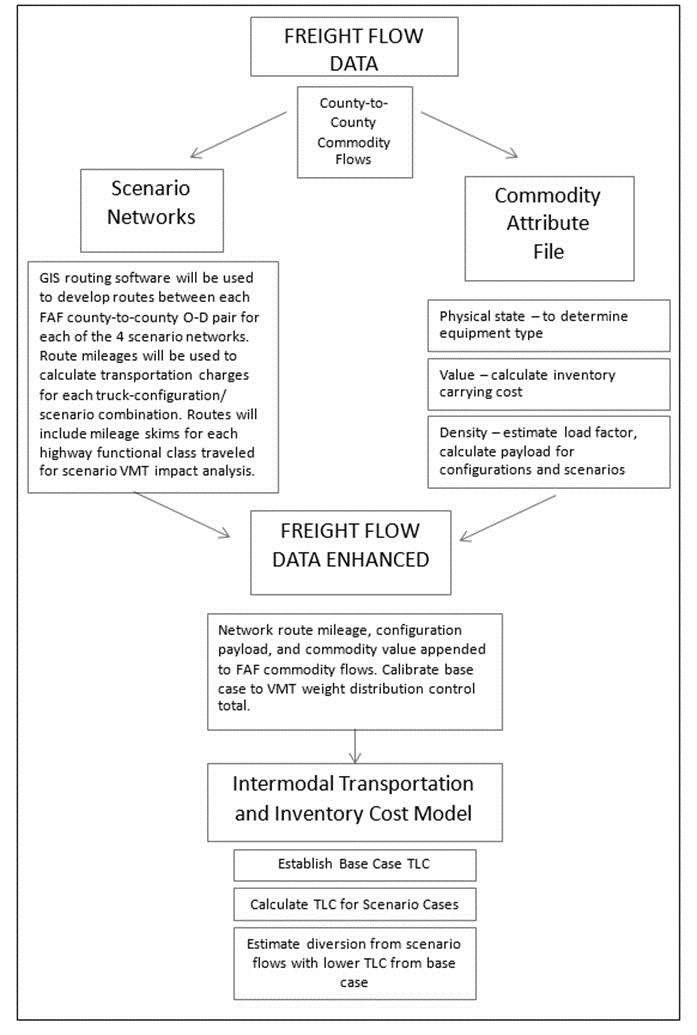
Subtask: Freight Flow Data
The team will use commodity flow data for truck from Federal Highway Administration's (FHWA) Freight Analysis Framework (FAF) database, disaggregated to the county level by Oak Ridge National Laboratory.
Subtask Detail: Non-Highway Mode Freight Flows
The 2014 CTSW Study will consider shifts from rail and water modes to highway modes. USDOT will evaluate the suitability of FAF data for these two modes for use in the study. Rail moves in the FAF data are based on the Surface Transportation Board (STB) Public Use Waybill file, but the Carload Waybill Sample contains more accurate route distances. Comparisons will be made to determine how significant the difference is and the implications for estimates of modal shifts.
Rail traffic will be analyzed as two distinct modes in considering the potential for diversion to alternative truck configurations and scenarios being considered for this study: 1) rail carload traffic and 2) rail intermodal traffic. Truck and rail competition for carload traffic and intermodal traffic are very different. Carload traffic requires rail sidings for loading and unloading at both origin and destination, while intermodal traffic is picked up and delivered by highway at both ends of the move, with truck and rail serving as substitutes for the line-haul portion of the move. Carload capacities are generally several multiples of what a single truck configuration can haul and often consist of multiple cars or make up an entire "unit" train of 100 cars or more. Intermodal shipment sizes are similar, if not identical, to highway shipment sizes - the intermodal box will move on both rail and highway networks, and its utilization for hauling freight is interchangeable with highway-only equipment. The commodities that move by rail carload are generally lower value, bulk commodities (e.g., coal, non-metallic minerals, ores) or commodities requiring specialized equipment and handling (e.g., chemicals). The commodities that move by highway are generally higher value and are more sensitive to the on-time service performance advantage that highway has over rail carload.
Rail carload traffic will be further broken down into two analysis methodologies - one for traffic serviced by short-line/regional, Class II, and Class III rail carriers and one for the Class I rail carriers. Again, truck and rail competition are very different depending on the size of the rail network and customer base. Smaller, short-line, and regional railroads serve a small number of customers over short distances, either hauling products to a Class I rail network connection, or hauling limited, often specialized commodities over short distances. The rail network of small carriers are usually lines that were once part of a Class I rail network, but could not be operated profitably under the cost structure of the Class I Rail Carriers. Trucks compete more effectively with these small rail operators for the short-haul, specialized-commodity traffic, where the loss of a single customer could force the rail operator out of business. The Carload Waybill Sample includes some but not all moves by Class II and Class III rail carriers. Shipments included in the Waybill will be analyzed using the ITIC model, but shipments not in the Waybill will be analyzed more qualitatively based on available information.
For analysis of mode shifts of rail intermodal traffic, the team will develop, in consultation with USDOT's Federal Railroad Administration (FRA), an expected drayage distance that will act as a proxy for the truck movements for each origin and destination to a rail intermodal terminal.
Waterway traffic to be considered for the study will be developed in consultation with USDOT's Maritime Administration (MARAD). Short-sea shipping potential to reduce highway truck travel is currently being considered for public funding. A 2006 case study of four short-sea shipping corridors developed transportation rates for short-sea shipping that may be relevant for this study in estimating its market share potential with existing Federal size and weight limits and how that potential would change under a hypothetical increase in size and weight limits. The team will evaluate the development of short-sea shipping rates used in this study for its applicability to the current study.
Subtask Schedule and Product: The study team will develop a complete freight flow database for truck, rail, and water by December 21, 2013. This database will be in an appropriate format for use in subsequent tasks that require these data.
Subtask: Freight Flow Assignment to Highway Network
The assignment of freight flows to highway networks provides the mileage base for estimating the transportation costs of moving freight from origin to destination by truck. Truck rates are determined by distance, shipment weight, equipment type, and special handling requirements of the commodity. These rates are generally quoted in dollars/cents per mile.
The project statement of work stipulates that four highway networks are to be analyzed in the study: the Interstate System, the National Highway System, the Principal Arterial System and NHS Intermodal Freight Connectors, and the National Truck Network. The team anticipates that at least some longer combination vehicles (LCV) included in the analysis will be restricted to higher classification highways (i.e., those with limited access and egress) resulting in more circuitous LCV routings than for some freight flows in non-LCVs traveling on a denser highway network. For those configurations limited to higher-order systems, scenarios will assume that staging areas will be necessary to allow those vehicles to assemble and disassemble for entry to and exit from the restricted network. The capital and operating cost of staging areas will be incorporated into the freight rates for those configurations that require the facilities.
Because infrastructure design standards and traffic operations vary across highway functional classifications, information on functional classification of truck travel in each case analyzed is necessary to assess the impacts of truck travel on safety, infrastructure, traffic operations, energy consumption, and the environment required for the 2014 CTSW Study.
Subtask Detail: County-to-County Flows
There are some 3,000 county level jurisdictions in the United States, giving rise to a potential of some 4.5 million unique (unordered) county pairs. An unknown fraction of these pairs have freight flows between them. For each of the four highway networks included in the analysis, network routes will be generated for each county pair for which a freight flow exists in the data. In those cases where a restricted LCV network is not continuous between an origin and destination (O-D) county pair, the off-network mileage for a continuous route over unrestricted network links will be accumulated separately from the restricted LCV network mileage. This off-network mileage will be used in estimating the costs of off-network transportation to move the multiple trailers of an LCV as single trailers over the unrestricted network links.
The network routings between counties will be developed using GIS software - e.g., Transcad, ESRI. For each route generated, the output will include, at a minimum, the identification of each of the two counties in the pair and the miles of travel along the generated route by highway classification.
Subtask Schedule and Product: The study team will complete highway network assignment for base case and scenario traffic moving between each origin and destination pair by December 21, 2013.
Subtask: Freight Assignment to Highway Equipment
The assignment of freight to highway equipment is a key component of determining transportation costs. Specialized equipment, such as tankers, has higher capital costs and higher empty-to-loaded mileage ratios than general freight equipment, such as dry vans. These differences in capital costs and operating characteristics result in differences in the per-mile rates charged by operators of specialized equipment.
Like differences in equipment body types, differences in equipment configurations also affect capital costs and operating characteristics. A twin or triple LCV configuration requires the additional capital of the added trailer(s) and may require a change in driver operations to efficiently move trailers between staging areas and off-network points of pickup/delivery.
Another important consideration in assigning freight to highway equipment is the payload weight. Weigh-in-motion (WIM) data show that over seventy percent of travel by five-axle tractor-semitrailer configurations is at gross vehicle weights of 70,000 lbs. or less, even though this configuration is legal up to 80,000 lbs. At the other end of the spectrum, over 8 percent of five-axle travel is at gross vehicle weights in excess of 80,000 lbs. The WIM distributed VMT data for every State, including States without grandfathered limits in excess of the 80,000-lb. Federal weight limit, and those that allow travel at weights above 80,000 lbs. Some of this traffic is operating legally under State permit and some is operating illegally. The process of assigning freight to highway equipment in the base case will include calibrating the result to approximate existing WIM data for VMT and weight distributions by vehicle configuration.
Subtask Detail: Cargo-Unit Body Type
The discontinued Vehicle Inventory and Use Survey (VIUS) provides the best available source of information on the operating characteristics of trucks by equipment type. The survey included information on commodities carried, typical payload weight, number of axles, cargo-unit body type, number of trailers, and empty miles. Although the survey was last conducted in 2002, because Federal size and weight limits have generally remained unchanged since then, the information is still useful and will be used in assigning commodity types by cargo-unit body type.
Subtask Detail: Configuration
Much of the truck travel in the United States uses configurations that do not fall within the parameters of traffic that serves as a candidate for shifting from one truck configuration to an alternative configuration being considered in the study; for example, three-axle tractor-semitrailer and three-axle single-unit truck configurations operating at Federal Bridge Formula limits currently have higher legal weight alternative configurations options and don't utilize them. In addition, several of the alternative configurations being analyzed in the 2014 CTSW Study already operate in some areas of the country.
In developing the 2014 CTSW Study's base case, FHWA will assign traffic from the commodity flow data used in the study to yield distributions of truck VMT by configuration and functional class that approximate existing data for truck VMT distributions. Base case traffic that is designated as having a higher weight-legal alternative configuration in the base case-e.g., three-axle tractor-semitrailer, three-axle single-unit truck at 60,000 lbs. or less in the base case-will not be evaluated for a shift in scenario cases. Likewise, traffic assigned to one of the alternative configurations in the base case will not be considered for a configuration shift to a lower cube or weight configuration in scenario cases, although it may be assigned a higher payload weight in the base case configuration in the scenario case than in the base case.
Subtask Detail: Payload
In conjunction with the assignment of commodity flow volumes by configuration and functional class described above, the team will develop commodity specific payload factors for each equipment type (cargo body type and configuration). Commodities are commonly classified as "weigh-out" or "cube-out," as determined by whether they fill the cubic capacity of the cargo carrying unit before reaching the maximum legal gross vehicle weight (cube-out) or reach the legal gross vehicle weight limit before filling the cubic capacity of the cargo carrying unit (weigh-out). Commodities with densities of 13 lbs. per cubic foot or greater, which is most commodities, are technically weigh-out commodities for a five-axle tractor-semitrailer (3-S2) configuration limited to 80,000 lbs. gross vehicle weight, yet national weight distributions developed from weigh-in-motion data for 3-S2s indicate that over 70 percent operate at 70,000 lbs. gross vehicle weight or less. About a fourth of those loads weigh less than 35,000 lbs. and can be attributed to empty backhauls. The balance represents partial loads and "floor-out" commodities that fill the floor space but not the full interior height of the trailer. Payload factors will represent the typical payload of the commodity as a percentage of the maximum payload the configuration can legally carry. These factors will vary by cargo body type, where bulk equipment types generally utilize a higher percentage of maximum allowable payload than general freight equipment. The maximum payload will be calculated as the Federal weight limit for the configuration minus the vehicle tare weight. Commodity specific payload factors will be scaled by commodity density and payload information from the VIUS.
Subtask Detail: Freight Assignment to Highway Equipment
Commodity-specific characteristics of the three freight assignment parameters described above, cargo-unit body type, configuration and payload, will be catalogued in a database of commodity attributes. The commodity attribute database will include VIUS information on the distribution of commodity VMT by equipment configuration, cargo-unit body type and typical payload, as well as commodity density and value characteristics.
Truck freight volumes from the commodity flow data will be "loaded" to base case configurations according to commodity attributes. This process will generate the number of truck trips between origins and destinations necessary to transport the commodity flow data volumes. Applying route mileages between origins and destinations generated in the highway network assignment subtask to the truck trips data will provide an estimate of truck VMT by configuration, distributed by gross vehicle weight. This result will be calibrated to approximate existing WIM data by configuration through iterative adjustments to commodity attribute configuration and payload values. This process will likely necessitate applying a distributed range of commodity-specific payload factors to achieve the WIM target weight distributions. Existing WIM data indicates that 8.5 percent of 3-S2 VMT operates at weights in excess of 80,000 lbs. The iterative calibration of the freight assignment subtask will result in a similar percentage of base case 3-S2 VMT operating above the nominal Federal weight limit, as well as other configurations operating above nominal Federal limits.
Subtask Schedule and Product: The study team will develop a complete assignment of the various types of commodities to different types of highway equipment and operating weight distributions by January 8, 2014.
Subtask: Calculation of Base-case Transportation Costs
Truck rates are determined in large part on the mileage between origin and destination, the equipment used to transport the shipment and any special handling requirements to transport the commodity. FHWA will evaluate and update as necessary for application to this 2014 CTSW Study the market truck rate data used by FHWA in mode shift estimates in previous size and weight analyses.
The team will consult with FRA and MARAD to develop transportation rates for base case rail and waterway traffic that will be analyzed for potential diversion to highways as a result of changes to Federal truck size and weight limits. The team expects to draw on FRA's experience in developing rail rates for rail-competitive truck traffic in their Inventory Transportation and Inventory Cost (ITIC) analyses of truck-to-rail diversion of tolling and positive train control, as well as MARAD's work on developing rates in its 2006 report of four case studies.
Subtask Detail: Market Truck Rate Data
The truck rate data FHWA obtained for the Strategic Multimodal Analysis project consists of single trailer dry-van truckload rates between points in the United States as assigned to 113 market areas. These rates reflect lane imbalances where they exist, with head-haul/outbound rates higher than back-haul/inbound rates. FHWA will investigate the possibility of obtaining a more current database of truckload market-based freight rates, but if unable to do so, will utilize the existing data.
FHWA will update, if necessary, and supplement truckload market-based freight rates to reflect price differentials between dry-van trailers and specialized trailers (e.g., flatbed, tanker, refrigerated), differences in empty-to-loaded ratios between dry-van and specialized trailers and the additional capital cost of multi-trailer configurations.
FHWA will map origins and destinations of the commodity flow database to their respective markets in the truck rate database. The output of this subtask will be a database of truck rates for each origin-destination pair differentiated by trailer type and configuration.
Subtask Detail: Calculation of Base-case Transportation Costs
Base-case transportation costs for truck volumes will be calculated by application of the truck rate database to the base-case truck loads developed in the Freight Assignment to Highway Equipment subtask.
Base-case transportation costs for traffic on other modes that would potentially divert to highway modes under increased Federal truck size and weight regulations will be developed collaboratively with FRA and MARAD. The costs developed for these modes will be used to develop total logistics costs for the rail or waterway move that will be used for comparison against truck total logistics costs in determining the mode selected in scenario cases.
Subtask Schedule and Product: The study team will develop a complete base case transportation cost estimate for each mode and each origin-destination pair by January 15, 2014.
Subtask: Calculation of Base-case Non-Transport Logistics Costs
Non-transport logistics costs are those costs associated with the ownership of inventory. They include inventory carrying costs, storage, loss, damage and obsolescence. The team will utilize FHWA's Inventory Transportation and Inventory Cost model (ITIC) to estimate these cost.
Subtask Detail: Application of ITIC to Base Case
The team will review the various versions of ITIC model, including the ITIC-IM version developed by FRA for estimating diversion from highway to rail, and the version used in FHWA analysis for the Western Governors LCV Uniformity and Strategic Multimodal Analysis studies. FHWA will incorporate updated and improved coding and algorithms developed by FHWA and FRA into the version used previously for FHWA studies in order to perform a complete analysis of mode shifts resulting from the use of the alternative truck configurations being considered in the 2014 CTSW Study. The logic for estimating shipper responses to small changes in total logistics costs associated with hypothetical changes in truck configurations will receive particular attention.
Once the ITIC model is updated, FHWA will load the base-case freight volumes into the model, including the transportation costs estimated in the previous subtask. The non-transport logistics costs estimated in ITIC will be added to the transportation costs to establish base case total logistics, against which total logistics costs for alternative configuration scenarios will be assessed for intra- and inter-modal shifts of traffic.
Subtask Schedule and Product: The study team will develop a complete base case non-transport logistics cost estimate for each commodity movement by each mode between each origin-destination pair by January 22, 2014.
Subtask: Calculation of Scenario Transportation Costs by Highway for Each Alternative Configuration Being Considered
Each of the alternative configurations to be evaluated in the study increases the cargo carrying capacity of trucks and is expected to decrease the transportation costs per ton of freight per mile traveled. For some of the alternative configurations, the cost reduction per ton per mile of travel will be partially offset by more circuitous routing on higher classified highways than the base case configuration traveled, as well as assembling and disassembling LCVs at staging areas for access to and egress from restricted LCV highway networks.
Calculation of scenario costs will follow the same process used to calculate base case costs: assignment of commodity flow to equipment type, configuration, and payload. Equipment assignment in the scenario is the same cargo-body assigned in the base case. The configuration assignment is determined by the alternative configuration(s) being considered in the scenario.
Subtask Detail: Scenario Payload
Payloads for each scenario will be calculated from the payload factors developed for the base case described previously. For scenarios with single trailer alternative configurations - e.g., 88,000 lbs., five-axle tractor-semitrailer - mode shifts from base case configurations to be considered will be limited to traffic that approaches the existing 80,000-lb. Federal weight limit. For example, a base case five-axle tractor-semitrailer with a gross vehicle weight of 50,000 lbs. will not be considered for mode shift to the 88,000-lb., five-axle tractor-semitrailer alternative configuration.
For multi-trailer configurations, payloads will capped at the lower of the weight limit allowed on the alternative configuration and the weight increase from the base case configuration that is proportional to the increase in cubic capacity from the base case configuration. Using the five-axle tractor-semitrailer example from above, the approximately 30,000-lb. payload would be legal on each trailer of a turnpike double configuration of two trailers having the same length as the base case trailer. In this case, the scenario payload would be twice that of the base case.
Subtask Schedule and Product: The study team will develop a complete transportation cost estimate for movements of each commodity by each mode (including scenario vehicles) between each origin-destination pair by January 22, 2014.
Subtask: Calculation of Scenario Non-Transport Logistics Costs
The process for calculation of non-transport logistics costs for scenario cases is identical to the process for calculation of those cost for the base case described previously. Once calculated, scenario non-transport logistics costs are added to transportation costs to generate total logistics cost for the scenario case being evaluated. These costs are stored in the ITIC model for comparison with base case total logistics costs.
Subtask Schedule and Product: The study team will develop complete non-transport logistics cost estimates for movements of each commodity by each mode (including scenario vehicles) between each origin-destination pair by January 29, 2014.
Subtask: Freight assignment to mode based on total logistics costs
Once base case and scenario case total logistics costs have been calculated, the two costs can be compared and a decision made as to which mode the traffic would use in the base case and in the scenario case. For each case, truck volumes are summarized by configuration, highway functional class and gross vehicle weight. As previously discussed, the base case result is calibrated to yield approximate VMT and weight distributions of existing available data. Scenario truck volumes are similarly summarized, providing scenario VMT distributed by highway functional class and weight.
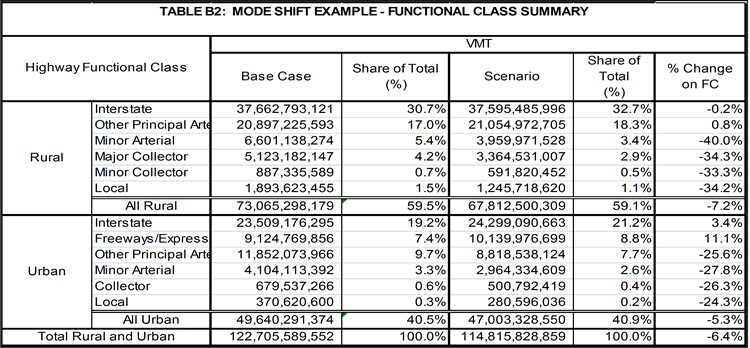
Example: Mode Shift VMT illustrates an example of VMT analysis output results for three configurations by functional class, base and scenario cases, and weights. Mode Shift VMT are estimates of travel levels produced as an output of modeling the effects of various scenarios applying the ITIC Model. These VMT results are summarized in Tables B1 and B2.
Table B1: Mode Shift Example - Vehicle Class Summary
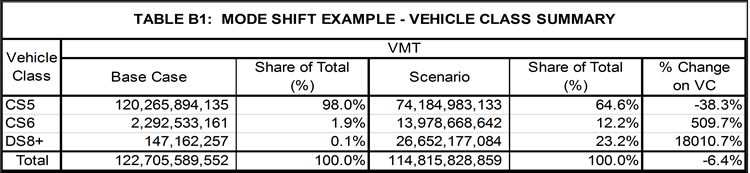
Table B2: Mode Shift Example - Functional Class Summary
Subtask Schedule and Product: The study team will develop complete base case and scenario case mode assignments, output VMT by configuration, highway functional class and weight group by February 5, 2014.
Subtask: Evaluation of Base-case and Scenario Truck Volumes on Certain Factors
The estimated modal shifts resulting from the introduction of the alternative configurations as illustrated in Example: Mode Shift VMT will impact multiple factors related to highway transportation, including safety, pavement costs, bridge costs, energy consumption, the environment and the economy. Some of these impacts are likely to be positive and some are likely to be negative. Safety, pavement, and bridge impacts are analyzed in Tasks V.A, V.B, and V.C of the 2014 CTSW Study. Impacts on energy consumption, environmental impacts, cost responsibility, and productivity are included in this task.
Subtask Detail: Evaluation of Fuel Consumption, Air Quality and other Environmental Impacts
Fuel consumption of the various truck configurations will be evaluated at different operating weights in developing an MPG/GVW profile for each configuration. The U.S. Environmental Protection Agency (EPA) Greenhouse Gas Emissions Model (GEM) open source vehicle modeling and simulation software will be used to perform the fuel economy and emissions analysis, using GEM vehicle models to represent each configuration to be evaluated. The vehicle models will be calibrated with drag and rolling coefficients measured in previous test programs.
Outputs of the analysis will include the load specific (per ton-mile) fuel consumption, carbon dioxide (CO2), nitrous oxides (NOx), sulfur oxides (SOx), volatile organic compounds (VOC), and particulate matter (PM) emissions for each vehicle configuration. FHWA will develop a spreadsheet model that will estimate the impacts of these outputs on the entire vehicle fleet. The spreadsheet model will apply the vehicle fuel consumption and emissions rates per vehicle-miles-traveled to a set of weighted traffic profiles. These profiles will represent the vehicle composition of the fleet, the VMT and the duty cycles traveled by these vehicles. This information will be provided to the fuel and emissions modeling team by the mode diversion team and will represent the different fleet configurations and travel patterns determined in each scenario considered by the diversion team. The end result will be a model capable of reporting system wide changes to fuel consumption and emissions as a consequence of adopting different standards on truck size and weight.
Data from FRA's recent report, Comparative Evaluation of Rail and Truck Fuel Efficiency on Competitive Corridors, will be used to estimate changes in energy and emissions associated with potential diversion of traffic from rail to truck associated with the various scenarios.
To evaluate the noise pollution occasioned by the alternative configurations, FHWA will assess the suitability of the noise analysis from the 2000 CTSW Study for this project. The FHWA Office of Planning, Environment and Realty will consult on the suitability of Traffic Noise Model (https://www.fhwa.dot.gov/ environment/noise/traffic_noise_model/) for assessing the difference in noise pollution from the change in VMT and vehicle configurations in the traffic mix resulting from the introduction of the alternative configurations.
Subtask Schedule and Product: The study team will develop a complete evaluation of the fuel consumption and air quality impacts of each scenario by March 1, 2014.
Subtask Detail: Evaluation of Traffic Operations Impacts
The analysis of impacts of the scenario vehicles on traffic operations will closely follow the analysis of traffic operations impacts in the 2000 CTSW Study. Passenger car equivalents will be estimated for each scenario vehicle based on a review of recent literature. As in the 2000 CTSW Study, congestion delays will be estimated using traffic simulation models reflecting operations on different types of highways. The truck VMT by truck configuration and weight that is estimated to result from scenario configurations is substituted in the traffic delay model for the base case truck VMT, and the change in highway operating speed by functional class is calculated to obtain the change in delay for all highway users. This change in delay in vehicle hours is then multiplied by a time value to obtain the change in congestion costs.
Longer, heavier trucks also affect other aspects of traffic operations such as passing, acceleration (merging and hill climbing), lane changing, and intersection requirements. The magnitude of these impacts is too site-specific to model quantitatively on a nationwide basis. Impacts will be discussed qualitatively with an emphasis on factors that affect the magnitude of impacts compared to base case vehicles.
Subtask Schedule and Product: The study team will develop a complete evaluation of traffic operations impacts of each scenario by March 1, 2014. This will include quantitative estimates of changes in congestion-related delay as well as qualitative assessments of how scenario vehicles would affect other aspects of traffic operations.
Subtask Detail: Evaluation on Cost Responsibilities
Detailed assessments of changes in the cost responsibility for pavement and bridge improvement costs associated with the various scenarios are included in other tasks. Cost responsibility estimates from those tasks along with other quantitative and qualitative information developed in this study on costs attributable to different vehicle classes will be summarized in this subtask. This will not constitute a comprehensive highway cost allocation study, but will provide a broad overview of how costs associated with the operations of vehicles analyzed in the various scenarios are attributed to different vehicle configurations and weight groups.
Subtask Schedule and Product: A complete evaluation of the cost responsibility of the various scenario vehicles for changes in pavement and bridge costs will be developed by March 7, 2014. Summaries of the impacts of scenario vehicles on safety, traffic operations, energy consumption, emissions, and other environmental factors will also be included to present an overall picture of the relative impacts of each of the scenario vehicles.
Subtask Detail: Evaluation on Freight Transportation Costs
The team will evaluate the change in Total Logistics Costs as estimated by ITIC and its transportation and non-transportation components. Based on past studies, the largest impact on transportation costs will be on traffic currently moving by truck. The team will summarize the changes in transportation costs and non-transportation logistics cost for the base case and each scenario analyzed, and report changes in costs for each scenario case in total and separately by the base case mode of the shifted traffic. In the case of traffic diversions from the rail mode, the evaluation will include the ability of the railroads to cover the lost contribution of diverted traffic to network fixed costs and the secondary effects of additional diversions of rail traffic due to rate increases necessary to cover that lost contribution, or rail line abandonment where the remaining traffic base cannot support fixed network costs. Analysis of these impacts on the railroads will be similar to that conducted for the 2000 CTSW Study. FRA staff will be consulted to determine if methods used in the 2000 CTSW Study need refinement.
Primary diversion on the short-line/regional rail operator will be further assessed as to secondary effects of viability of the operator to cover fixed costs of the network with remaining customer-base/business. The team will rely on short-line rail industry expertise for this assessment.
Limited rail-to-rail competition in some long-haul rail carload traffic markets in the Class I segment of the analysis allows railroads to price their service above what they would be able to charge if competition for the traffic existed. In these markets, competition from the increased productivity offered by the 2014 CTSW Study's alternative configurations may put downward pressure on rail rates. Traffic in these markets will be assessed for potential reduction in rail rates, but generally will be assumed to be retained by the railroad.
Subtask Schedule and Product: The study team will develop a complete evaluation of changes in total freight logistics costs associated with each scenario vehicle will be developed by March 1, 2014.
Subtask Detail: Impacts on Economic Productivity
The team will evaluate the effects of changes in Federal truck size and weight limits on the productivity of different parts of the freight transportation industry. The discussion will address direct and indirect costs and benefits of the size and weight changes, how those costs and benefits are quantified, and the net direction of impacts when the various factors are considered together. This analysis will be based primarily on an assessment of industries that would benefit the most if scenario vehicles were allowed to operate and the magnitude of the reduction in total logistics costs those industries might realize. The team will provide a breakout of industries most able to benefit from the alternative configurations and, to the extent possible, the geography of the benefits and the costs of operating those vehicles. The analysis will show the relative benefits and costs of the various scenarios but will not constitute a comprehensive benefit-cost analysis of any individual scenario.
Subtask Schedule and Product: The study team will develop an evaluation of impacts of each scenario on economic productivity with different sectors of the economy by March 7, 2014.
B.3 Task Data Needs
The methodology for the modal shift analysis establishes base case and scenario case modal freight activity using the Intermodal Transportation and Inventory Cost (ITIC) model. The ITIC uses costing algorithms to estimate the total logistics costs of freight by alternative transportation modes. Data requirements for the model include:
- Comprehensive freight flow data, which is annual commodity flow volumes between origins and destinations. The FAF3 database will be the source of commodity flow data. The Oak Ridge National Laboratory is disaggregating the data to provide county-level origin-destination data for the commodities and modes included in the FAF. The impact analyses to be conducted in the study require detailed origin and destination locations; i.e., county-to-county flows. Disaggregate flows are necessary to properly assign scenario configurations to the highway networks to which they will be restricted. The Example: Mode Shift VMT illustrates how truck freight will shift across configurations, highway functional classes and gross vehicle weights from a base case analysis to a scenario analysis. The VMT distributions output from the mode shift analysis will provide the inputs for the 2014 CTSW Study's analyses for infrastructure, safety, traffic operations, energy, and environmental impacts.
- Network route miles, which is defined as mileage by highway functional class for each scenario network analyzed. Highway networks include the National Truck Network as defined in 23 CFR Part 658; Example: Mode Shift VMT; the Principal Arterial System and National Highway System Intermodal Freight Connectors; the National Highway System as designated and in use September 1, 2012; and the Interstate System as designated and in use September 1, 2012. The team will use GIS software (e.g., Transcad, ESRI) to generate route miles between each origin-destination pair for each truck configuration being analyzed. Mileage between O-D pairs may differ by configuration if certain configurations are assumed to be prohibited on certain parts of the highway system.
- Commodity attributes, which include density (pounds per cubic foot); value (dollars per pound); handling requirements (e.g., refrigerated, hazardous). FHWA's existing values for commodity density will be reviewed using available sources, such as the National Motor Freight Classification, if available, and industry contacts. Commodity values will be derived from 2007 Commodity Flow Survey (CFS) value and tonnage data. Commodity values calculated from the 2007 CFS will be mode-specific; that is, the value of a commodity hauled by truck will be calculated as the total commodity value hauled by truck divided by the tonnage volume hauled by truck. Each mode hauling the given commodity will similarly have a mode-specific commodity value calculated. The reason for calculating mode-specific commodity values is the lack of specificity in the CFS commodity groupings, which allows for a broad range of commodities within a single CFS commodity group. Most CFS commodity groups are assigned a higher value per pound for products moved via truck than those moved via rail; for example, the value of "Articles of Base Metal" transported by truck in the 2007 CFS was $1.32/pound, while the value transported by rail was $0.41/pound. Commodity value affects inventory carrying costs, one component of the non-transportation logistics costs that will affect shipper mode choice in the diversion analysis.
- Freight rates, which are truck rates from the market rate database. The study team will obtain market-based truck rate data either through purchase from a vendor, such as TransCore DAT, or by updating FHWA's 2006 truck rate database to analyze year price levels. Rail rates will be developed with Federal Railroad Administration (FRA) input based on rates in STB's railroad waybill sample. Waterway rates will be developed with MARAD input based on their rate development for the 2006 report, Four Corridor Case Studies of Short-sea Shipping Services.
- Equipment costs and operating characteristics will be obtained from publicly available and industry sources. Information on new equipment prices will be collected from truck and trailer manufacturers, dealers, and purchasers. The study team will use industry contacts to obtain this equipment pricing information. Price information for truck-tractors at horsepower ratings necessary to maintain speed for the configurations being analyzed and trailer prices for dry-van, flatbed, refrigerated, tanker, and dry-bulk cargo bodies will be collected. Empty/loaded ratios by equipment type will be estimated from the 2002 VIUS to develop rate differentials from dry-van rates for other equipment types.
Table B3 summarizes data sources for the modal split analysis and methods for bring those data to the 2011 analysis year.
previous | next