Comprehensive Truck Size and Weight Limits Study: Stakeholder Sessions 2013-2015: Feedback and Comments, Final Report
3. QUANTITATIVE ANALYSIS OF COMMENTS
This section provides a quantitative analysis of the comments by topic, derived from various communication formats.
3.1 Comments by Topic
3.1.1 May 29, 2013 Stakeholder Input Event #1
On May 29, 2013, the date of the first public input event, comments made by participants were transcribed from the two rounds of breakout sessions and collected from the webinar portion of the breakout sessions. At 120 comments, the data, models and methodology breakout sessions produced the most commentary of any of the three major categories of discussion during Stakeholder Input Event #1 (the other two categories were alternative truck configurations and general matters). This session also produced the most web-based comments for the May 29 event, with 45 total comments. Specific comments and responses are provided in Appendix A, which is comprised of 1) a transcript summarizing the breakout session discussion on alternative vehicle configuration, 2) matrices of comments from the breakout sessions on data, models and methodology and another set from the sessions on general discussion topics; followed by 3) matrices of comments from the web chat box on vehicle configurations; web comments on Web data, models and methodologies; and web comments on general discussion topics.
The following charts provide detail by session topic, according to the types of input (in-person or by comment in the webinar chat box).
Comments from the two consecutively held truck configuration breakout sessions were aggregated for this analysis. They yielded a total of 88 comments and/or questions. The largest percentage dealt with key elements for selection of the alternative configurations for study.
Figure 1 illustrates the percentage of comments received by sub-topic during the two truck configuration breakout sessions.
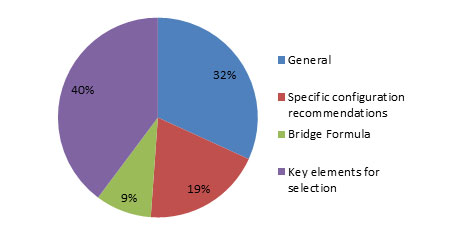
Figure 1. Chart. Truck configuration breakout sessions.
The two breakout sessions on data, models and methodology held on May 29, 2013, resulted in a total of 120 comments. The largest percentage dealt with modal shift, followed by safety.
Figure 2 illustrates the percentage of comments received by subtopic during these sessions.
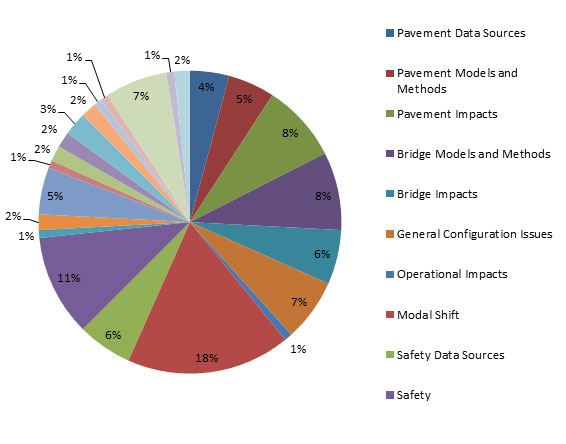
Figure 2. Chart. Comments made during the data, models and methodology discussion.
During the general discussion breakout sessions, 13 topics were discussed and 27 comments provided. Economic and environmental impacts generated the most comments and questions.
Figure 3 illustrates the percentage of comments by topic.
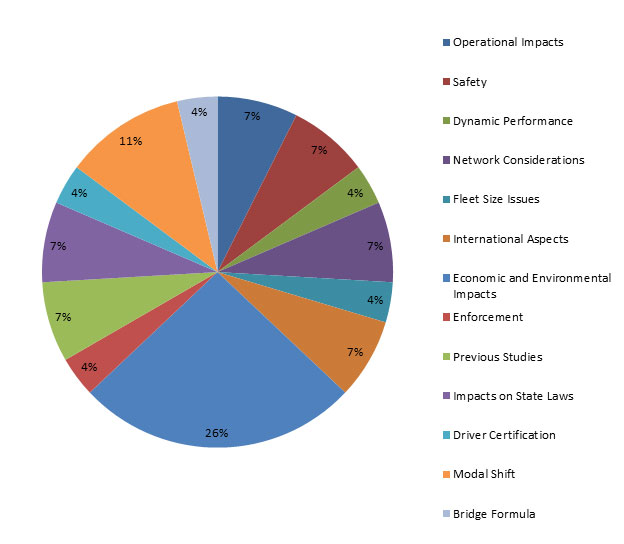
Figure 3. Chart. Comments made during the general discussion.
The webinar comments during the breakout sessions were also analyzed by subtopic areas. Within the breakout session on alternative configurations, there were 38 comments and questions recorded via the web chat pod. Specific configuration recommendations and network considerations were the subtopics most prominently addressed in the Web-based comments. The percentage by topic area is provided in Figure 4.
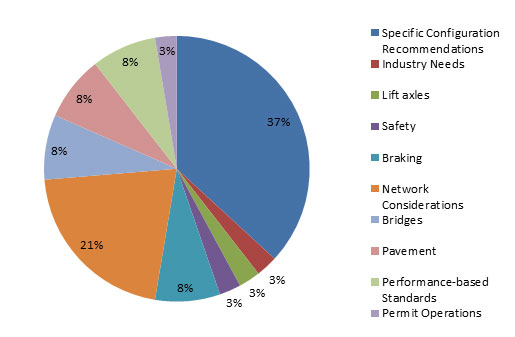
Figure 4. Chart. Web comments during the alternative configuration discussion.
The webinar session related to data, models and methodology resulted in 45 comments or questions. The most prevalent comments related to bridge impacts, followed by safety and modal diversion in equal parts. The percentage of comments related to this subject by subtopic is shown in Figure 5.
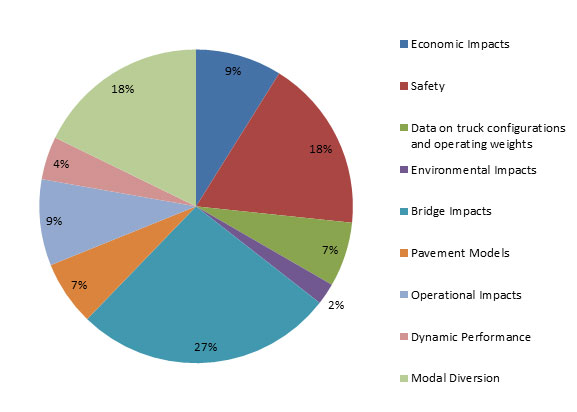
Figure 5. Chart. Web comments during the data, models and methodology discussion.
A general topics session was also held during the webinar. This session resulted in 31 comments or questions related to 19 different topics, with highway design standards, enforcement and previous studies raised most often for comment or question. The percentage of comments by topic is illustrated in Figure 6.
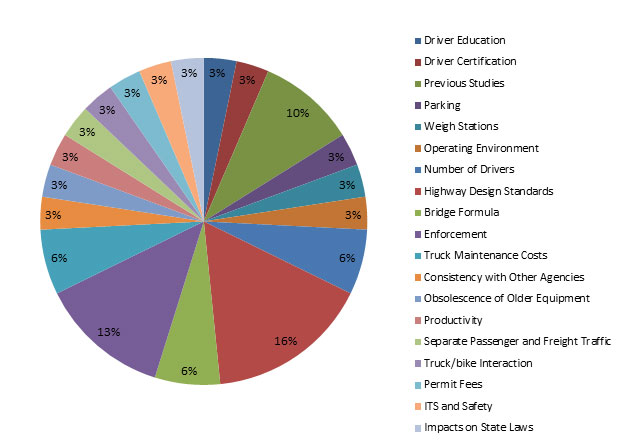
Figure 6. Chart. Web comments during the general topics discussion.
The May 29, 2013 event also generated a total of 99 written comments sent by email or letter to DOT officials and the Web site address. The comments were categorized into 14 topic areas, with an additional category for general issues. The most common topic among those comments submitted in writing related to recommendations for vehicle configurations.
Figure 7 illustrates the percentage of written comments received by topic area following the event on May 29, 2013.
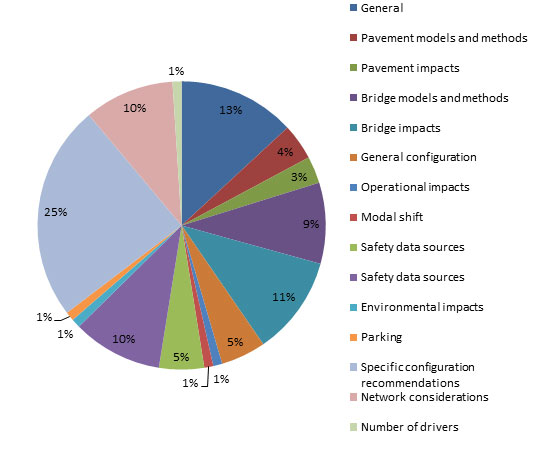
Figure 7. Chart. Written comments.
3.1.2 December 18, 2013, Stakeholder Input Event #2, Webinar
The December 18, 2013, Stakeholder Event webinar resulted in a total of 89 comments including comments received over the phone and those received through the webinar chat box. The topics of safety and modal shift comprised over half of the comments, followed by bridge impacts. Specific comments and responses are found in Appendix B.
Figure 8 illustrates the percentage of comments by topic area generated during the webinar on December 18, 2013.
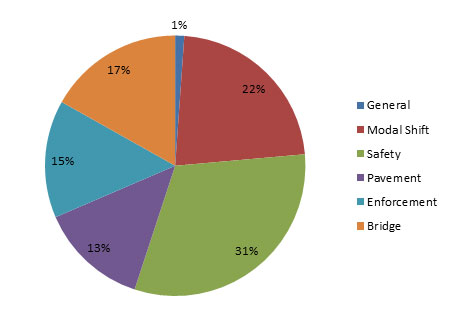
Figure 8. Chart. December 18, 2013, comments.
3.1.3 May 6, 2014, Stakeholder Input Event #3, Webinar
The May 6, 2014, Stakeholder Event webinar resulted in a total of 38 comments including comments received over the phone and those received through the webinar chat box. Nearly 40 percent of the comments dealt with bridge issues while nearly a quarter focused on modal shift. Specific comments and responses are found in Appendix C.
Figure 9 illustrates the percentage of comments by each topic area generated during the webinar held on May 6, 2014.
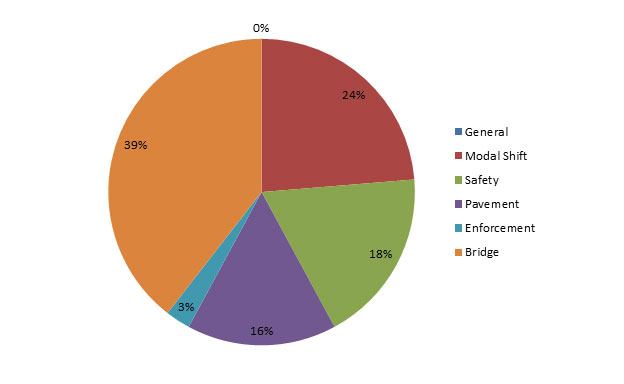
Figure 9. Chart. May 6, 2014, comments.
3.1.4 June 18, 2015, Stakeholder Input Event #4, Webinar
The final Stakeholder Event webinar, held on June 18, 2015, resulted in a total of 28 comments including comments received over the phone and those received via the webinar chat box. Safety topics led the comments, followed by equal numbers of comments on and modal shift and bridge topics. Eleven percent raised questions or comments regarding enforcement. Specific comments are found in Appendix D.
Figure 10 illustrates the percentage of comments by each topic area generated during the webinar held on June 18, 2015.
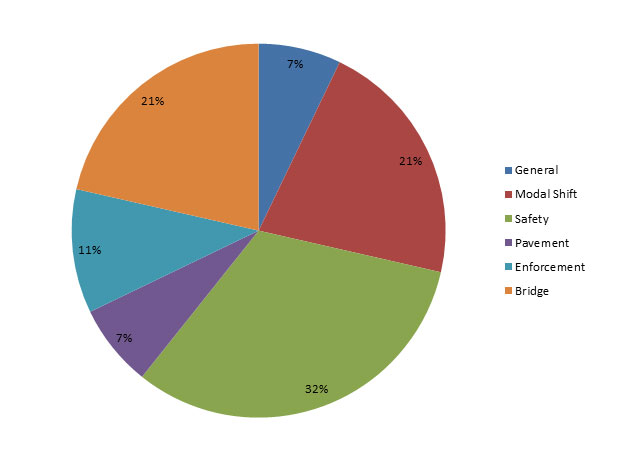
Figure 10. Chart. June 18, 2015, comments.