Key Freight Transportation Challenges
Congestion and Capacity
Increases in the volume of freight have strained the transportation network in some locations and exacerbated conflicts between the traveling public and freight carriers. Recent growth in international trade has placed greater pressure on gateways, ports, airports, and border crossings—nodes in the system that are potential bottlenecks for the movement of freight. Between 1990 and 2000, U.S. international trade more than doubled (in inflation-adjusted terms), rising from about $900 billion to $2.2 trillion. Nearly one-third of U.S. merchandise trade in 2000 was with Canada and Mexico (USDOT BTS 2001a). Many gateways already suffer from congestion, which has intensified by heightened security following the terrorist attacks of September 11, 2001.
Figure 6. Top 20 International Freight Gateways: 1998 (Tons)
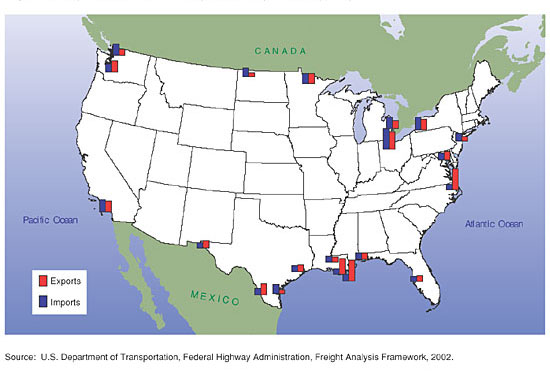
View the data for figure 6 [HTML, Excel 16KB]
Growing international trade has also changed the geography of freight movements within the United States, creating high growth trade routes and with it the need for improvements. Historically, domestic freight corridors developed with an east-west orientation, reflecting the westward development of the Nation. As Pacific Rim trade increased over the last 30 years, east-west corridors linking major West Coast gateways with the rest of the United States experienced dramatic growth in traffic. Many of these corridors are experiencing increased congestion as international trade competes with domestic traffic for use of transportation infrastructure along these high growth corridors.
Figure 7. Value of U.S. Merchandise Trade with Canada and Mexico: 1994 - 2000
View the data for figure 7 [ HTML, Excel 19KB]
Additionally, the creation of NAFTA (North American Free Trade Agreement) has fostered north-south traffic, placing more demands on the domestic freight transportation system. Since NAFTA went into effect in 1994, U.S. trade with Canada and Mexico has risen by about 90 percent (USDOT BTS 2001a). As a result, the Nation's highway and rail networks—initially developed for the traditional east-west trade—are now strained, especially at border crossings. In the future, trade with NAFTA and Latin American countries is expected to grow along both north-south corridors and east-west corridors running through the northern and southern border regions. The anticipated growth in trade and changes in the character of freight flows present many challenges to America's transportation system and highlights the importance of international gateways to the U.S. economy and security.
To further exacerbate the situation, the transportation network has not increased at a rate commensurate with growth in travel and commerce. In the highway sector, for example, vehicle-miles traveled (vmt) increased by 80 percent while lane-miles of public roads increased by only 2 percent between 1980 and 2000. Growth in truck-miles traveled was even more dramatic, exceeding the growth in passenger vmt over the last few years (USDOT FHWA 2001a). Clearly, more traffic is moving over essentially the same highway infrastructure. Other surface transportation networks are witnessing a similar overburdening of their systems as well.
Figure 8. Vehicle-Miles Traveled (VMT) and Lane-Miles: 1998 - 2000
View the data for figure 8 [HTML, Excel 19KB]
When demand outstrips supply, the resulting congestion can have a devastating effect on speed and reliability. The Texas Transportation Institute (TTI) estimates that 4.5 billion hours of highway delay occurred in 68 urban areas in 1999. About 54 percent of the delay was caused by incidents, such as crashes and breakdowns (TTI 2001). Using different methods, Oak Ridge National Laboratory estimates that nationwide 2.3 billion hours of delay are caused by crashes, inclement weather, work zones, poor signal timing and vehicle breakdowns. Total delay is higher than either of these estimates.
No slowdown in travel and freight transport is in sight. Between 1998 and 2020, total vmt is expected to increase, on average, by more than 2.5 percent annually. Truck vmt is expected to grow by more than 3 percent annually over the same period (DRI WEFA). These increases in travel and freight movement mean that more roadways will be congested in the future.
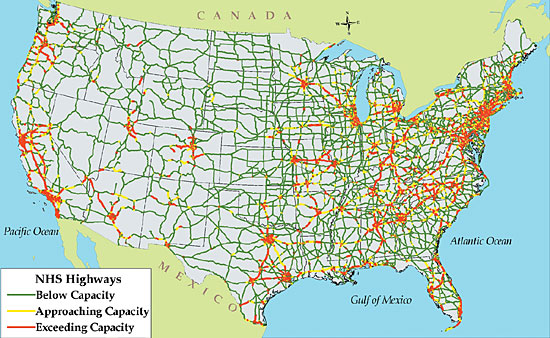
FAF estimates that even with growth in air-freight, maritime, and rail services, about 29 percent of the urban NHS will be congested, with an additional 13 percent approaching congestion, during peak periods in 2020. By comparison, 10 percent of the urban NHS was congested in 1998. In terms of functional class, urban Interstates are and will continue to be the most traveled segments, with congestion reaching 53 percent in 2020. 1
Figure 9. National Highway System Estimated
Peak Period Congestion: 1998
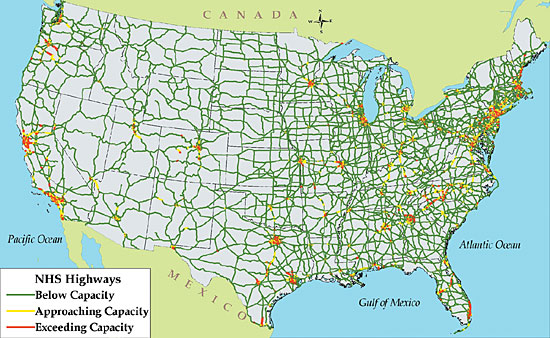
View a text-version of this map
PDF
version of map
Figure 10. National Highway System
Estimated Peak Period Congestion: 2020
View a text-version of this map
PDF
version of map
High-volume truck traffic along major corridors is also a concern. FAF estimates that 69 percent of urban Interstates will carry more than 10,000 trucks in 2020 compared with 27 percent in 1998. It is important to note, however, that these dramatic increases are not limited to urban areas, as both congestion and truck volumes are expected to increase on rural interstate segments as well.
Given these forecasts, congestion is likely to be a long-term condition requiring additional investments in freight improvements to alleviate anticipated pressure on the Nation's transportation network. An annual expenditure of $75.9 billion (2000 dollars) will be needed for the 2001-2020 period just to maintain the physical highway infrastructure, as it existed in 2000. (USDOT FHWA 2002c). One of the Nation's biggest challenges, and a critical focus of USDOT, is closing the gap between the demand for transportation services and infrastructure capacity.
Reducing highway congestion won't be easy. Solutions will likely involve a mix of investments to add new capacity, preserve existing infrastructure, and improve operations. In some locations, adding new capacity may be the right choice to accommodate increasing demand for freight services. In other cases, improving operations may be the most effective way to alleviate congestion and optimize freight movements. Regardless of the approach, the environment, safety, and security of the freight transportation network are likely to also benefit from projects to reduce congestion.
Congestion and capacity issues are emerging in other freight modes as well.
Air cargo capacity, for example, is constrained by the limited availability
of new slots at major commercial airports and opposition to airport noise and
longer operating hours. This situation is exacerbated by the fact that shippers
are increasingly relying on air cargo services to meet just-in-time deliveries
and lower inventories.
In the rail industry, aging infrastructure and limited capital to invest in
new or improved capacity are major challenges. The Mid-Atlantic Rail Study
identified $6 billion of needed improvements to meet capacity requirements
over the next 20 years. Many of the improvements identified in the study will
benefit both freight and passenger traffic.
The maritime industry is also experiencing congestion. Many U.S. ports are struggling to handle larger containerized vessels and increases in international traffic arriving at their terminals. Adding new and improving existing terminal capacity, dredging to deepen harbors and channels, and upgrading intermodal connectors are critical to providing timely and reliable service and ensuring a port's long-term success. The U.S. Chamber of Commerce is now studying capacity constraints at U.S. container ports.
1 To estimate current congestion, FAF uses traffic count data from individual NHS segments in accordance with the Highway Capacity Manual's volume-to-capacity ratio. (NHS segments include only those sections built and operational.) To estimate future congestion, FAF uses forecasted vehicle-miles of travel and trucking activity data, which are then applied to NHS segments using the methodology noted above. Estimating future congestion is difficult given the uncertainties related to operational gains from future improvements or other changes, such as driver habits. Thus, several caveats regarding FAF forecasts are required. FAF assumes the network in place in 1998 will remain unchanged in 2020, but traffic volumes will increase. This may contribute to higher forecasts of system capacity constraints than if changes in capacity or other factors were incorporated into the analysis. However, given the limited growth in total lane-miles over the past twenty years, the FAF forecast still provides useful insights into future traffic patterns related to freight movements.
previous | next