Jason's Law Truck Parking Survey Results and Comparative Analysis
IV. Truck Parking Metrics
Introduction
As noted previously, Jason’s Law requires the development of a set of metrics to measure the adequacy of truck parking. To do this, FHWA divided this work into three distinct elements: 1) a research program to document previous work by public agencies and stakeholders to evaluate truck parking supply, demand, and other measures of adequacy; 2) a Truck Parking Metrics Workshop involving stakeholders from key industry groups and public agency representatives; and 3) the development of a system of metrics for stakeholder use in determining the impact of truck parking.
Review of Truck Parking Metrics
The research conducted for this effort suggests that measuring the adequacy of truck parking at any level of geography is complex since parking demand and parking supply are highly dynamic. The demand for long-term parking at any location, at any time, reflects both regulatory requirements a driver must meet as well as the logistical patterns related to market forces underpinning the demand for freight movement. In general terms, the primary aspects of truck transportation that drive parking demand are:
- Origin and destination
- Length of trip and routing
- Delivery schedules for shippers, receivers and terminals
- Unanticipated highway congestion and related delay
- Hours-of-service (HOS) requirements.
In evaluating the need for parking, it is necessary to understand the patterns of freight demand, such as origins and destinations, and the picture of freight movement along routes or corridors. This helps to illustrate the areas of greatest truck concentration, where there is a high level of competition for long-term parking within a geographic space, and how limited the supply of parking is in those areas of demand. Consideration of trip length and routing is important for understanding locations for parking along preferred routes and where parking is appropriate related to trip time on these routes. Another consideration is the delivery schedules and just-in-time windows of delivery, which drivers must meet, and how the staging of these activities aligns with routing and parking needs. The added aspect of congestion means that there could be low reliability and high variability in route planning and identification of truck parking locations that work with delivery schedules. Delay may cause the truck driver to have to rethink routing and identify other truck parking options.
Parking needs vary across different subsectors of the trucking industry and different types of drivers, and not all parking locations are adequate depending on driver needs. Long-haul drivers are held to the most restrictive rest requirements ,while short-haul drivers who operate within a 100-mile radius of a home terminal and return to that location at the end of every shift are subjected to separate rest requirements. Drivers also have different needs in terms of amenities along their routes. Parking to rest in a public rest area, where no food, fuel, or shower facilities are available, reflects a different parking and rest experience than parking to rest in a full service private truck stop. In evaluating levels of parking, simply enumerating the number of spaces at a location, without consideration of the driver type and needs, as well as amenities associated with the locations, runs the risk of overstating the number of spaces both appropriate for and available for long-term parking.
Ideally, each driver requiring rest should be able to access a safe, clean, full service parking space to obtain long-term rest whenever the need for long-term parking arises during a trip. In reality, there is often a mismatch between driver demand for parking at a point in space and time with the availability of an adequate parking space at that point and time. The result is a shortage of parking, which leads to illegal or unofficial parking on shoulders, ramps, and local streets. Measuring the adequacy of truck parking therefore requires adopting a full set of measures rather than a single measure to capture the complexity of parking supply and demand.
Desk Scan of Prior Studies
A list of the documents reviewed related to truck parking adequacy is shown in Table 11. Each of these studies and surveys had its own purpose and need, and in some cases the measurement of truck parking adequacy was not the primary focus of the technical work. However, all of them addressed issues related to truck parking adequacy that are relevant to this study and to the provisions of MAP-21 that relate to truck parking. In terms of measuring adequacy, the most common approach found in these documents dealt with adequacy in terms of truck parking demand and available parking spaces at geographic scales that ranged from highway corridors to a national level. The publication dates for the documents listed in Table 11 reflect a growing interest in the issue of truck parking in recent years.
| Title | Sponsoring Agency or Organization | Publication Date |
|---|---|---|
| Commercial Driver Rest Area Requirements:Making Space For Safety | FHWA | 1996 |
| Analysis of Vehicle Classification and Truck Weight Data of the New England States: Final Report | U.S. Department of Energy | 1998 |
| Minnesota Safety Rest Area Programs: Commercial Truck Usage Nighttime Parking Demand Analysis | Minnesota Department of Transportation | 1998 |
| Commercial Vehicle Parking | Iowa State University / Iowa Department of Transportation | 1999 |
| Truck Characteristics Analysis | FHWA | 1999 |
| NTSB Highway Special Investigation Report: Truck Parking Areas | NTSB (National Transportation Safety Board | 2000 |
| Guide for Development of Rest Areas on Major Arterials and Freeways, 3rd Edition | American Association of State Highway and Transportation Officials (AASHTO) Task Force on Geometric Design | 2001 |
| Truck Stop and Rest Area Parking Study: Final Report | Connecticut Department of Transportation | 2001 |
| Estimating the Supply and Demand for Commercial Heavy Truck Parking on Interstate Highways: A Case Study of I-81 in Virginia | Virginia Transportation Research Council / FHWA | 2002 |
| Study of Adequacy of Commercial Truck Parking Facilities: Technical Report | FHWA | 2002 |
| Truck Traffic Analysis using Weigh-In-Motion (WIM) Data in California | University of California (Berkeley), Institute of Transportation Studies | 2002 |
| Commercial Vehicle Service Plan: Final Report | Maine Department of Transportation | 2003 |
| WSDOT Truck Parking Study: Final Report | Washington Department of Transportation | 2005 |
| North Jersey Truck Rest Stop Study: Final Report | North Jersey Transportation Planning Authority (NJTPA) | 2007 |
| Study on the Feasibility of Organizing a Network of Secured Parking Areas for Road Transport Operators on the Trans-European Road Network | European Commission Directorate-General Energy and Transport | 2007 |
| Truck Parking in Pennsylvania | Pennsylvania State Transportation Advisory Committee (TAC) | 2007 |
| The Minnesota Interstate Truck Parking Study | Minnesota Department of Transportation | 2008 |
| Multi-State Truck Stop Inventory and Assessment | New York Metropolitan Transportation Council (NYMTC) | 2008 |
| Truck Parking Needs at Rest Areas: Environmental Scan | University of Manitoba | 2009 |
| Commercial Vehicle Parking in California: Exploratory Evaluation of the Problem and Solutions | University of California (Berkeley), California PATH Program | 2010 |
| Freight Performance Measures: Approach Analysis | Oregon Dept. of Transportation / FHWA | 2010 |
| Smart Truck Parking Truck Stop Survey Report: Summary Results from a Clipboard Survey of Truckers along the I-5 Corridor | University of California (Berkeley), Transportation Research Sustainability Center | 2010 |
| Hours of Service and Driver Fatigue: Driver Characteristics Research | USDOT / Federal Motor Carrier Safety Administration (FMCSA) | 2011 |
| Commercial Motor Vehicle Parking Shortage: Report to Congress | FHWA | 2012 |
| Commercial Motor Vehicle Parking Trends at Rest Areas and Weigh Stations | Florida Dept. of Transportation | 2012 |
| 2013 Safe Truck Parking Survey | Multiple Volunteer Sponsors including Hope Rivenburg | 2013 |
| Deploying the Minnesota Truck Parking Availability System (Presentation) | Minnesota Department of Transportation / American Transportation Research Institute (ATRI) | 2013 |
| Truck Parking Survey | AASHTO | 2013 |
| Owner Operator Independent Drivers Association (OOIDA) New HOS Regulations Survey | OOIDA Foundation | 2013 |
| Using Truck GPS Data for Freight Performance Analysis in the Twin Cities Metro Area (TCMA) | University of Minnesota | 2013 |
| Utah I-15 Truck Parking Project (Presentation for American Trucking Associations (ATA), Trucking Industry Mobility and Technology Coalition (TIMTC) & ATRI Conference) | Utah Department of Transportation | 2013 |
The documents reviewed indicated that parking adequacy has traditionally been measured using six general approaches or methodologies:
- A facility-based approach is used to measure and model truck parking activity at an existing facility along a major highway such as a roadside rest area, a welcome center, or a toll road service plaza. Parking demand at an individual facility is based on a probability function related to the truck volume on the roadway, the distance to nearest upstream and downstream facilities, and the types of amenities provided at the facility (bathrooms, food/fuel, internet access, etc.), and this demand can be projected for future horizon years based on anticipated growth in truck volumes. This is the standard approach for measuring and forecasting parking by AASHTO for rest area development and maintenance, as documented in the 2001 Guide for Development of Rest Areas on Major Arterials and Freeways (see Table 11).
- A basic corridor-based approach is similar to the facility-based approach described previously, with facilities grouped along highway corridors to allow for the analysis of multiple facilities. When used in conjunction with travel time data along a corridor, this methodology can be used to measure the impacts of congestion on truck parking demand.
- The corridor-based approach with trip end considerations is an enhancement of the basic corridor-based approach that is ideally suited for large geographic regions where mandatory rest periods under FMCSA hours-of-service rules come into play for long truck trips. This methodology uses data from national resources such as the FHWA’s Freight Analysis Framework to identify truck trip origins and destinations and to link those trip ends to parking demand along corridors based on service windows and driver rest periods for trucks traveling between these origin and destination points.
- An enhanced corridor-based approach uses a combination of the three methodologies described previously, with additional consideration of the unique parking characteristics at trip ends related to truck staging, load scheduling and terminal operations. A major advantage of this approach over the previous three is that when applied properly with supporting data it can be used to measure latent parking demand without regard to parking capacity constraints at existing facilities.
- A number of studies have been conducted on real-time parking data collection using equipment such as digital video cameras, loop detectors, or a combination of technologies to measure truck parking activity on an ongoing basis. This non-intrusive data collection is usually intended to provide real-time parking information for truck drivers in regions where parking capacity is often constrained, but the technology allows for archiving massive quantities of data and measuring parking by time of day, by season, and by any other relevant temporal distribution.
- While the five approaches listed above for measuring truck parking adequacy are all aimed at measuring parking in terms of supply and demand, anecdotal information is often the best resource for measuring adequacy of truck parking facilities to meet the personal needs of commercial motor vehicle operators beyond the simple demand for parking spaces. This type of resource does not readily translate to metrics and other direct measures of performance, but it provides invaluable insight – often at a microscopic level of detail – about trends across different geographic areas, critical considerations related to the personal safety of these drivers, and other information about the interaction between different aspects of freight transportation (shippers/receivers, carriers, law enforcement, regulatory agencies, etc.).
These six methodologies, and the combinations of them that have been used to study and document the issue of truck parking over the years, generally approach the issue from one of two perspectives. A “facility-based” approach is used to estimate parking demand for roadside rest facilities on the NHS highway system based on current and future projected traffic volumes by vehicle class. This is typically used by State DOTs when developing new rest areas and upgrading existing facilities. These design guidelines were developed by AASHTO and are documented in AASHTO publications such as the Guide for Development of Rest Areas on Major Arterials and Freeways (AASHTO Task Force on Geometric Design, 3rd Edition, 2001).
A “travel-based” approach is used to measure parking demand based on the actual travel characteristics of commercial vehicles, their origins and destinations, and temporal factors related to peak demand periods, hours-of-service restrictions, and other factors. This methodology is documented in the Study of the Adequacy of Truck Parking Facilities (FHWA, 2002), which was conducted on a national basis and was among the first of its kind to focus on the different characteristics of truck travel.
The metrics identified in the review of previous studies were limited almost entirely to the simple considerations of truck parking supply and some form of peak demand that usually corresponded to overnight periods when parking associated with driver rest needs tends to be highest. This information has historically been a sufficient measure of adequacy because most of the studies were aimed at either supporting planning initiatives for truck parking facility needs on a State or corridor level or were commissioned to address some of the manifestations of truck parking capacity shortfalls in certain areas (overflowing rest areas, illegal parking on highway shoulders and entrance/exit ramps, crashes involving fatigued drivers, etc.). A notable exception to this was the “2013 Safe Truck Parking Survey,” which was a comprehensive outreach effort sponsored by several volunteer groups that gleaned valuable information from drivers in the trucking industry about various real-world, human-based factors associated with truck parking concerns beyond simple parking supply and demand.
The prior studies reviewed for this effort demonstrate an increasing awareness of the underlying factors that drive truck parking demand along with a broader understanding of personal factors in truck transportation such as driver safety, cargo security, and the importance of driver amenities at parking/rest facilities. The mathematical processes for measuring and forecasting truck parking demand have become increasingly complex, and have been tied more strongly over time to data resources such as regional traffic models, national commodity flow data, on-board GPS data, and warehouse and terminal operations in areas of heavy truck activity. A set of recommendations for developing appropriate and effective metrics for truck parking will be provided in the “Analysis of Methodologies and Metrics” section later in this document.
Truck Parking Metrics Workshop
A workshop was conducted in Washington, D.C. on January 16, 2014, to solicit information from stakeholders on measuring the adequacy of truck parking facilities. This workshop presented an open forum for participants to raise issues, concerns, and opportunities related to truck parking metrics specific to their industry and agency. The workshop was attended in person by nine individuals representing the FHWA, ATA, ATRI, NATSO, and AASHTO. Additionally, the workshop was available on the internet via webcast and attended by 19 representatives of various organizations, including State departments of transportation (State DOT), metropolitan planning organizations (MPO), and members of the Owner Operator Independent Drivers Association (OOIDA). Additional follow-up conference calls were held to secure input from several State truck associations and State law enforcement officials participating in the Commercial Vehicle Safety Alliance (CVSA).
Workshop Presentation
FHWA laid out the objectives of workshop – addressing the problems and requirements to solve the issues, how to best measure the problem, and what data needs to be collected to understand the problem. The issues that were discussed in this framework for the workshop included the following:
- Truck parking capacity in much of United States is constrained by aging facilities, economic factors, and public opposition to new facilities in suburban areas.
- There are some important environmental concerns (air quality and noise) related to truck idling.
- Problems associated with truck parking may put the safety of motorists (driver fatigue and trucks parked on shoulders) and truck drivers (crime exposure) at risk.
- The problem is likely to escalate over time due to the growth of truck activity.
- Rest requirements have impacts on truck parking activity that are often challenging to analyze.
- The economics of land use is an important consideration in addressing needs related to adequate truck parking.
Input from Representatives
The workshop provided an opportunity for the stakeholders to provide input on what should be considered when measuring truck parking adequacy. The range of perspectives helped to ensure that the issue of adequacy was considered from several angles. For the purpose of developing a system of metrics, it is important to understand stakeholder perspectives. The following summarizes the main points each stakeholder group expressed in the discussion on a system of metrics.State Departments of Transportation and the American Association of State Highway and Transportation Officials
The State DOTs indicated that their obligations to their constituents (primarily counties and municipalities) and the public include developing an understanding of the quantity and nature of truck traffic in their jurisdictions, determining the relationship of external factors such as FMCSA hours-of-service rules and shipper/terminal operations, and providing good information about parking capacity and availability to drivers, especially those from outside the area.
The State participants proposed a number of ideas to help measure the problem and collect data that would be useful to address the issue over time. These included the following:
- Create an annual census or survey of truck drivers to determine why they are parking where they are, and to help identify sites for safe parking facilities. Measure where drivers want to park and where their customers are located so they may be able to park close to where they drop off or pick up loads.
- Develop measures that represent safety risk beyond the total number of crashes. For example, there are locations where the numbers of crashes may not be substantial, but where risk factors for potentially catastrophic incidents that have significant impact on highway performance exist.
- Measure and identify used and unused State property and rights-of-way to help meet truck parking needs (e.g., number of parcels available in freight corridors).
- Assess use of technology to provide information to drivers about the location and availability of truck parking facilities.
The participants proposed and discussed a number of potential metrics that can be used to measure truck parking adequacy. The italicized items correspond to those recommendations that appear to lend well to quantitative measurement using data sources that may be available for many areas of the country.
- Truck volumes
- Percentage of trucks to overall AADT
- Percentage of trucks during peak hours
- Origin-destination pairs
- Business location data to identify industries that generate truck parking demand
- Forecasting tools for understanding long-term needs
- Economic value of truck stops
Truck Stop Operators
The NATSO representatives indicated that some of the important current interests of their constituents include adequate security for drivers; improving a common public perception that associates truck stops with crime, drug trafficking, and prostitution; and educating public officials about the role of truck stops in freight transportation and the economic importance of truck stops as commercial establishments. The participants proposed a number of ideas to help measure the problem and collect data that would be useful to address the issue over time. These included the following:
- Assess or measure levels of information and communication that assist in directing drivers to safe parking.
- Measure sales volumes and business data to inform the siting of facilities, including identifying traffic patterns, locations of distribution centers, and interchanges.
- Identify factors related to under-utilized truck stops, even in areas where parking demand is high. Driver perceptions about safety and crime may be a factor here.
- Measure impacts of the different parking needs among different sectors of the trucking industry. Shippers and carriers that have a hard time finding good drivers will often shorten their routes or provide more terminals closer together so that drivers spend less time away from home.
- Identify growth trends for short-term parking.
- Measure utilization of advanced technology to provide more real-time information for truck parking.
The participants proposed and discussed a number of potential metrics that can be used to measure truck parking adequacy from the perspective of the private truck stop industry. The list below includes all of the proposed information resources, with the ones that lend well to measurements using readily available data being identified in italics.
- Time-of-day utilization
- Segmentation of drivers (e.g., independents vs. fleet drivers, over-the-road vs. local drivers, carriers vs. shipper fleets)
- Return on Investment (ROI); documentation of trade-off between parking and retail floor area on a land parcel
- Number of spaces to make a facility profitable (i.e., larger facilities tend to have a lower return on investment due to the higher overhead costs)
- Crime/arrests at truck stop locations
- Proximity of existing and potential future parking locations to highways and shippers
Commercial Vehicle Enforcement and Safety Officials
The various highway safety and law enforcement representatives indicated that the most critical interests of their constituents include addressing the problem of trucks parked on highway shoulders due to the safety risk to passing motorists; outreach to the public, stakeholder groups, and policy makers about truck parking issues and their safety implications; and understanding the relationship between driver fatigue and truck crashes. This input was generally broader than the information received in the other categories due to the wide array of public and private groups represented by the CVSA.
The participants discussed a number of ideas to help measure the problem and collect data that would be useful to address the issue over time. These included the following:
- Develop or identify measures of parking behavior to illustrate the difference between a truck driver who deliberately parks illegally from one who parks illegally out of ignorance about nearby available spaces.
- Measure citations written for various violations related to truck parking and fatigue (e.g., illegal parking, hours-of-service violations). Variations in enforcement standards among States and regions will make this a challenge, but it would be a good start.
- Measure crashes involving trucks on highway shoulders and involve driver fatigue as a contributing factor. Cross-referencing crash records with driver logs to determine crash rates after a driver’s 10th hour of service may be a good indicator of the role of driver fatigue in truck crash.
- Use police records related to property damage and cargo theft at parking facilities as an indication of risks to the personal safety of truck drivers.
The participants proposed and discussed a number of potential metrics that can be used to measure truck parking adequacy from the broad range of perspectives brought by the various interests associated with highway safety. The list below includes all of the proposed information resources, with the ones that lend well to measurements using readily available data identified in italics.
- Crime statistics at parking facilities
- Data about safety/security assets at facilities (cameras, lights, gates, security personnel, etc.)
- Size and local zoning potential for space adequate to construct or expand facilities
- Distance of facilities from interstate highways
- Potential for public-private partnerships
- Role of incentives in truck parking
- Utilization of apps and technology by the trucking community
- Crashes/incidents, including secondary crashes
- Impacts of congestion on drive distance as it pertains to hours of service
Trucking Industry
The two major industry groups represented at the Workshop – the ATA and OOIDA – indicated that the most pressing issues facing their constituents in terms of truck parking adequacy include: ongoing education about FMCSA HOS rules, including newly implemented changes in the 34-hour restart requirement; self-policing of the industry to deal with persistent violators who give the industry a bad name; and managing the gradual change from paper logs to electronic logs across the industry. The input from the trucking industry was generally the most detailed and comprehensive, as this is the stakeholder group that sees the challenges associated with truck parking adequacy up close on a regular basis.
The participants discussed a number of ideas to help measure the problem and collect data that would be useful to address the issue. These included the following:
- Conduct a periodic inventory of publicly available spaces to see how the supply changes over time.
- Measure the correlation between average truck trip length and parking demand.
- Measure truck parking in the same way that highway authorities give to other high-profile issues like texting and drunk driving.
The participants proposed and discussed a number of potential metrics that can be used to measure truck parking adequacy from the perspective of the trucking industry. The list below includes all of the proposed information resources, with the ones that lend well to measurements using readily available data identified in italics.
- Locations of facilities relative to distances from major freight hubs in relation to rest requirements
- Locations of highway bottlenecks
- Delays due to recurring congestion
- Spaces per vehicle-miles traveled (VMT) and truck-miles traveled (TMT)
- Inventory of public and private spaces along highway corridors
- Proximity of facilities to the National Highway System
- Ratio of trailers per tractor (for identifying needs for oversized spaces)
- Measurements of distance traveled by truck relative to time of day
- Proximity of parking facilities to shippers/receivers and other industrial land uses
- Impacts of congestion on drive distance as it pertains to hours of service
- Impacts of congestion on travel times
- Measure and document truck trips by travel time (single day vs. multiple day) to quantify parking needs associated with extended rest times under FMCSA rules
- Document amenities and security issues on a facility-by-facility basis
- Reported parking violations on shoulders/interchanges (if this declines over time, progress is being made)
- State-by-State funding levels for truck parking upgrades/expansions/enhancements
Summary of Workshop Results
The stakeholder groups involved with the Truck Parking Metrics Workshop and subsequent proceedings recognized that truck parking is an issue that needs to be addressed at several levels among stakeholders. In some cases, the issues that pertain to their specific constituencies may overlap with each other; however, many perspectives were divergent as illustrated in the previous section of this report. In general, the major themes that emerged from the workshop are as follows:
- Metrics would help illustrate the problem. Despite the divergent needs of the different industry and public interest stakeholder groups as they relate to truck parking, the individual stakeholder representatives demonstrated a good understanding of the issue from the perspectives of the other stakeholders. Even in cases where there may be an underlying difference of opinion on the matter, the stakeholders identified a number of areas where metrics would have applicability for most or all of their constituent groups.
- Data to measure parking is necessary to improve analyses. Data for measuring trucking activity and truck parking are available in a variety of formats from different sources, but processes need to be developed in such a way that models reflect a real-world understanding of the problem and are able to tell the story.
- It is important to understand driver access to parking and to assess it. Truck drivers want access to facilities that are safe and can provide adequate rest. Amenities are also important, but are a secondary consideration. Additionally, parking facilities must be easily accessible from the highway system so a driver can access the facility without losing much time. One major challenge for drivers occurs when they drive in areas that are not familiar to them. There may be available parking nearby, but if a facility is not close to the highway or is not well advertised, those spaces may go unused and the driver is more likely to park on a shoulder or highway ramp. Understanding how and how well drivers are receiving and using information would indicate the effectiveness of efforts to communicate with drivers.
- Address negative perception among the public and policy makers regarding activities at rest stops through measures and data. The perception that crime and other illegal activity is associated with truck parking areas makes it difficult to provide new or expanded facilities in communities. All parties are interested in working to address problems, but additional focus is needed to educate the public and decision makers on the value that trucks have in the economy and the role of parking and staging facilities in the supply chain. Measures could help the public understand the safety aspects of truck facilities and identify the positive impact of improvements.
- Understand and improve the coordination and collaboration of State DOTs and highway safety officials. Both stakeholder groups recognize the need for adequate truck parking in their States, but they do not always work together to quantify or address the problem. Additionally, there is a general feeling that a champion among stakeholders is needed to coordinate and advance the truck parking discussion. Having measures and data helps illustrate the story and gain support for truck parking programs and investment.
- Improve coordination and conversation among government agencies on truck parking. All stakeholders identified a disconnect among different levels of government from the Federal level to local municipalities on the importance of providing adequate truck parking. Metrics help to illustrate need and opportunity.
- Understand regulatory and economic impacts on truck parking. It is necessary to understand how rest needs and requirements align with routing needs in order to identify appropriate siting of truck parking locations.
In addition to the key themes, the workshop participants suggested key measurement areas, which are incorporated in the analysis of the research scan and stakeholder input in the next section.
Analysis of Methodologies and Metrics
There is a significant amount of previous research that correlates to comments and input provided by the STWG identifying categories of measures and metrics that should be considered in developing a system of metrics. At a basic level, metrics can be considered as those that provide information on supply and those that illustrate demand. Basic supply and demand metrics were universally supported in the research and STWG reports. They are being used currently and have the most publicly available and easily obtainable data. However, the STWG decided that the illustration of parking supply and demand should be complemented with additional metric categories where metrics and available data are less developed. While these additional metric categories, such as economic valuation and safety, could be encompassed under supply and demand categories, broadening the categories helps to focus more attention and develop metrics and data to better understand them. Therefore, metric categories highlighted in this report to measure truck parking and to develop the system of metrics later in this section include the following categories:
- Parking Demand – metrics to derive need for parking such as level of truck activity, proximity to highways and suppliers, and origins and destinations.
- Parking Supply – metrics of capacity such as number of spaces, congestion at parking locations, and amenities.
- Economic Valuation – metrics of economic value of spaces, return on investment, and cost-benefit of parking development.
- Safety – metrics of crime and crashes related to parking, availability of safety mechanisms at parking locations, information availability for safe parking, and reports of unofficial parking.
- Driver Demographics and Needs – metrics on types and industry characteristics of drivers and rest requirements by type, driver fatigue, and amenities required.
- Location Dynamics – metrics related to design and accommodation of truck types, ingress and egress, and activity at parking locations.
- Environment – metrics to capture impacts of congestion and delays related to insufficient parking and to capture environmental benefits of supply.
- Development – metrics on public plans including truck parking, planning and zoning issues, incentives for truck parking, and economic benefit.
Research and the STWG further described a need to consider truck parking in a macro sense at the corridor level by understanding origins and destinations so that key corridors and routes where demand exists are revealed and supply can be analyzed. Then, the facilities providing the supply should be analyzed to provide a micro-level sense of supply and demand. The metric categories identified above can be applied at the corridor and facility level with results combined to provide a robust analysis of truck parking needs.
A major challenge relates to the data necessary to calculate the metrics. Again, metrics of supply and demand have been used by stakeholders already, and data for these are more easily obtainable, especially information on origins and destinations, truck activity, areas of overcapacity or illegal or unofficial parking to indicate demand, and metrics on number of spaces, amenities available, and information on public and private locations to indicate supply. Another level of consideration for the system of metrics is whether the metrics are implementable in the present or require data collection and development, anecdotal analysis, or are industry specific and may rely on proprietary data that may be less easy to obtain. For the purpose of the system of metrics developed in this report, the following readiness categories are used:
- Current metrics are those that can be used today with readily available data that are fairly consistent on a national basis. These metrics tend to be those that rely on Federal data resources or State and regional programs.
- Metrics with Data Collection Required are those that would provide accurate and useful measurements related to truck parking on smaller geographic scales, but rely on data resources that are either not currently available or are available from sources that are likely to vary widely across the Nation from one jurisdiction to another.
- Anecdotal metrics are those that do not lend well to direct measurement but instead rely on resources such as driver surveys, periodic stakeholder outreach, and similar data collection efforts.
- Industry-Specific metrics rely on data from specific companies, industries, or industry groups. Some of this information may be proprietary. An example of this type of metric would be a measure of the commercial viability of truck stops at certain locations; this metric would require industry-specific knowledge and expertise that is likely to be found primarily in commercial real estate interests.
As a result of this process, the next section describes a system of metrics to be used to address the identified metric categories at corridor and facility levels, organized by stakeholder group. The system of metrics includes a current or readily implementable system of metrics and an aspirational system of metrics that would require the development of new data and approaches.
Metrics Summary and Recommendations
The following presents the recommended metrics derived from the research and STWG input for this report. The metrics are divided into tiers with Tier I being the foundation level or basic measures from which Tiers II and III can build. Tier I metrics are a simple set of metrics with readily available, easily obtainable data that at a minimum can provide valuable information on the truck parking supply and demand. Tier I metrics are currently in use at the national level and at the State and regional level by stakeholders to consider truck parking needs. Tier II metrics are those that are in use by stakeholders at various levels to further illustrate truck parking needs. Unlike Tier I metrics, these metrics may be more challenging or costly to implement due to data purchasing or the administration of surveys and other tools to collect information. Tier III metrics are metric focus areas that could help to broaden the understanding of truck parking needs but have few or no metrics in use and either limited or no data availability. These metrics need research and development but were identified as important to stakeholders for consideration. Though the purpose of this section is to recommend a system of metrics to evaluate truck parking in each State, all stakeholders can contribute to or utilize these metrics and should continue to work together to develop ways in which the metrics and data can best be advanced to illustrate parking needs.
Additionally, these metrics can be applied at various geographic levels such as nationally or at the State and MPO level by stakeholders evaluating parking. Some metrics lend themselves to a corridor-level analysis while others are most appropriate for a facility-level analysis. In the metric matrices presented below, the measures are presented by measure category and provide information on the metric, data sources, readiness, whether it is a corridor- or facility-based measure, or could be considered for both.
Tier I Metrics
Table 12 summarizes the recommended Tier I metrics. These metrics reflect the most easily implementable metrics to illustrate truck parking needs in that they rely on currently available data sets that are easily obtained. Although much of the data is public, some of the data does come from private sources such as Trucker’s Friend. Additionally, some of these metrics, such as the number of public spaces, rely on survey data, which States keep. In using these metrics, stakeholders will need to consider resources to purchase data and to survey stakeholders.
| Category | Metric | Data Resources | Readiness | Scale |
|---|---|---|---|---|
| Demand | Truck Travel on NHS | HPMS, FAF | Current | Corridor |
| Supply | Number of Spaces, Public and Private | Inventory of states for public spaces and use of private truck stop resource for private data | Current, Requires state data input and purchase of private data | Corridor and Facility |
| Number of Spaces in Relation to NHS Mileage | HPMS mileage for the NHS | Current | Corridor | |
| Number of Spaces in Relation to VMT | HPMS VMT | Current | Corridor | |
| Number of Spaces in Relation to GDP by State | Bureau of Economic Analysis GDP Data | Current | Corridor | |
| FAF = Freight Analysis Framework • GDP = Gross Domestic Product • HPMS = Highway Performance Monitoring System • NHS = National Highway System • VMT = vehicle miles traveled | ||||
Truck travel on the national highway system can be measured using current data resources such as classification counts from the Highway Performance Monitoring System (HPMS) and current and projected truck volumes through the most current iteration of the Freight Analysis Framework (FAF). This information can be organized and summarized on a link-by-link basis for the NHS and will reflect changes over time in general trucking activity.
An inventory of public and private spaces on the NHS would capture the current supply of truck parking spaces in a way that translates well to national, regional, Statewide and corridor-level summaries. This type of data collection, which has been undertaken at a high level as part of this report, tends to be time-consuming and carries some risk of inaccuracy for small off-highway commercial facilities that may change in use over time. State DOTs are strong resources for public facilities, while private publications on truck stops and other facilities and industry groups such as NATSO can provide a fairly accurate representation of private commercial establishments. This inventory should include at least a general description of amenities that are available on-site to motorists to supplement the “driver needs” metric described below.
A calculation of spaces per indicator of truck activity such as NHS mileage, VMT, and GDP by corridor and segment would combine the data from the aforementioned Inventory of Public/Private Spaces with the Truck Travel on the NHS data from the “Demand” metrics to measure the relationship of demand and supply at a meaningful scale.
Tier II Metrics
Tier II metrics are important metrics that can be used to further illustrate the need for truck parking. However, these metrics require additional survey work, development or purchase of data, and more anecdotal research to fulfill. Many of these Tier II metrics are current and are used in a number of national and State research initiatives or programs. These metrics could be used in addition to Tier I metrics as Tier I metrics provide a foundation on which these metrics should be used. Table 13 summarizes the recommended Tier II metrics.
| Category | Metric | Data Resources | Readiness | Scale |
|---|---|---|---|---|
| Demand | Utilization for Public and Private Facilities (hourly, weekly and monthly) | States DOT inventories and surveys; truck stop owner and operators | Data Collection Required | Facility |
| Demand, Driver Demographics and Needs | Parking Needs by Driver Type | Driver Surveys | Anecdotal | Facility |
| Demand, Driver Demographics and Needs | Parking Needs by Industry Represented | Driver Surveys | Anecdotal | Facility |
| Demand, Economic | Origin and Destination Information | FAF/CFS/Use of Vehicle Probe Data | Current for FAF and CFS, Use of FPM requires additional analysis | Corridor and Facility |
| Demand, Safety | Inventory of Problem Locations | Interviews with state motor carrier safety staff | Current | Corridor and Facility |
| Economic Valuation, Demand, Supply, Development | Proximity to Industry and Highway Facilities | GIS shape files for parking locations; industrial locations; travel time data | Current and Data Collection Required | Corridor, Facility |
| Safety | Hours of Service Violations | State DOT and Police Records | Current | Corridor, Facility |
| Safety | Fatigue Related Crashes | State DOT and Police Records | Current | Corridor |
| Supply | Amenities at Parking Facilities | State DOT and Truck Stop Owners and Operators Survey Data | Current and Data Collection Required | Facility |
| Supply | Inventory of Driver Perceived Shortages, Parking Challenges | Driver Surveys | Anecdotal | Corridor, Facility |
| CFS = Commodity Flow Survey • DOT = department of transportation • FAF = Freight Analysis Framework • GIS = geographic information system • FPM = Freight Performance Measures | ||||
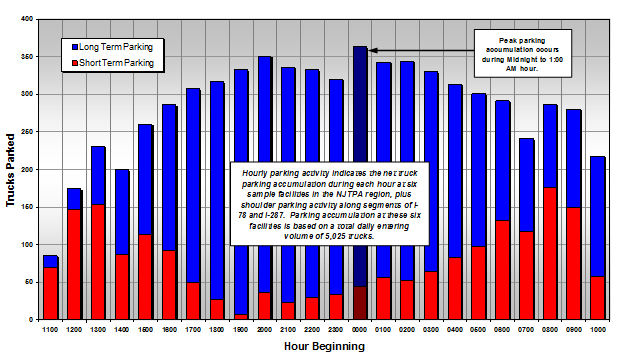
Figure 35. Twenty-four Hour Parking Accumulation Profile
Time-of-day utilization by facility will provide an indication of how truck parking activity changes by time of day for different facility types and geographic areas. This is the only measure of parking demand that involves existing parking facilities; the temporal distribution of truck parking at these facilities over a day or week is considered to be indicative of parking needs associated with latent parking demand measured using other resources. Ideally, a week-long or 24-hour parking profile can be obtained for every parking facility in the Nation. However, previous studies that applied this temporal distribution to an analytical process were conducted using representative temporal profiles at representative locations.
Parking needs by driver type and industry sector can only be effectively measured through an active, and consistent, outreach effort to the driving industry. Periodic surveys are recommended to identify a wide range of issues for commercial drivers across multiple geographic levels, including problem locations, need for amenities, parking needs by industry subsector, impacts of regulatory changes over time, safety issues, impacts of shipper/receiver operations on parking needs, etc.
Origin-destination pairs can be obtained from a variety of sources. At a macro level, FAF data is useful for understanding mega-regional and national origins and destinations. To understand more localized origins and destinations, the Commodity Flow Survey (CFS) results, truck probe data, and resources from various economic analysis firms providing freight flow and economic data derived from shippers and carriers can be used. This information would identify concentrations of trip ends for truck trips, making it a good surrogate to identify centers of industrial activity (at trip origins) and warehousing and retail destinations (at trip destinations). Truck trip ends are a critical aspect of parking demand, particularly at destinations. Parking activity at destination points tends to be a more important consideration because drivers do not typically stop to meet rest requirements at the start of a trip and because the short-term staging of trucks associated with warehouse or terminal hours of operation occurs at delivery locations, not trip origins.
Problem locations identified by DOTs and law enforcement are a good anecdotal measure of chronic problems associated with truck parking and their associated safety risks. These could be geographic areas, highway corridors, or even specific roadway segments where illegal parking or other symptoms of insufficient parking capacity are observed. This information requires ongoing outreach to the public agencies involved in these enforcement efforts, and conducting this outreach uniformly across the Nation to yield meaningful measures can be difficult and costly.
Proximity of parking locations to highways and shippers is a valuable body of information, but does not need to be documented separately because it can be calculated, derived, displayed and measured through a combination of other data resources that are either readily available (e.g., the geo-referenced data layer for the NHS and public/private parking facility locations) or are listed elsewhere in this section as recommended metrics (e.g., industrial parcels, employment for truck-intensive industries on a municipal or parcel level).
Reported hours-of-service violations may be an indicator of truck parking in an area that is either insufficient in quantity or inadequate by some other standard (poor location, real or perceived safety risk, etc.) for trucking operators. Violation records from law enforcement are usually readily available, but there is a data collection element to this metric because staffing levels and other factors among law enforcement departments from different States are likely to introduce a degree of inconsistency between reported and actual violations in a given State.
Fatigue-related crashes involving trucks are not necessarily indicative of a parking problem, but on broad geographic scales and over long periods of time the changes in these crash rates may be reasonably used as a symptom of the problem as it pertains to motor vehicle safety.
The documentation of amenities by location complements the parking needs by driver type and industry sector metric in that it reflects services, infrastructure, and driver amenities beyond truck parking spaces at public rest facilities and private commercial establishments. This metric relates to the ability of these facilities to meet driver needs rather than measuring driver needs directly. The collection of this type of information would typically require extensive periodic data collection and inventories of existing facilities, but much of the information is available through proprietary third-party resources such as the 2015 Trucker’s Friend database discussed in Section II.
Driver-perceived shortages and challenges help to illuminate the issues from the user perspective and provide anecdotal information about where there are supply issues. Anecdotal information helps to identify more about the capacity issues identified in quantitative analysis of spaces and truck activity and helps to better explain why there is a shortage or need and what may be the best strategies to remedy the issues.
Tier III: Recommendations for Aspirational Metrics
A number of the Tier III metrics, which are listed in Table 14, would be valuable resources for measuring truck parking adequacy over time, but are not included in the list of recommended metrics because the data for these metrics are either not readily available or are available from local sources and cannot currently be applied across multiple government jurisdictions. As data resources may become refined over time and uniform data sets from all States may become available, these metrics should be incorporated into the ongoing measurement of truck parking adequacy.
| Category | Metric | Data Resources | Readiness | Scale |
|---|---|---|---|---|
| Demand | Impact of Congestion on Travel Time and Resulting Driving Distance, Need for Parking | Corridor and congestion studies; traffic monitoring sites | Current and Data Collection Required – Metric Approach Needed. | Corridor, Facility |
| Driver Demographics and Needs, Demand | Average Haul Length/ Multi-Day versus Single-Day | Freight data summaries prepared by professional organizations | Anecdotal | Corridor, Facility |
| Driver Demographics and Needs, Demand | Use of Technology to Determine Parking Availability | Survey of truck stop operators | Anecdotal | Corridor, Facility |
| Economic Valuation, Development | Return on Investment for Parking Development | Survey of truck stop operators | Data Collection Required | Facility |
| Economic Valuation, Development | Optimization of Return on Investment | Survey of truck stop operators | Data Collection Required | Facility |
| Economic Valuation, Development | Business Locations, Industrial Land Uses | Local economic development agency reports | Data Collection Required | Corridor, Facility |
| Economic Valuation, Development | Employment by Industry for Truck Facilities | Federal and state employment data | Data Collection Required | Corridor, Facility |
| Economic Valuation, Development | Diesel Fuel Sales | Federal and state taxing authorities | Current - Metric Approach Needed | Facility |
| Economic Valuation, Development, Location Dynamics | Parcel Size and Zoning | Local land use plans | Data Collection Required | Facility |
| Environment, Development | Environmental Impact Metrics (i.e. Air Quality/Idle Reduction, Parking Development) | State and local air quality monitoring agencies | Data Collection Required | Corridor, Facility |
| Safety | Crime Reports by Location | State and local law enforcement records | Data Collection Required | Facility |
| Safety | Reported Parking Violations on NHS | State and local law enforcement records | Data Collection Required | Corridor |
| Safety | Fixed-Object Crashes with Trucks on Highway Shoulders | State and local crash data bases | Data Collection Required | Corridor |
Corridor and congestion studies; traffic monitoring sites Freight data summaries prepared by professional organizations Survey of truck stop operators Survey of truck stop operators Survey of truck stop operators Local economic development agency reports Federal and state employment data Federal and state taxing authorities Local land use plans State and local air quality monitoring agencies State and local law enforcement records State and local law enforcement records State and local crash data bases
Impact of congestion on travel time and driving distance is somewhat redundant with truck travel on the NHS. The FAF, Freight Performance Measures (FPM), and MPO models and HPMS data include considerations for congested travel time. Identifying the impacts of congestion on truck parking demand is a useful tool for corridor-level analyses and for specific origin-destination pairs. On a high level, a national or regional metric of mobility degradation over time could be used to estimate increases in truck parking demand that might result from increased congestion. For example, a reduction of average travel speed from 50 mph to 40 mph on a multi-day trip between an origin and destination would effectively reduce the daily range of a driver operating within an 11-hour driving window from 550 to 440 miles, thereby increasing the parking demand at certain points along the route.
Average haul length is a surrogate indicator of changing profiles of the trucking industry. Longer trips correspond to higher parking demand associated with rest requirements under FMCSA HOS rules. The data for this metric would be obtained from trucking industry publications, along with the FAF, Container Freight Station (CFS), and truck probe data described previously for origin-destination pairs.
Use of technology among drivers is a valuable metric for determining the receptivity of commercial drivers to traveler information about parking availability. It does not stand alone as a metric related to adequacy, but can be used to determine the feasibility of strategies related to real-time parking information to maximize the utilization of parking facilities.
The proposed metrics related to real estate values and business needs of the commercial truck stop industry are valuable resources for identifying regions, corridors, and specific sites for potential new or expanded parking facilities. These metrics include:
- Return on investment (ROI) for parking facilities and spaces and optimization of ROI. One major challenge for these metrics is that the private truck stop industry is the best resource for this information but would consider the information proprietary for planning their own business ventures. Also, the nature of any financial assessment of the commercial viability of an existing or proposed site is that the value of the property, the cost of operating a business establishment, and the customer profile might orient these metrics in a way that reduces the feasibility of truck parking. This would be the case in an area where the owner of an off-highway truck stop might consider expanding the retail space on the site by reducing the truck parking capacity, or might expand auto parking at the expense of truck parking to serve a different customer type. These metrics, or similar measures that can be used to assess the viability of a region or corridor for new, expanded, or enhanced truck parking facilities, should be developed through close collaboration with the private truck stop industry.
- Business location data / industrial land uses are an excellent resource for identifying truck-intensive land uses (e.g., manufacturing, warehousing and distribution centers, retail, mining, agriculture, etc.). Ideally this information would be used at a property or parcel level across all States and municipalities, but this type of data is not available on a national level in a consistent format that would lend well to analyses on that scale. Public resources such as the U.S. Census Bureau, Bureau of Economic Analysis, and proprietary data available from resource such as ESRI® could be used to identify these industry types at the municipal or zip code level. This information could be supplemented by geo-referenced data for employment by industry for truck facilities to provide a similar measure of freight-intensive land uses.
- Diesel fuel sales do not directly correlate with truck parking demand, especially at smaller geographic scales. But national and regional sales figures can be a good surrogate indicator of overall trucking activity that might reasonably reflect general changes in parking demand over time.
- Parcel size and zoning is a good metric for identifying the suitability of properties for new or expanded truck parking facilities. This metric would be used to identify parcels with industrial zoning that meet a minimum size requirement (e.g., 10 acres or larger) that might be suitable for a parking project. Obtaining uniform data on a national level is challenging, but this metric could be applied on a local or regional level.
- Environmental impacts and benefits are most useful in helping to document impacts and benefits of new or expanded parking facilities. They may be of limited value in measuring parking supply or demand over time, but they would be useful in developing public-private partnerships, funding analyses, or for any environment-related analytical requirements.
- Crime reports by location are an excellent resource to identify parking adequacy from the standpoint of the personal safety of drivers and the security of their loads. This is difficult to measure because very few jurisdictions report crimes separately for commercial drivers compared to the public at large.
- Reported parking violations on the NHS can be used to identify locations of overflowing parking facilities and facilities that are considered inadequate or unsafe by drivers. This is a challenging metric to use on a national level because there is a wide range of enforcement emphasis among various police departments for these parking violations. This relates to the “law enforcement dilemma” described previously in the introductory section of this report.
- Fixed-object crashes with trucks on highway shoulders are an indicator of both motorist fatigue and illegal parking. This metric would be useful for identifying locations of insufficient parking on a corridor or regional level. However, current law enforcement practices in most States do not allow these types of crashes to be categorized separately except through a manual review of accident records.
Other Metrics
The metrics listed below are not recommended for further pursuit or utilization in measuring and documenting truck parking needs and issues at this time. These typically include proposed metrics that are either redundant with other metrics or are not deemed to have a sufficient correlation with truck parking supply, demand or other characteristics. A summary of these is as follows:
- Truck percentage of average annual daily traffic (AADT) is a useful metric, but does not need to be categorized separately because the key piece of information it provides – truck volumes by segment or corridor – is already encapsulated in the truck travel on the National Highway System metric.
- Temporal truck volume in peak hours is useful for a number of operational analyses related to the trucking industry, but it likely has limited relevance for truck parking activity because of a lack of direct correlation between the temporal distribution of truck volumes and latent truck parking demand (i.e., peak truck parking demand in most regions and corridors occurs during overnight hours when truck volumes on the highway system are lowest).
- Forecast tools for truck travel represent future-year scenarios for the information described previously in the truck travel on the NHS metric. Because resources and tools such as FAF and MPO models are already used to develop forecasts of truck travel, there is no need to document this as a separate metric.
- Delays due to recurring congestion is a redundant measure for the impact of congestion on travel time and driving distance metric, which is discussed in the “Tier III: Aspirational Metrics” section.
- Locations of highway bottlenecks are important for operational analysis, but they are of limited value for measuring truck parking demand. For one thing, congestion-related delays will impact parking demand on a system-wide basis by effectively reducing travel distance within a driver’s duty window, but not only in the vicinity of the actual location of the bottleneck. Secondly, the impacts of congestion are already incorporated in other metrics such as the truck travel on the NHS and the impact of congestion on travel time and driving distance metrics.
- Distance traveled by time of day is a useful metric for truck operations in scheduling optimal departure times for long truck trips, but would be of limited use in measuring adequacy of truck parking due to the nearly unlimited combination of origin-destination pairs for truck trips across the United States. This measure is best used on a case study basis to identify driving distances, tied to FMCSA HOS limits, by time of day for specific origin-destination pairs along heavily traveled truck corridors.
- Safety and Security of assets by facility is a good metric for measuring the adequacy of truck parking from a standpoint of personal safety of the drivers and the security of truck cargo. Rather than list this as a separate metric, it would be more practical to fold this information as one of the items in the inventory of public and private spaces on the NHS metric that has been described previously. This would also apply to the amenities by location metric; there is no need to list this as a separate metric if the inventory of truck parking spaces is sufficiently comprehensive to account for these amenities.
- Economic value of parking facilities is difficult to measure from a public perspective, but would be of value to the commercial truck stop industry for its own business operations. As a metric for system-wide truck parking characteristics, this metric would not provide any information beyond what would already be available in metrics such as parcel size and zoning and employment by industry for truck facilities.
- Tax or financial incentives for truck parking can help identify locations where expansion of truck parking capacity may be economically feasible, but is not effective in measuring latent demand, parking supply, or parking adequacy. This would also apply to the funding levels for truck parking projects metric. Other metrics such as those related to land use or industrial employment are better measures of actual locations where truck parking demand is heaviest and where new parking capacity is feasible.
- Other measures related to general trucking activity, which include ratio of trailers per tractor, and heavy truck sales (day cab vs. sleeper cab) can be used to do a high-level calibration or cross-check of other metrics related to truck parking, but do not relate to truck parking directly. This information can be obtained periodically for comparison purposes to see if these figures are relatively consistent with other adequacy metrics proposed here. For example, if heavy truck sales or sleeper cab sales increase 10 percent over a period of time, has there also been a corresponding 10 percent increase in latent parking demand, truck-miles-traveled on the NHS, parking capacity at public and private facilities, and more?
Beyond Implementing the Metrics
Recommendations proposed as a result of the STWG input are listed below. This is not a prioritized list, but provides guidance for the enhancement of the data summaries developed in this study and the proposed set of metrics for measuring the adequacy of truck parking over time. These recommendations are as follows:
- Conduct periodic State inventories of public truck parking spaces at an interval of every 3 to 5 years to understand parking needs. Further research may identify opportunities for a uniform reporting template that could include, at a minimum, location (route/milepost and geographic coordinates) and number of spaces, while additional information about on-site amenities, peak (overnight) utilization and, perhaps, some information about temporal (time-of-day and seasonal) variations would be preferred.
- Develop a consistent set of standards for documenting illegal truck parking activity, “truck parking hot spots,” and a level of frequency for this type of assessment. This could be based on crash reports, violations, observations by law enforcement, or a combination of these.
- Acquire and use private truck stop data on a continuous basis to better inform evaluation processes and help identify changes in these facilities over time.
- Understand truck parking behavior and needs at the national level and have State and regional inputs feed into the national analysis.
- Develop a land use inventory approach or resource to measure truck-intensive land uses. This would be useful to measure such land uses on a uniform basis across the entire country, at the parcel level if possible. This resource could address the data needs for some of the metrics described in this study that are aspirational and may include industry-based employment and land use or zoning data for facilities engaged in manufacturing, warehousing, retail and other truck-intensive business activities. This data resource could include public data from sources such as the U.S. Census Bureau and BEA as well as proprietary databases from D&B/Hoover’s, Woods & Poole, etc.
- The STWG could be continued with periodic workshops and information-sharing sessions similar to the Truck Parking Metrics Workshop conducted as part of this study. Future activities of the STWG could include the development and refinement of metrics documented in this report as advances in technology and new data resources provide additional opportunities for collecting and sharing data. These workshops can be conducted in conjunction with other events of national interest (Transportation Research Board meetings, for example) or at industry-specific events hosted by the five major agency and industry groups.