Status of the Nation's Highways, Bridges, and Transit Conditions and Performance: 23rd Edition: Part III: Highway Freight Transportation - Report to Congress
Executive Summary
Chapter 12: Conditions and Performance of the National Highway Freight Network
The Fixing America's Surface Transportation (FAST) Act designated the National Highway Freight Network (NHFN) and established a national policy of maintaining and improving the conditions and performance of this new network. Furthermore, it required the development of a regular report on the conditions and performance of the NHFN. This chapter serves as the first of these reports.
Conditions
In 2012, the NHFN consisted of 51,029 centerline miles, including 46,947 centerline miles of Interstate and 4,082 centerline miles of non-Interstate roads. Based on 2014 international roughness index (IRI) data from the Highway Performance Monitoring System (HPMS), approximately 77 percent of pavement miles were rated as having good ride quality, 19 percent had fair ride quality, and 4 percent had poor ride quality.
Pavement Ride Quality (IRI) Based on Mileage on NHFN
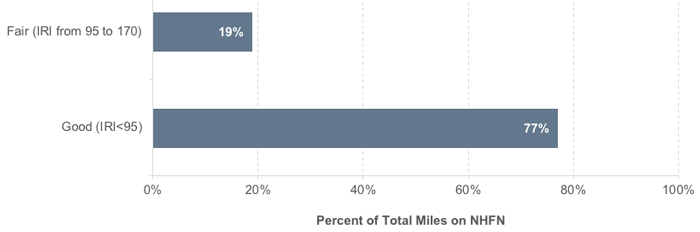
Source: IRI data in 2014 HPMS files.
The National Bridge Inventory (NBI) is used to identify current bridge ratings for bridges on the NHFN. This analysis showed there are approximately 57,600 bridges on the NHFN. Around 4.3 percent of those bridges were rated as structurally deficient. Most of these structurally deficient bridges are 25 years and older, and over half are more than 50 years old. These findings have implications for future maintenance and funding needs as well as impacts to operations.
Age of Structurally Deficient Bridges on NHFN, 2014
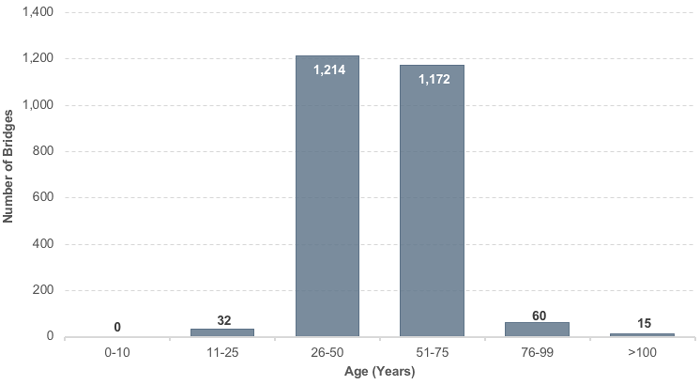
Source: Bridge condition data contained in 2014 NBI files.
Performance
Travel time, speed, and safety are three measures of performance. Slower speeds and unreliable travel times caused by congestion increase fuel cost and affect operations and productivity, which adds expense to the freight transportation system. In 2014, congestion created stop-and-go conditions on 5,800 miles of the NHFN and caused traffic to travel below posted speed limits on an additional 4,500 miles of the high-volume truck portions of the NHFN. The projected growth in freight and its reliance on trucks will increase congestion and make it more difficult and costly to move freight.
A total of 3,633 fatal crashes occurred on the Interstate portion of the NHFN in 2014, resulting in 4,094 fatalities. In 2015, fatal crashes and fatalities increased by 5.7 percent and 6.1 percent, respectively.
previous | next