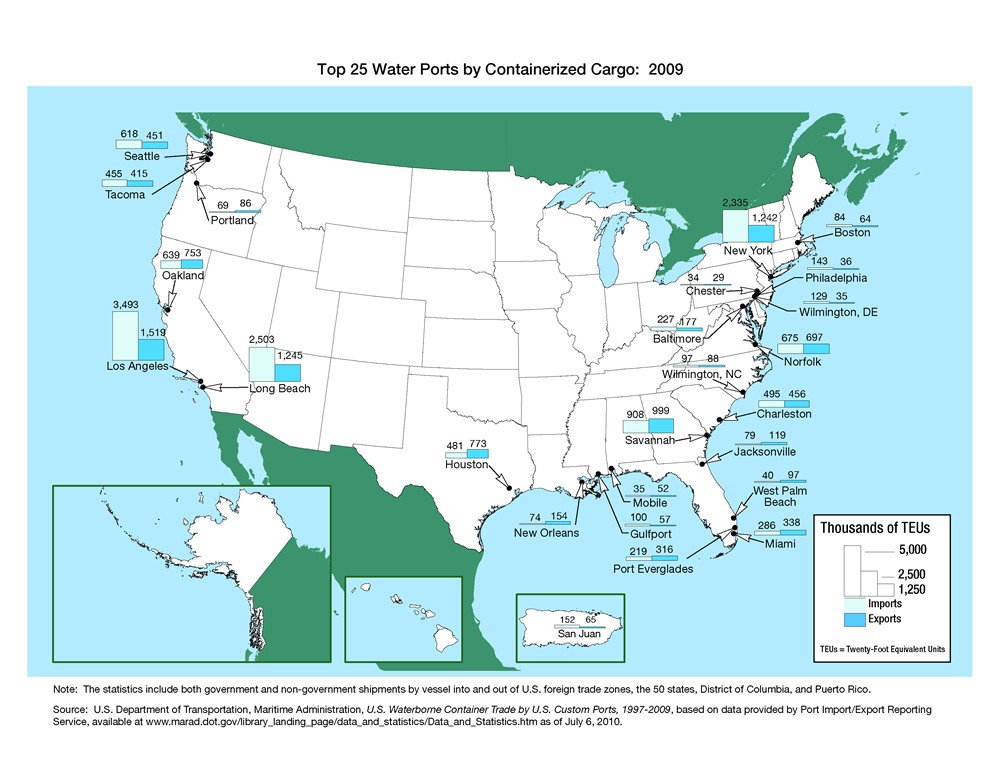
Top 25 Water Ports by Containerized Cargo: 2009 Map
High-Resolution Images
Note
The statistics include both government and non-government shipments by vessel into and out of U.S. foreign trade zones, the 50 states, District of Columbia, and Puerto Rico.
Source
U.S. Department of Transportation, Maritime Administration, U.S. Waterborne Container Trade by U.S. Custom Ports, 1997-2009, based on data provided by Port Import/Export Reporting Service, available at http://www.marad.dot.gov/library_landing_page/data_and_statistics/Data_and_Statistics.htm as of July 6, 2010.
![]() You will need the Adobe Reader to view the PDFs on this page.
You will need the Adobe Reader to view the PDFs on this page.