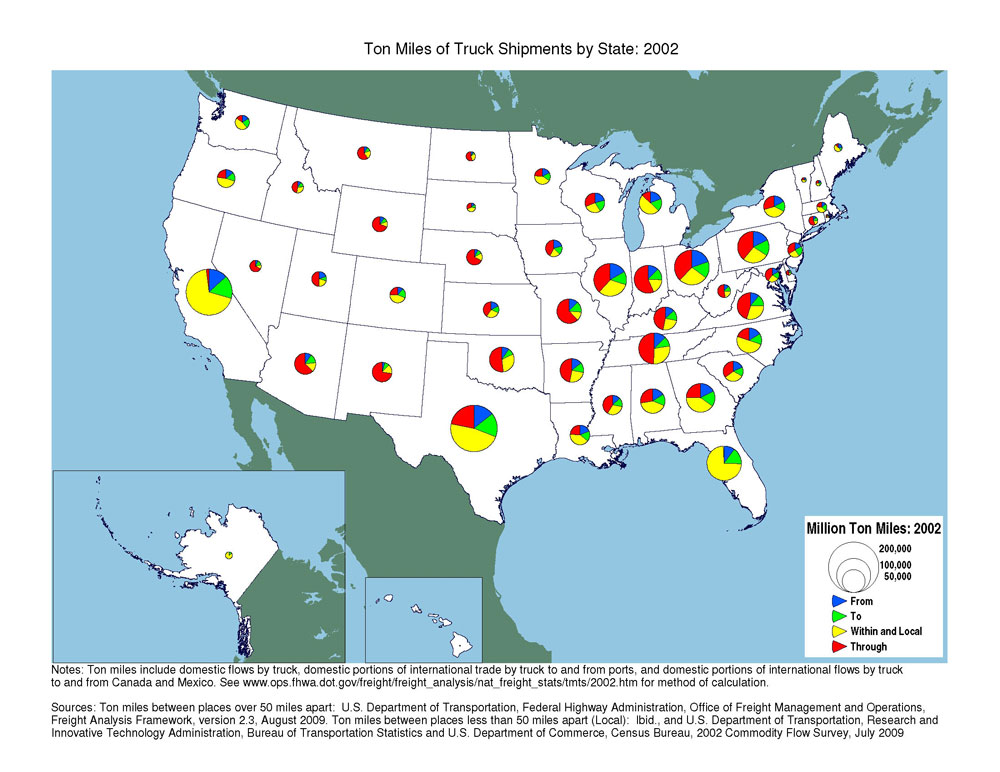
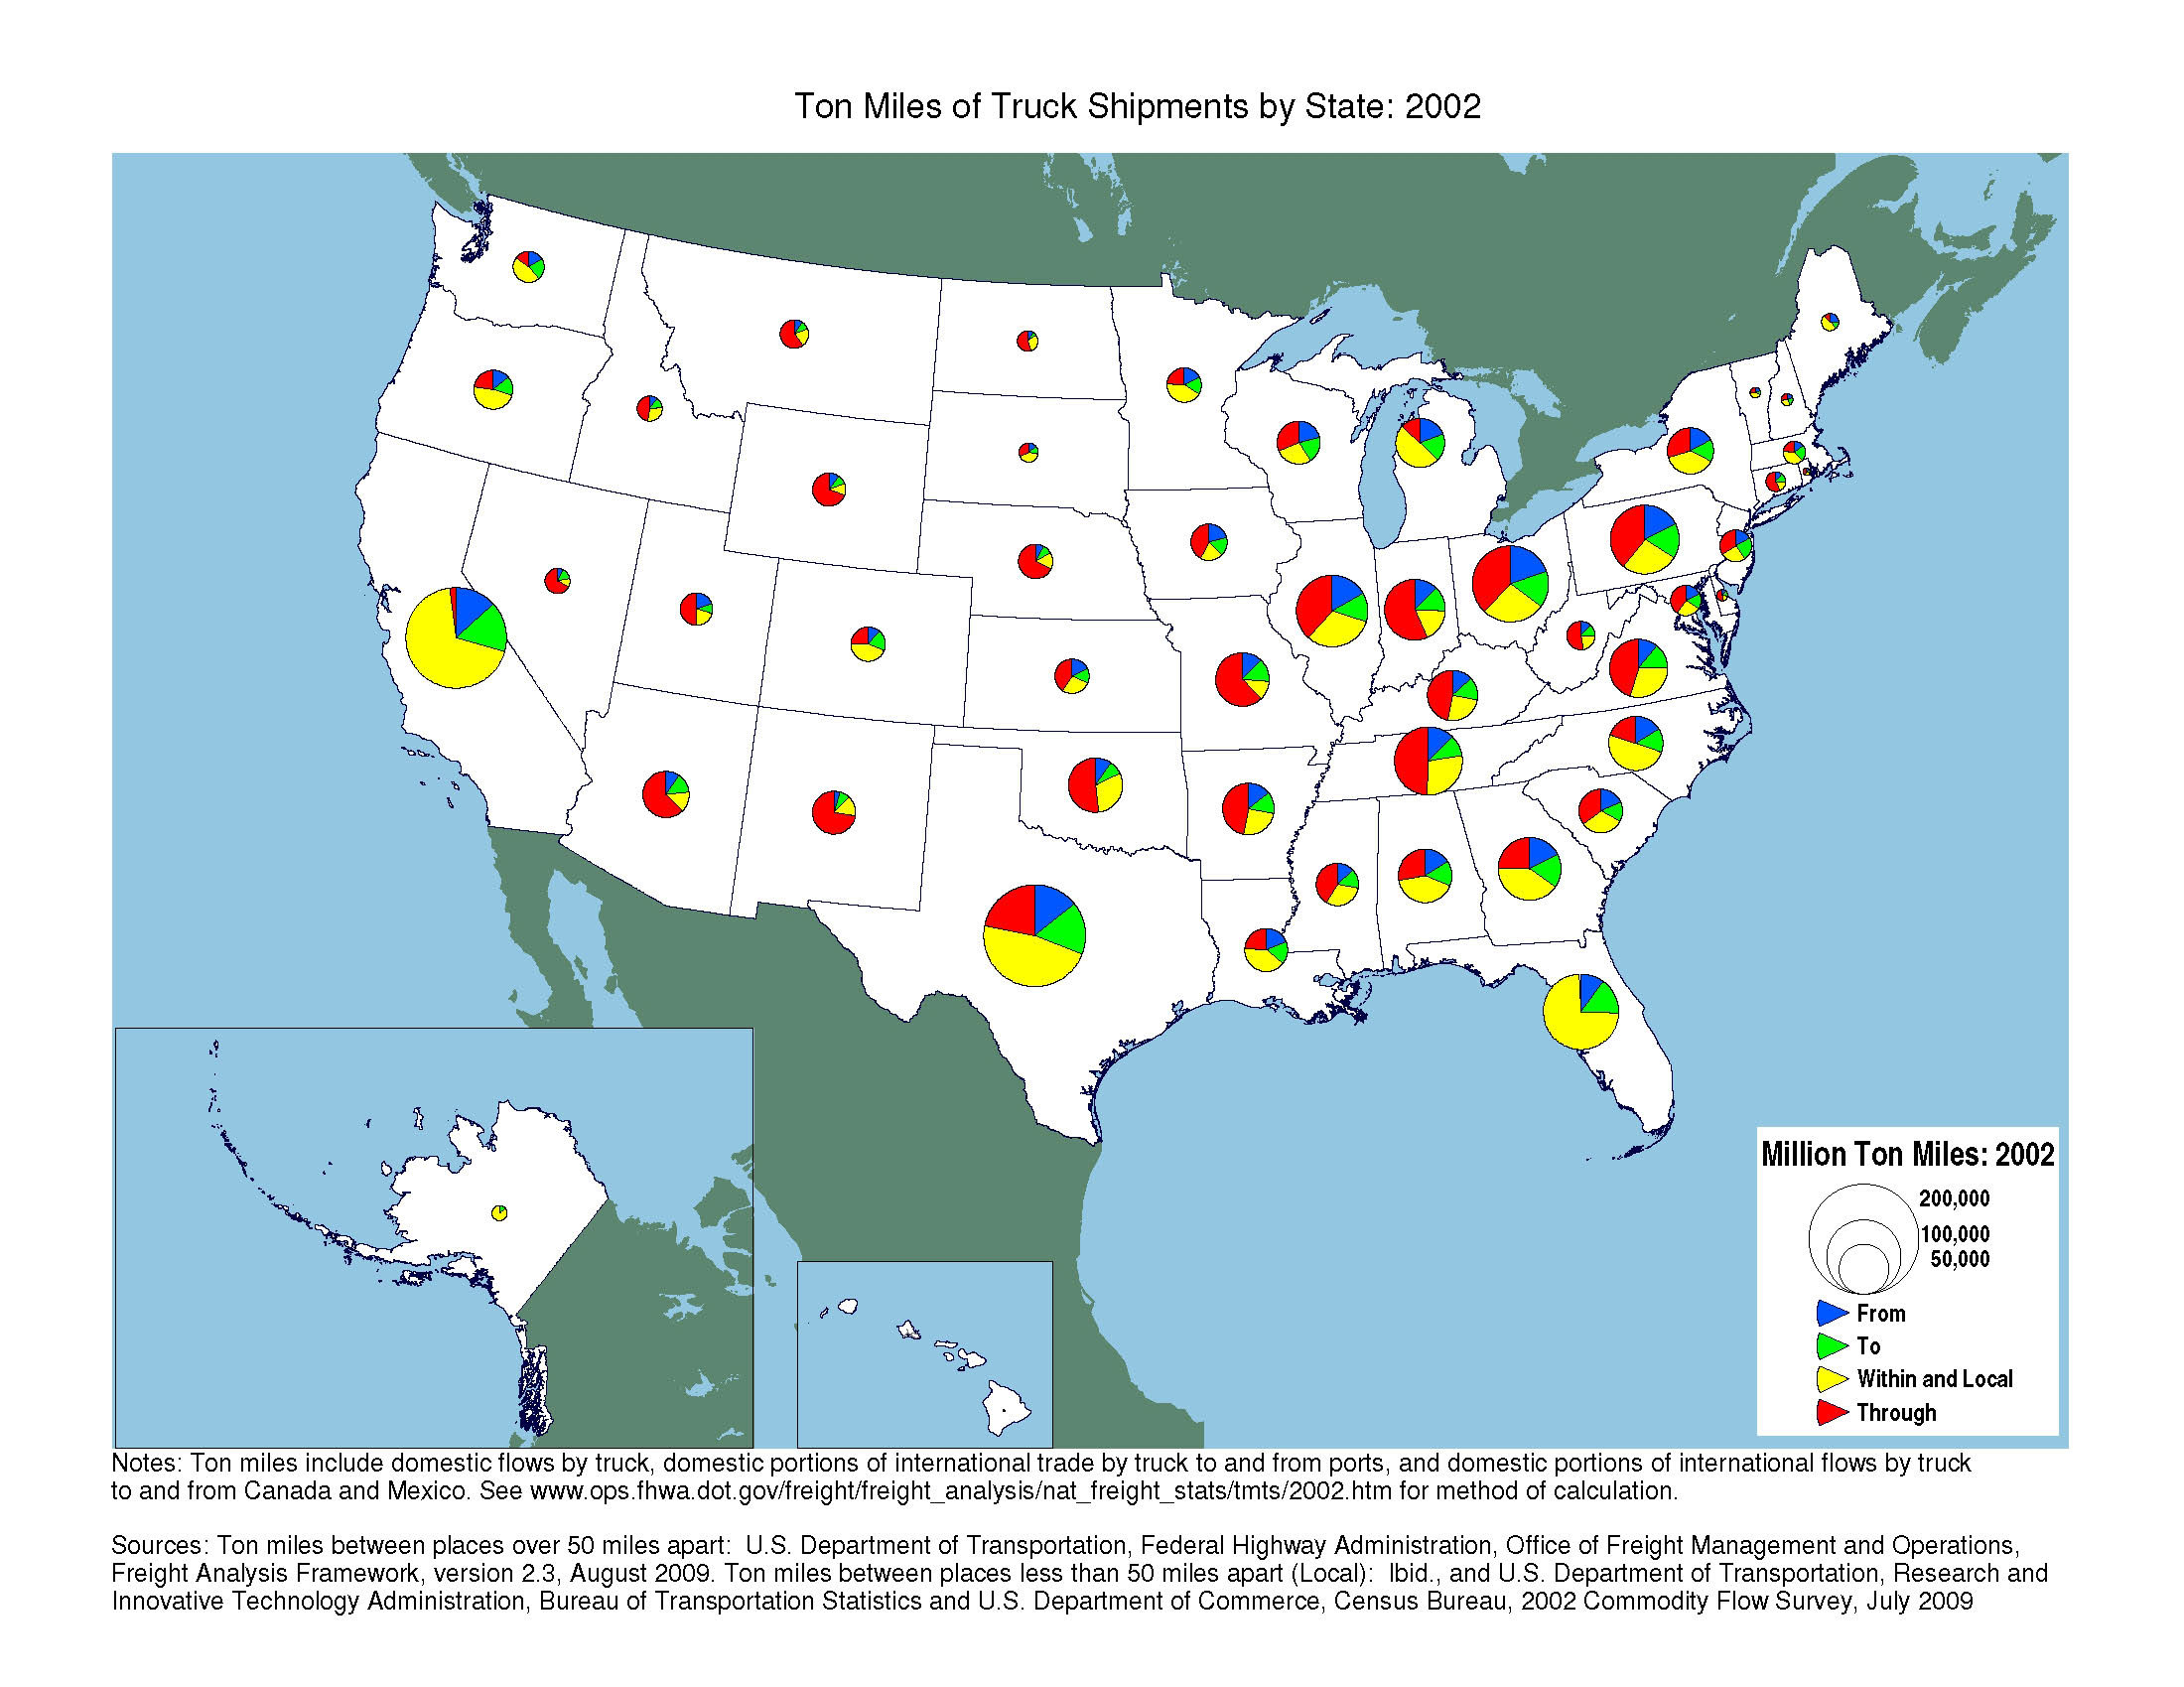
Ton-Miles of Truck Shipments by State: 2002 Map and Data Table
High-Resolution Images
Data Represented in the Map
Table in Excel format, 35KB
| State | Leaving | Entering | Within | Local | Through | Total |
|---|---|---|---|---|---|---|
| Alabama | 9,021 | 8,491 | 22,871 | 227 | 15,612 | 56,221 |
| Alaska | 70 | 1,165 | 6,745 | 53 | 0 | 8,033 |
| Arizona | 4,297 | 6,084 | 5,798 | 470 | 27,495 | 44,144 |
| Arkansas | 7,567 | 7,039 | 13,191 | 77 | 24,661 | 52,535 |
| California | 22,584 | 27,560 | 114,709 | 1,847 | 3,545 | 170,246 |
| Colorado | 3,118 | 5,088 | 11,234 | 200 | 6,471 | 26,111 |
| Connecticut | 1,082 | 1,493 | 1,494 | 172 | 5,509 | 9,751 |
| Delaware | 441 | 564 | 589 | 94 | 1,915 | 3,603 |
| District of Columbia | 9 | 36 | 2 | 5 | 116 | 168 |
| Florida | 10,371 | 15,835 | 74,428 | 936 | 905 | 102,475 |
| Georgia | 13,054 | 13,045 | 30,039 | 242 | 18,433 | 74,814 |
| Hawaii | 0 | 0 | 0 | 17 | 0 | 17 |
| Idaho | 1,539 | 2,034 | 2,933 | 1,389 | 6,992 | 14,887 |
| Illinois | 15,828 | 12,298 | 29,653 | 262 | 35,928 | 93,969 |
| Indiana | 9,104 | 9,129 | 12,598 | 17 | 40,183 | 71,031 |
| Iowa | 6,062 | 4,930 | 5,652 | 201 | 12,278 | 29,122 |
| Kansas | 4,665 | 3,761 | 7,182 | 152 | 10,824 | 26,585 |
| Kentucky | 6,831 | 7,417 | 12,634 | 188 | 23,849 | 50,919 |
| Louisiana | 7,386 | 6,620 | 15,381 | 91 | 9,312 | 38,791 |
| Maine | 2,119 | 956 | 3,647 | 280 | 1,025 | 8,026 |
| Maryland | 3,897 | 3,450 | 5,337 | 151 | 8,557 | 21,392 |
| Massachusetts | 1,838 | 2,839 | 4,452 | 353 | 2,885 | 12,367 |
| Michigan | 9,447 | 8,797 | 23,751 | 432 | 6,507 | 48,934 |
| Minnesota | 4,579 | 4,250 | 10,915 | 40 | 6,261 | 26,046 |
| Mississippi | 5,129 | 5,329 | 11,470 | 358 | 15,528 | 37,815 |
| Missouri | 7,148 | 7,887 | 6,770 | 18 | 35,474 | 57,297 |
| Montana | 1,859 | 1,741 | 3,832 | 36 | 11,049 | 18,517 |
| Nebraska | 2,045 | 2,356 | 3,709 | 408 | 17,549 | 26,067 |
| Nevada | 1,137 | 2,210 | 1,707 | 57 | 10,205 | 15,315 |
| New Hampshire | 857 | 873 | 917 | 297 | 1,149 | 4,093 |
| New Jersey | 3,822 | 5,319 | 5,674 | 60 | 7,567 | 22,442 |
| New Mexico | 1,710 | 3,098 | 5,390 | 376 | 27,881 | 38,455 |
| New York | 7,527 | 6,938 | 16,164 | 380 | 12,990 | 43,999 |
| North Carolina | 9,468 | 8,354 | 29,062 | 23 | 11,675 | 58,582 |
| North Dakota | 1,063 | 615 | 2,518 | 544 | 5,791 | 10,531 |
| Ohio | 20,485 | 16,249 | 27,478 | 618 | 39,260 | 104,089 |
| Oklahoma | 5,701 | 4,815 | 17,247 | 353 | 30,210 | 58,326 |
| Oregon | 4,734 | 5,156 | 15,432 | 224 | 7,525 | 33,070 |
| Pennsylvania | 15,360 | 14,528 | 23,501 | 62 | 34,332 | 87,783 |
| Rhode Island | 264 | 195 | 232 | 270 | 700 | 1,662 |
| South Carolina | 7,309 | 5,642 | 12,524 | 26 | 13,833 | 39,335 |
| South Dakota | 1,361 | 1,208 | 3,416 | 431 | 2,917 | 9,332 |
| Tennessee | 10,875 | 8,480 | 23,140 | 1,064 | 42,170 | 85,729 |
| Texas | 25,061 | 29,114 | 82,239 | 181 | 38,349 | 174,944 |
| Utah | 4,560 | 2,247 | 4,894 | 62 | 11,475 | 23,238 |
| Vermont | 706 | 462 | 1,184 | 296 | 859 | 3,507 |
| Virginia | 7,273 | 8,833 | 19,649 | 347 | 29,789 | 65,890 |
| Washington | 3,691 | 4,934 | 10,078 | 25 | 3,285 | 22,013 |
| West Virginia | 2,341 | 2,400 | 3,835 | 252 | 9,842 | 18,671 |
| Wisconsin | 8,230 | 7,661 | 10,787 | 13 | 12,102 | 38,793 |
| Wyoming | 2,522 | 2,195 | 2,530 | 312 | 16,915 | 24,474 |
Notes
Ton miles include domestic flows by truck, domestic portions of international trade by truck to and from ports, and domestic portions of international flows by truck to and from Canada and Mexico. See below for method of calculation.
Sources
Ton miles between places over 50 miles apart: U.S. Department of Transportation, Federal Highway Administration, Office of Freight Management and Operations, Freight Analysis Framework, version 2.3, August 2009. Ton miles between places less than 50 miles apart (Local): Ibid., and U.S. Department of Transportation, Research and Innovative Technology Administration, Bureau of Transportation Statistics and U.S. Department of Commerce, Census Bureau, 2002 Commodity Flow Survey, July 2009.
Methods
Ton miles for shipments by truck among places at least 50 miles apart are estimated by assigning flows in the Freight Analysis Framework (FAF) to the network as described in Freight Traffic Analysis. Local ton miles for shipments by truck among places less than 50 miles are estimated by multiplying the FAF tonnage originating in the state that was not assigned to the network by the ratio of ton miles to tons for shipments less than 50 miles in the 2002 Commodity Flow Survey. The ratio of ton miles to tons is the average distance traveled weighted by the weight of the shipments. The average for the United States was substituted for Minnesota, which has suppressed values in the 2002 Commodity Flow Survey.
Ton miles of local truck traffic between places less than 50 miles apart are counted with the state or origin. While some local traffic crosses state lines, the ton miles are very small and nationwide data to allocate that local traffic to the TO and FROM categories for each state are not available.
Truck movements carrying international trade to and from ports are assumed to originate or end at the ports, while truck movements carrying international trade across land borders are assumed to originate or end in Canada and Mexico. If all international trade was treated the originating or terminating in foreign countries, the totals for each state would not change since only the domestic portions of international flows are counted. Shares of ton miles entering, leaving, within, and through would change for the following states:
| State | Leaving | Entering | Within | Local | Through | Total |
|---|---|---|---|---|---|---|
| Alabama | 8,627 | 8,050 | 21,203 | 227 | 18,114 | 56,221 |
| Alaska | 1,948 | 676 | 4,773 | 53 | 583 | 8,033 |
| California | 24,355 | 25,860 | 107,056 | 1,847 | 11,128 | 170,246 |
| Connecticut | 1,116 | 1,410 | 1,364 | 172 | 5,688 | 9,751 |
| Delaware | 497 | 549 | 513 | 94 | 1,949 | 3,603 |
| Florida | 11,965 | 14,786 | 69,010 | 936 | 5,778 | 102,475 |
| Georgia | 12,780 | 12,590 | 28,824 | 242 | 20,378 | 74,814 |
| Louisiana | 11,190 | 5,339 | 8,578 | 91 | 13,593 | 38,791 |
| Maine | 2,115 | 1,154 | 3,435 | 280 | 1,042 | 8,026 |
| Maryland | 3,535 | 3,324 | 5,103 | 151 | 9,279 | 21,392 |
| Massachusetts | 1,874 | 2,720 | 4,264 | 353 | 3,157 | 12,367 |
| Mississippi | 5,385 | 5,045 | 10,924 | 358 | 16,103 | 37,815 |
| New Hampshire | 899 | 855 | 859 | 297 | 1,183 | 4,093 |
| New Jersey | 3,698 | 4,971 | 5,571 | 60 | 8,140 | 22,442 |
| New York | 8,208 | 6,608 | 15,023 | 380 | 13,780 | 43,999 |
| North Carolina | 9,524 | 8,190 | 28,636 | 23 | 12,210 | 58,582 |
| Oregon | 4,949 | 4,683 | 14,909 | 224 | 8,304 | 33,070 |
| Rhode Island | 258 | 185 | 217 | 270 | 731 | 1,662 |
| South Carolina | 6,289 | 5,250 | 11,970 | 26 | 15,800 | 39,335 |
| Texas | 26,677 | 27,717 | 77,835 | 181 | 42,534 | 174,944 |
| Virginia | 7,307 | 8,782 | 19,531 | 347 | 29,924 | 65,890 |
| Washington | 4,168 | 4,320 | 8,860 | 25 | 4,639 | 22,013 |
To view Excel files, you can use the Microsoft Excel Viewer.
You will need the Adobe Reader to view the PDFs on this page.