Freight Facts and Figures 2013
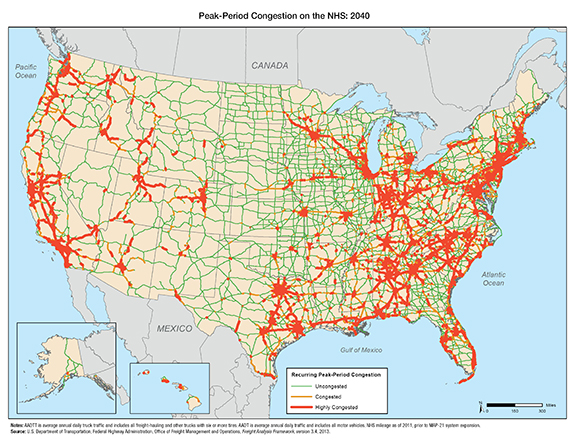
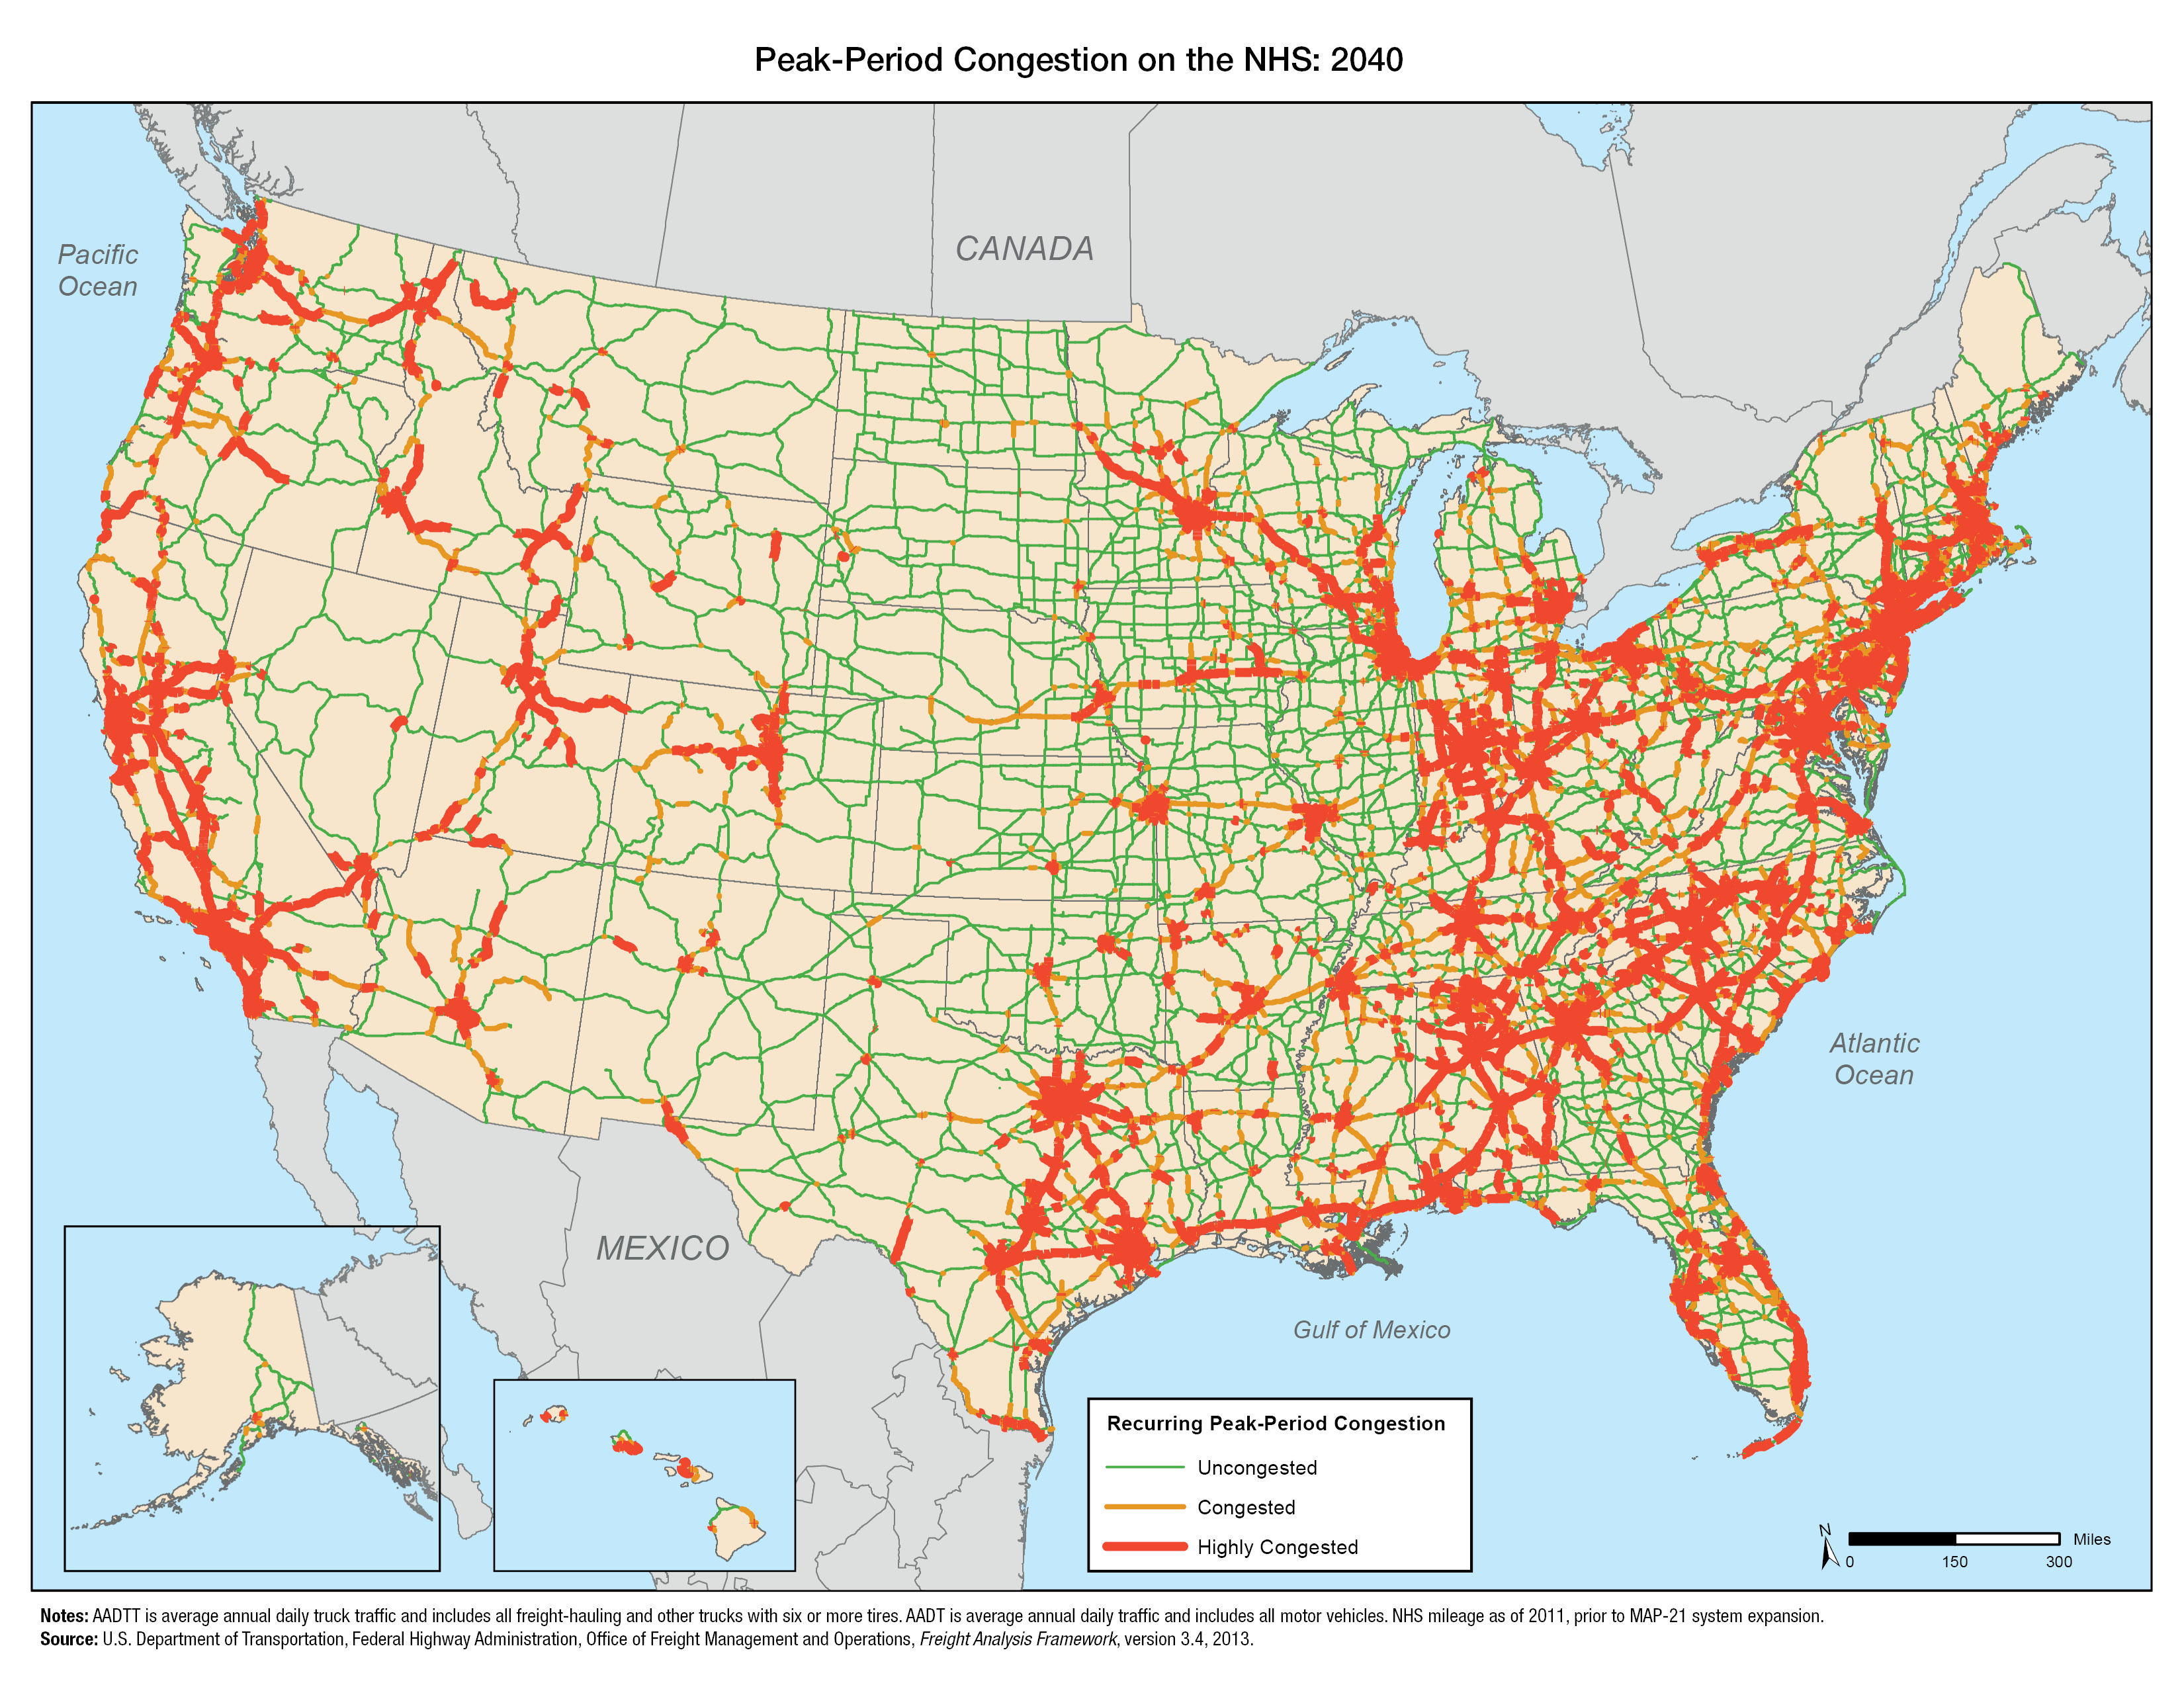
Figure 3-17. Peak-Period Congestion on the National Highway System: 2040
Assuming no changes in network capacity, increases in truck and passenger vehicle traffic are forecast to expand areas of recurring peak-period congestion to 34 percent of the NHS in 2040 compared with 10 percent in 2011. This will slow traffic on 28,000 miles of the NHS and create stop-and-go conditions on an additional 46,000 miles.
Figure 3-17
Notes:
AADTT is average annual daily truck traffic and includes all freight-hauling and other trucks with six or more tires. AADT is average annual daily traffic and includes all motor vehicles. NHS mileage as of 2011, prior to MAP-21 system expansion.
Sources:
U.S. Department of Transportation, Federal Highway Administration, Office of Highway Policy Information, Highway Performance Monitoring System; and Office of Freight Management and Operations, Freight Analysis Framework, version 3.4, 2013.
You may need the Adobe® Reader® to view the PDFs on this page.