Freight Facts and Figures 2013
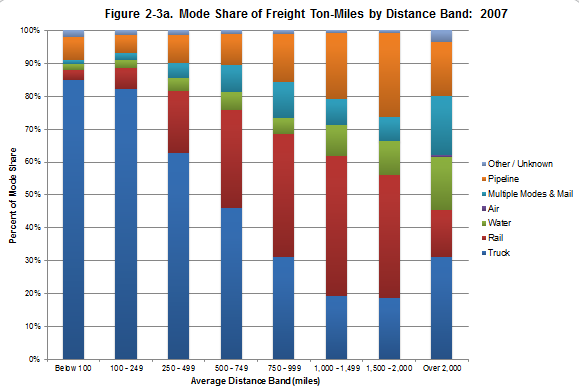
Figure 2-3a. Mode Share of Freight Ton-Miles by Distance Band: 2007
The modal distribution for ton-miles is similar to that for tons, with the exception of long-distance water moves. Rail moved nearly two-thirds of total ton-miles while pipelines accounted for 70 percent of ton-miles over distances more than 1,000 miles.
Figure 2-3a
[PDF 64KB]
Data represented in the figure.
Millions of tons
| Mileage range | Truck | Rail | Water | Air | Multiple Modes and Mail | Pipeline | Other/Unknown | Total |
|---|---|---|---|---|---|---|---|---|
| Below 100 | 321 | 12 | 7 | 0 | 4 | 27 | 8 | 378 |
| 100-249 | 476 | 36 | 15 | 0 | 11 | 32 | 9 | 578 |
| 250-499 | 460 | 138 | 30 | 0 | 33 | 62 | 10 | 734 |
| 500-749 | 248 | 161 | 29 | 0 | 44 | 52 | 6 | 539 |
| 750-999 | 178 | 215 | 28 | 0 | 63 | 82 | 7 | 573 |
| 1,000-1,499 | 247 | 540 | 120 | 1 | 102 | 255 | 10 | 1,274 |
| 1,500-2,000 | 148 | 297 | 81 | 1 | 57 | 203 | 6 | 791 |
| Over 2,000 | 272 | 124 | 139 | 7 | 156 | 143 | 31 | 871 |
| Total | 2,349 | 1,522 | 450 | 9 | 469 | 855 | 86 | 5,739 |
Source:
U.S. Department of Transportation, Federal Highway Administration, Office of Freight Management and Operations, Freight Analysis Framework, version 3.4, 2012.
You may need the Microsoft Excel Viewer to view Excel files on this page.
You may need the Adobe® Reader® to view the PDFs on this page.