Freight Facts and Figures 2013
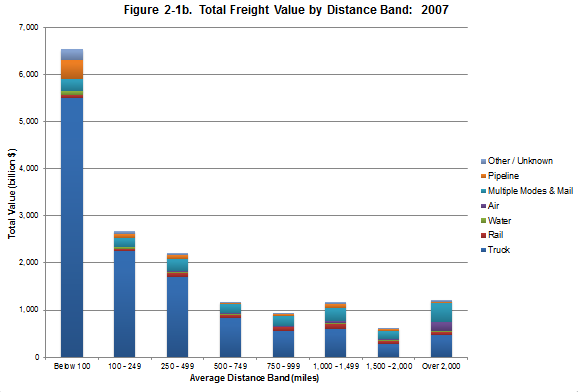
Figure 2-1b. Total Freight Value by Distance Band: 2007
Nearly 40 percent of the total value of goods are moved less than 100 miles while long-distance moves (2,000 or more miles) accounted for 7 percent of the total value of shipments.
Figure 2-1b
[PDF 60KB]
Data represented in the figure.
Billions of dollars
| Mileage range | Truck | Rail | Water | Air | Multiple Modes and Mail | Pipeline | Other/Unknown | Total |
|---|---|---|---|---|---|---|---|---|
| Below 100 | 5,492 | 77 | 84 | 2 | 244 | 396 | 239 | 6,535 |
| 100-249 | 2,247 | 50 | 32 | 9 | 182 | 93 | 58 | 2,670 |
| 250-499 | 1,696 | 81 | 24 | 35 | 242 | 86 | 55 | 2,220 |
| 500-749 | 832 | 68 | 14 | 22 | 184 | 37 | 24 | 1,180 |
| 750-999 | 565 | 66 | 9 | 28 | 209 | 39 | 22 | 938 |
| 1,000-1,499 | 603 | 101 | 20 | 38 | 290 | 78 | 32 | 1,163 |
| 1,500-2,000 | 281 | 62 | 14 | 33 | 163 | 43 | 13 | 609 |
| Over 2,000 | 475 | 69 | 15 | 190 | 403 | 22 | 30 | 1,204 |
| Total | 12,192 | 574 | 212 | 357 | 1,917 | 794 | 472 | 16,518 |
Source:
U.S. Department of Transportation, Federal Highway Administration, Office of Freight Management and Operations, Freight Analysis Framework, version 3.4, 2012.
You may need the Microsoft Excel Viewer to view Excel files on this page.
You may need the Adobe® Reader® to view the PDFs on this page.