Freight Facts and Figures 2012
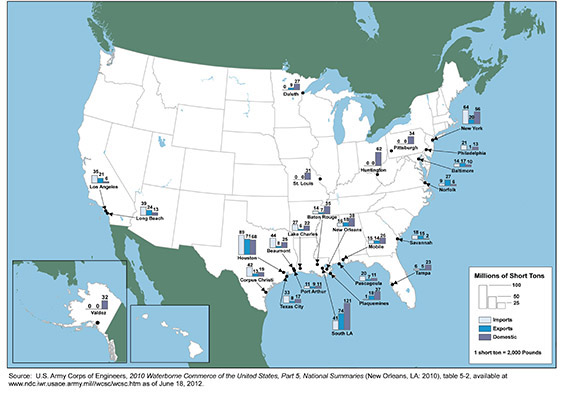
Figure 3-5. Top 25 Water Ports by Tonnage: 2010
Although the top ports for containerized cargo are primarily on the Pacific and Atlantic Coasts, bulk cargo, such as coal, crude petroleum, and grain move through ports on the Gulf Coast and inland waterway system. The top 25 water ports by tonnage handle about two-thirds of the weight of all foreign and domestic goods moved by water.

Data represented in the figure.
Millions of short tons
| Imports | Exports | Domestic | Total | |
|---|---|---|---|---|
| South Louisiana, LA | 41.2 | 74.0 | 121.1 | 236.3 |
| Houston, TX | 88.5 | 71.1 | 67.6 | 227.1 |
| New York, NY and NJ | 63.9 | 19.8 | 55.5 | 139.2 |
| Beaumont, TX | 44.3 | 7.5 | 25.2 | 77.0 |
| Long Beach, CA | 38.8 | 23.7 | 12.9 | 75.4 |
| Corpus Christi, TX | 41.7 | 13.2 | 18.8 | 73.7 |
| New Orleans, LA | 15.7 | 18.4 | 38.3 | 72.4 |
| Los Angeles, CA | 34.6 | 21.3 | 6.4 | 62.4 |
| Huntington, WV-KY-OH | - | - | 61.5 | 61.5 |
| Texas City, TX | 32.6 | 7.5 | 16.5 | 56.6 |
| Plaquemines, LA | 1.4 | 17.6 | 36.9 | 55.8 |
| Mobile, AL | 15.1 | 14.3 | 26.4 | 55.7 |
| Baton Rouge, LA | 14.1 | 6.6 | 34.8 | 55.5 |
| Lake Charles, LA | 26.9 | 6.1 | 21.6 | 54.6 |
| Norfolk Harbor, VA | 8.8 | 26.6 | 6.2 | 41.6 |
| Baltimore, MD | 13.5 | 16.7 | 9.5 | 39.6 |
| Pascagoula, MS | 20.0 | 6.6 | 10.7 | 37.3 |
| Duluth Superior, MN-WI | 0.3 | 9.3 | 26.9 | 36.6 |
| Savannah, GA | 17.5 | 15.4 | 1.8 | 34.7 |
| Tampa, FL | 5.8 | 5.4 | 23.0 | 34.2 |
| Philadelphia, PA | 21.0 | 0.5 | 12.6 | 34.0 |
| Pittsburgh, PA | - | - | 33.8 | 33.8 |
| Valdez, AK | - | - | 31.9 | 31.9 |
| St. Louis, MO | - | - | 30.8 | 30.8 |
| Port Arthur, TX | 10.8 | 8.7 | 10.8 | 30.2 |
Note:
1 short ton = 2,000 pounds. Numbers may not add to totals due to rounding.
Source:
U.S. Army Corps of Engineers, 2009 Waterborne Commerce of the United States, Part 5, National Summaries (New Orleans, LA: 2010), table 5-2, available at www.ndc.iwr.usace.army.mil//wcsc/wcsc.htm as of June 18, 2012.
You may need the Microsoft Excel Viewer to view Excel files on this page.
You may need the Adobe® Reader® to view the PDFs on this page.