Freight Facts and Figures 2012
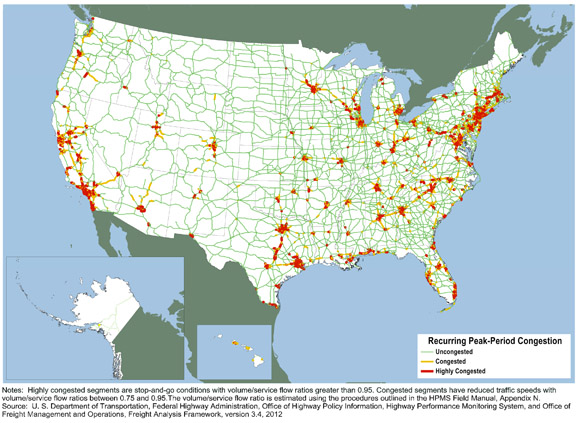
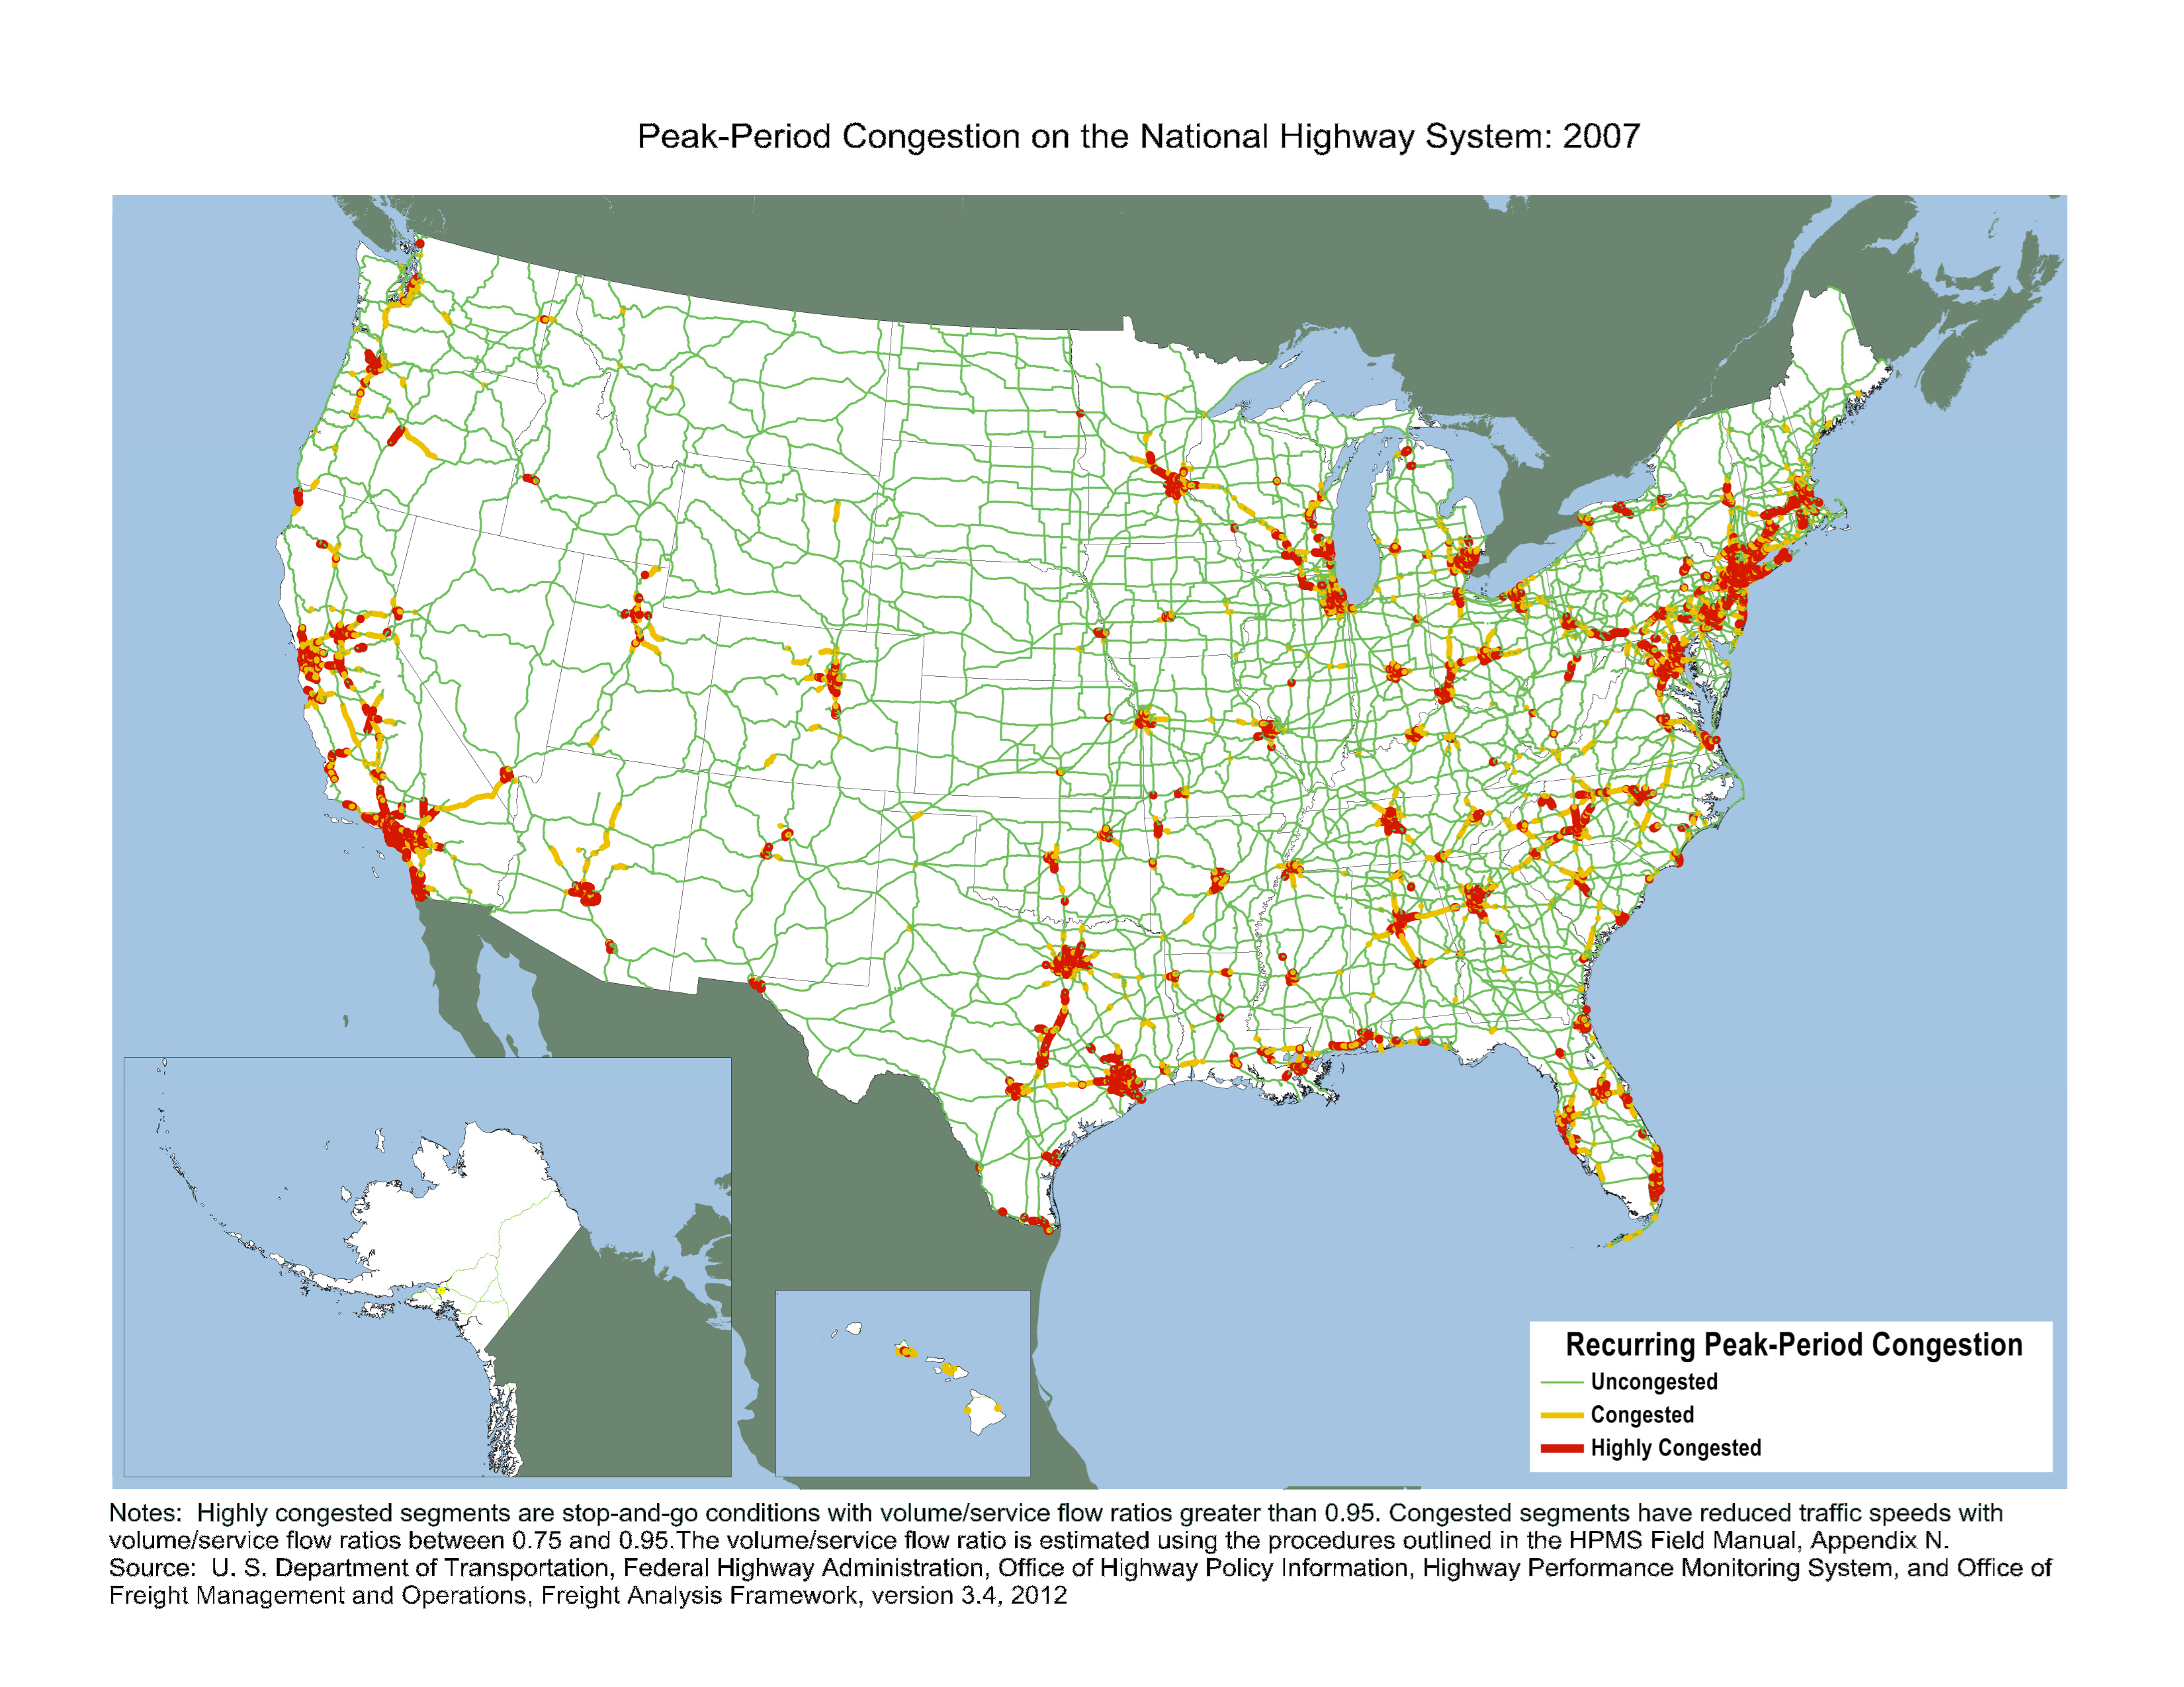
Figure 3-15. Peak-Period Congestion on the National Highway System: 2007
Recurring congestion caused by volumes of passenger vehicles and trucks that exceed capacity on roadways during peak periods is concentrated primarily in major metropolitan areas. In 2007, peak-period congestion resulted in traffic slowing below posted speed limits on 11,700 miles of the NHS and created stop-and-go conditions on an additional 6,700 miles.
Notes:
Highly congested segments are stop-and-go conditions with volume/service flow ratios greater than 0.95. Congested segments have reduced traffic speeds with volume/service flow ratios between 0.75 and 0.95. The volume/service flow ratio is estimated using the procedures outlined in the HPMS Field Manual, Appendix N.
Sources:
U.S. Department of Transportation, Federal Highway Administration, Office of Highway Policy Information, Highway Performance Monitoring System; and Office of Freight Management and Operations, Freight Analysis Framework, version 3.4, 2012.
You may need the Adobe® Reader® to view the PDFs on this page.