Freight Facts and Figures 2011
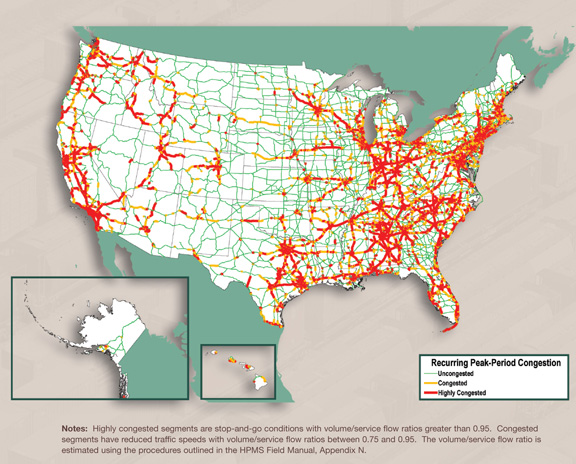
Figure 3-14. Peak-Period Congestion on the National Highway System: 2040
Assuming no changes in network capacity, increases in truck and passenger vehicle traffic are forecast to expand areas of recurring peak-period congestion to 36 percent of the NHS in 2040 compared with 11 percent in 2007. This will slow traffic on 20,300 miles of the NHS and create stop-and-go conditions on an additional 39,000 miles.
Sources:
U.S. Department of Transportation, Federal Highway Administration, Office of Highway Policy Information, Highway Performance Monitoring System; and Office of Freight Management and Operations, Freight Analysis Framework, version 3.1, 2010.
You will need the Adobe Reader to view the PDFs on this page.